
When a new SRT deal tape arrives, the first instinct is to pull credit data on the underlying pool. For most of the names on the tape, that search returns no results.
SRT reference pools are dominated by private, mid-market corporate borrowers that traditional rating agencies, such as S&P, Moody’s, and Fitch, don’t cover and that CDS markets don’t price. The issuing bank’s internal ratings do cover them, but the bank is the seller; its view cannot substitute for an independent benchmark.
At the same time, supply is outpacing validation instruments because the Basel IV output floor is accelerating issuance on the issuer side.
The framework is pushing capital costs on unrated corporate exposures higher, prompting banks to either raise equity or transfer risk via SRT. SRT is the more capital-efficient path, and the volume of deals reflects it.
Global SRT issuance hit a record of approximately $30 billion in first-loss tranches in 2024, protecting nearly $300 billion, up from $150 billion in 2021 in underlying loan assets. Total outstanding placed tranches are estimated at $70 billion globally, with loans linked to these transactions reaching approximately $1 trillion.
The asset class has grown at roughly 18% annually since 2010, surpassing European CLOs in growth rate, and 2024 saw record volumes, record numbers of bank issuers, and record transaction counts. Meanwhile, corporate and SME loans, precisely the borrower profile that traditional credit data infrastructure wasn’t built to cover, account for nearly 80% of total SRT issuance.
This article works through that problem, starting with why reference pools are so difficult to assess, through to how the diligence workflow operates across disclosed and blind pools.
Why SRT Reference Pools Are Hard to Assess
The Unrated Borrower Problem
A deal tape arrives with 200 corporate borrowers, and the first thing a credit analyst does is check for ratings. However, many global entities have no rating from a traditional agency because they were never built to cover them. Even in disclosed pools where investors have names, CRA coverage is minimal.
S&P, Moody’s, and Fitch focus their coverage on large public issuers, companies that access the debt capital markets and pay for ratings to do so. The private, mid-market corporate borrowers that dominate SRT reference pools operate entirely outside that model. They borrow from banks, not bond markets. They don’t need a public rating, and they don’t have one.
The Independence Problem
SRT issuing banks don’t leave investors entirely without data. As part of the deal package, they provide internal ratings on the pool, which are credit assessments by the bank’s own analysts for each underlying borrower. For disclosed pools, this can be granular: individual obligor ratings, probability-of-default estimates, and internal grade distributions across the full pool.
The quality of the data is not in doubt. But the data source raises concerns about bias.
Because the bank is the seller, the ratings reflect its underwriting standards, risk appetite, and interest in completing the transaction. That doesn’t make the data wrong; many bank internal ratings are rigorous, regulator-reviewed, and carefully maintained. But it does make the data insufficient as a standalone benchmark.
An investor who validates pricing solely against the issuing bank’s internal view has no independent read on whether that view is optimistic, conservative, or consistent with what the broader lending community thinks about the same borrowers.
What they need is a third-party credit view derived from institutions with actual lending exposure to the same types of borrowers, such as the aggregated credit judgments of peer banks. For example, in a sample of 2,476 loans across 1,241 companies, 96% had a consensus credit estimate available where no agency rating existed.
For context on how alternative credit data providers address this gap, Check out this guide on the leading providers that covers what each offers and where each falls short.
The Disclosure Spectrum
Banks issue SRT transactions with varying levels of transparency into the underlying obligors, and where a deal sits on the disclosure spectrum determines the entire analytical approach an investor must take.
At one end are fully disclosed pools. The bank reveals the identities of all underlying borrowers, such as specific legal entities, not just parent groups. The investor can run entity-level analysis to map the exact obligor, benchmark its credit quality against independent sources, and compare that view against the issuing bank’s internal assessment. However, coverage limitations in CRAs mean that even with names in hand, most obligors still have no public rating.
At the other end of the spectrum are blind pools, which are more common in practice. Here, the bank provides only aggregate metadata (industry and geographic breakdowns, average company size, tenor distribution, and internal rating distribution across the pool) for an average of 484 loans, without entity names. The diligence framework shifts entirely to the sector and portfolio level.
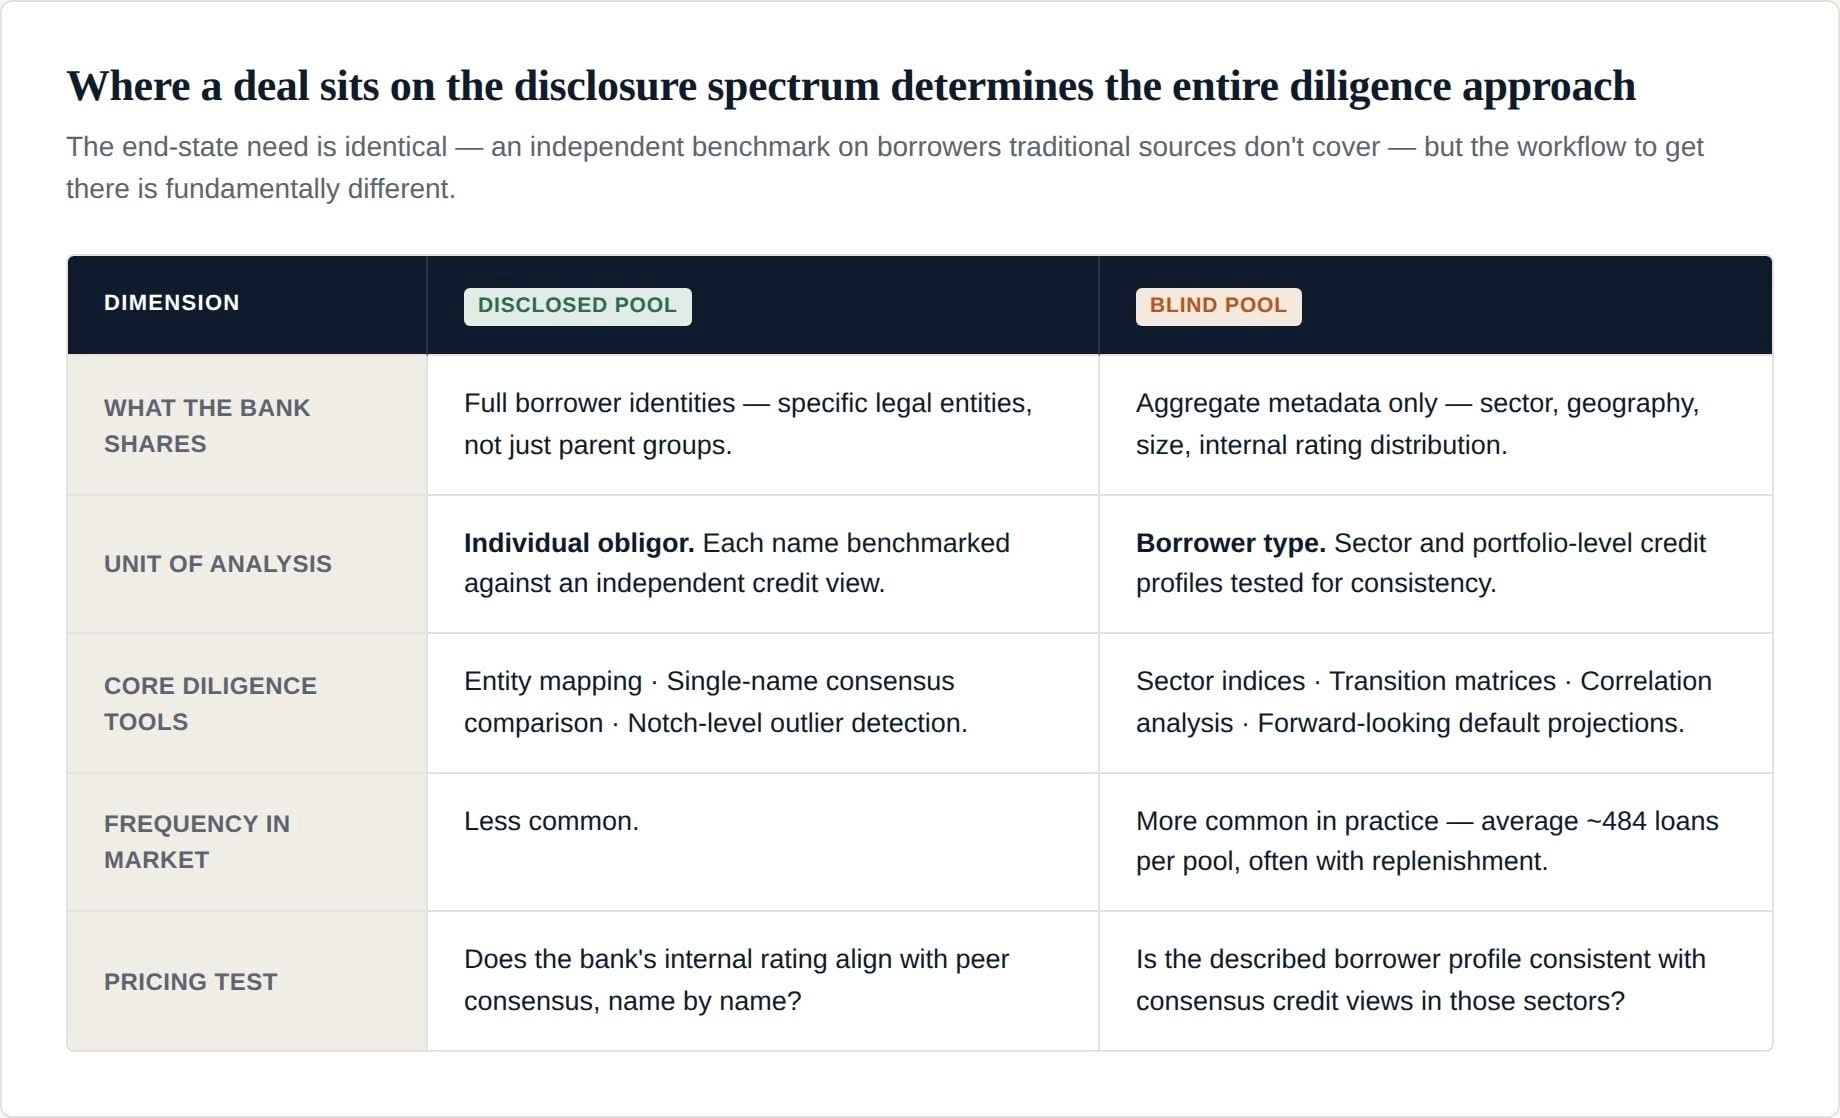
The diligence workflow is fundamentally different depending on where a deal sits on this spectrum. But the core need is the same across both ends: an independent, consensus-based credit view on borrower types that traditional data sources weren’t designed to cover.
Assessing Disclosed Pools
Disclosed pools give investors borrower names; but names alone don’t produce a credit view. Most obligors in a disclosed SRT pool carry no public rating. The diligence workflow starts with identifying the exact legal entity behind each name and ends with an independent benchmark against which the issuing bank’s assessment can be tested.
Entity Mapping
The starting point for disclosed pool diligence is identifying the entity. A deal tape that lists borrower names rarely lists them in a form that maps cleanly to a single legal entity.
A name like “Müller Group” might refer to the parent holding company, a trading subsidiary, or a specific operating entity. Each sits at a different point in the corporate structure with a different credit profile. For instance, the parent may be investment grade and carry a public rating or a well-known credit profile, while the subsidiary holding the actual loan exposure does not. Getting the entity wrong means getting the credit assessment wrong, and a 200-name pool with a 48-hour response window leaves no time to catch those errors.
Analyzing the parent and assuming it proxies for the subsidiary introduces error at the first step of the workflow, before any credit assessment has been attempted.
Entity mapping is the process of reconciling the names on a deal tape with their exact legal counterparts. In practice, this means working through naming inconsistencies, jurisdictional variations, corporate structure complexity, and the fact that different deal tapes from different issuing banks will represent the same entity differently.
CB’s proprietary CBID matching functionality addresses this directly; its matching algorithms reconcile borrowers with CB internal identifiers, normalizing for different naming schemas across multiple deal tapes from different lenders.
Identifying Outliers

Material divergence between the issuing bank’s internal rating and the peer consensus on a specific obligor is the signal that requires the most immediate attention. A name the bank rates BB, while the consensus rates B+ or lower, raises a direct question: is the bank’s underwriting more optimistic than its peers on this credit, and if so, why?
The answer shapes the response, as divergence can have three explanations:
- First, the issuing bank may hold genuinely proprietary information, such as a deeper relationship with the borrower that the peer consensus doesn’t reflect.
- Second, the bank’s internal rating may lag recent credit deterioration that peer institutions have already captured in their assessments.
- Third, the divergence may reflect optimistic underwriting that has never been benchmarked externally.
The first explanation can justify the gap. The second and third are reasons to revisit pricing assumptions before committing.
Individual outliers need to be read in the context of the full pool. A pool where two or three names diverge from consensus requires deeper investigation. While a pool where 15% of obligors diverge suggests the bank’s overall view of the pool is more optimistic than the peer consensus, which has direct implications for how the first-loss tranche is priced.
Assessing Blind Pools

Credit Benchmark has nuanced PD, transition matrices, and net deterioration (CRI) data on an extensive set of geographies and industry sectors.
When no borrower names are disclosed, the analytical framework shifts entirely to sector and portfolio level. The investor cannot assess individual obligors; they must assess borrower types, testing whether the credit profile the issuing bank has described holds up against independent consensus data for those sectors and geographies. Four analytical tools make that assessment possible.
Working With Metadata
When the issuing bank provides no borrower names, the investor can’t look up specific companies because they don’t know who they are.
What they have instead is a pool profile describing the borrower population in aggregate terms. The bank might present it as European mid-market industrials, with an average revenue of €150 million and 60% investment-grade per its internal ratings.
The analytical question changes entirely. Instead of assessing specific borrowers, the investor is assessing a borrower type, testing whether the credit profile the bank has described is consistent with independent consensus views on credit quality across those sectors and geographies.
Two structural features of the SRT market make this more demanding than it sounds.
First, most corporate SRT portfolios involve blind pools with long replenishment periods, as new borrowers are added over time. This makes sector-level assessment a continuous obligation rather than a one-time exercise at deal inception.
Second, the market is growing rapidly. ECB data shows outstanding SRT corporate loans in the euro area grew from approximately €60 billion at end-2018 to over €300 billion by Q3 2024. More deals mean more blind pools to assess. And the shortage of independent sector-level data to do it is becoming more acute.
Sector Indices and Credit Trends
Blind pool diligence starts with a question the investor can answer without knowing any borrower names: what does independent data show about credit quality in the sectors and geographies the bank has described?
The answer comes from sector credit indices built from actual bank lending assessments. An index covering European mid-market industrials reflects what banks with real lending exposure to those companies actually think about credit conditions in that segment. That’s a fundamentally different signal from agency ratings, which track large public issuers, or market-implied indicators, which don’t exist for private borrowers.
The questions these indices answer are the same ones an investor needs to resolve before pricing a blind pool trade. Has credit quality in this sector been improving or deteriorating? What is the investment-grade to high-yield split among mid-market companies in this region? Is the trend stable or accelerating in either direction?
Transition Matrices
Sector indices show where credit quality is now and how it has been trending. Transition matrices answer the forward-looking question: given current credit conditions in this sector, how likely are borrowers to migrate to a lower credit category over the next twelve months?
For a pool described as 60% investment-grade, the investor needs to know what percentage of investment-grade mid-market European corporates in that sector have historically migrated to high yield over a 12-month period. That migration rate, and how it changes under stress, feeds directly into expected loss calculations and first-loss tranche sizing.
For example, a pool where 5% of investment-grade obligors historically migrate to high yield annually requires a materially larger loss cushion than one where migration is 1%. Across a pool of several hundred obligors with a multi-year tenor, that difference determines whether the coupon on offer adequately compensates for the risk being absorbed.
Institutions managing IFRS 9 obligations could also have another use for these transition matrices. Staging decisions between Stage 1 and Stage 2 require evidence of a significant increase in credit risk. Transition matrices provide an external reference point, making them relevant for the broader ECL governance framework within which many SRT investors operate.
Correlation Matrices
Sector diversification on paper doesn’t always mean diversification in practice. A pool described as 40% industrials and 30% consumer goods appears to be spread across sectors. But if those two sectors historically deteriorate simultaneously, such as when their credit migration patterns are highly correlated, the pool behaves like a concentrated position when credit conditions worsen.
Correlation analysis is what tests the difference. The investor needs to know whether the sectors in the pool move independently or together under stress. If they move together, the effective concentration of the portfolio exceeds the metadata’s suggestion, and the first-loss tranche needs to be sized and priced accordingly.
Forward-Looking Default Projections
Transition matrices and correlation analysis tell the investor what has happened historically. They don’t tell the investor what is happening now or where credit quality is heading. That’s what forward-looking default projections address.
For SRT investors, tracking net downgrades (CRI) across the pool has practical applications. Pre-trade, a consistently negative CRI in the pool’s sectors signals that pricing assumptions need to be more conservative. Post-trade, it flags sector-level credit migration in replenishment pools before it reaches individual names or triggers covenant events.
However, neither application works without timely data. Rating agency downgrades typically follow deterioration by six to twelve months.
Monitoring the Pool After Execution
Executing a trade opens a monitoring obligation, not closes one. Borrowers migrate, pools replenish, and credit conditions shift over a multi-year tenor. The diligence process doesn’t end at inception, but continues throughout the life of the position.
Tracking Credit Migration
SRT positions carry credit exposure for three to five years, often longer. The credit quality of the underlying pool changes over that time. Investors who rely on inception-day analysis are working with information that gets staler every quarter.
The monitoring framework mirrors the initial diligence workflow. Weekly consensus updates track credit upgrades and downgrades across the borrower population, providing a near real-time view of directional shifts that quarterly agency review cycles cannot match.
Meanwhile, net downgrades (CRI) provide the portfolio-level signal. When net downgrades in a sector consistently outpace upgrades, the net downgrades (CRI) flag the shift before it translates into observable defaults or formal rating actions.
For an investor with significant pool exposure to European consumer goods, deteriorating net downgrades (CRI) is an early warning to reassess loss assumptions, rather than a reactive response to defaults that have already occurred.
The agency’s timing lag makes this critical. Rating downgrades typically follow actual deterioration by six to twelve months. A pool that looked 65% investment grade at inception may have migrated materially before a single agency action confirms it. Weekly consensus data tracks that migration in near real time, closing the gap between what the lending community already knows and what formal ratings eventually reflect.
Replenishment Pools
Many SRT structures allow the issuing bank to substitute existing obligors or add new borrowers over the life of the transaction. The pool an investor assessed at inception is not necessarily the pool they hold twelve months later. Each new obligor requires the same diligence as the original deal tape. But it’s impractical to run manual diligence on each one.
Replenishment is also where the disclosed and blind pool frameworks converge. An investor who received no names at inception may receive partial disclosure on substitutions over time. The diligence framework needs to accommodate both: entity-level analysis, where names are available, and sector-level benchmarking, where they are not.
Valuation Complexity
As SRT structures have grown more sophisticated, valuation has become a distinct challenge alongside credit diligence. Mezzanine tranches, conditional triggers, and complex waterfall structures mean that loss-adjusted cash flow modeling requires more than a credit view of the underlying pool; it requires independent valuation support capable of pricing the instrument’s structural features.
Benchmarking Borrowers Against the Consensus
Once entities are correctly identified, the diligence question becomes: what does the independent credit community think about these borrowers, and how does that view compare to what the issuing bank is showing? This is where Credit Benchmark’s synthetic credit risk analytics capability is most directly applicable.
Consensus Credit Ratings are aggregated from 40+ global banks, nearly half of them G-SIBs. Each has actual lending exposure to the same mid-market corporate universe and internal credit models calibrated to their own loss experience under regulatory oversight. The resulting dataset covers 110,000+ entities, 90% of which are unrated by traditional agencies, mirroring the borrower profile that dominates SRT reference pools. This makes the consensus a credible independent benchmark.
To use it, the investor compares two views for each obligor in the pool: the issuing bank’s internal rating and the peer consensus. Where they align, the bank’s assessment is independently corroborated. Where they diverge materially, that gap requires explanation before pricing is finalised, but not a reason to pass on the trade.
The accuracy of that consensus has been independently validated. Over a ten-year period, CB’s consensus ratings were tested against actual defaults across 4,247 entities. CB’s one-year Gini ratio came in at 0.88, against S&P’s 0.91, with the gap remaining narrow at three, five, and seven-year horizons.
Additionally, Credit Benchmark was recognized as SRT Service Provider of the Year at the SCI CRT Awards 2024, and close to 40 major SRT market participants now use CB data for transactional, decision-support, and workflow use cases.
Case Study: Pricing SRT Trades on Undisclosed Obligors with Consensus Data
Most analytical frameworks for SRT diligence describe what investors should do in theory. This section works through how to use CB’s consensus credit dataset to price trades on undisclosed obligors across multiple geographies, industries, and credit categories. The full methodology is set out in CB’s SRT spotlight and the supporting case study.
To illustrate how the workflow operates in practice, consider the following scenario. An investor is writing credit protection on an obligor basket spanning European and global corporate credits across multiple sectors. The obligors are undisclosed, and the investor has only pool-level metadata. Three analytical tools, applied in sequence, make independent pricing possible.
Credit Cycles and the CRI Signal
The first step is establishing where the relevant sectors sit in the credit cycle. This involves establishing not just where they are today, but how it has been trending and where turning points have historically occurred.
CB’s twelve-month rolling net downgrades (CRI) records all default probability changes across every credit category in a defined population. When the net downgrades turn consistently negative in a sector, it signals that credit quality is deteriorating across that borrower population, typically ahead of observable default rate increases and well ahead of CRA rating updates. Two examples from CB’s sector indices show the practical application of this.
The EU Broadline Retailers index, covering 45 constituents, posted significant deterioration from mid-2019, well before Covid stress became visible in public market data. Post-COVID recovery remained patchy, and the index turned negative again in early 2023. The EU Automobiles index, covering 93 constituents, followed a different path: a sharp deterioration peak during early Covid, followed by a recovery that held slightly positive thereafter.
The implication for SRT investors is direct. A pool concentrated in European retail in 2019 carried deteriorating cycle risk that no public signal reflected. A pool concentrated in automotive exposure carried a different trajectory. The CRI makes those differences visible before pricing is finalised.
12-Month Projected Default Rate Distributions
While CRI identifies direction, default rate projections quantify the probability distribution of default rate outcomes for a given sector over the next twelve months.
CB constructs these distributions by projecting trends in credit categories and transitions across its full dataset. The output shows the range of plausible default rate paths, with the upper and lower limits representing the 10th and 90th percentile outcomes across a large number of projected scenarios.
Two examples from CB’s dataset show how materially this differs by market.
- For global corporations, covering 20,533 constituents, the projected range runs from 1.25% to 1.56%. This is a positively skewed distribution with limited upside tail risk.
- For Swedish corporates, covering 89 constituents, the range runs from 0.46% to 1.15%, with a small but non-trivial probability of the default rate almost doubling to above 1.15%. The distribution is more symmetric, with meaningful tail risk in both directions.


For a pool with significant Swedish corporate exposure, pricing on average PD alone understates the tail risk the distribution reveals. The shape and position of the range (not just the central estimate) belong in the coupon.
Portfolio Diversification via Projection Correlation
CRI and default-rate projections are built at the sector level. The next step brings them together at the portfolio level to assess whether the sector mix truly diversifies risk or unintentionally concentrates it.
What matters is how net downgrades (CRI) signals move across sectors. When credit cycles diverge, the portfolio gains real diversification. When cycles move in sync, that benefit largely disappears, even if the sector allocation appears well balanced. A study by Credit Benchmark shows this effect.
When comparing projected default rates across ten countries and regions, the portfolio’s average matched the simple average of the individual indices, but its range of outcomes was lower than any single index. This reduction in risk came from differences in the timing of turning points in CRI signals and from negative correlations in projected default paths across country–sector combinations.
These ideas translate directly to SRT portfolio construction. Separating high-yield and investment-grade exposures allows a clearer view of how shocks affect different tranches. CRI correlations can be used to test whether assumed default correlations are realistic. The CRI series can also feed into a z-factor framework to project rating transitions and future credit distributions across the portfolio.
Single-Name CCR Comparison (Extension to Disclosed Pools)
When partial or full disclosure is available, the same CB data applies at the obligor level. Individual obligors are mapped to consensus credit ratings and plotted against the issuing bank’s internal ratings, producing a notch-level comparison across the full pool.
The output is a bubble chart with red dotted lines marking divergences of more than one notch. Names outside those lines become the immediate focus of diligence. The investor investigates the divergence or adjusts pricing assumptions accordingly.

The analysis serves both sides. Investors use it pre-trade to assess the inbound portfolio and stress-test pricing. Issuing banks can use the same comparison to demonstrate underwriting quality to potential investors. Post-trade, the CCR data support ongoing surveillance through substitutions and replenishment. This provides an independent, regularly updated reference point across the full lifecycle of the position.
Conclusion
SRT reference pools are structurally difficult to assess because they are composed of borrowers that traditional credit infrastructure wasn’t built to cover, and that gap widens as the market grows.
The framework this article sets out addresses it at both the entity and sector levels, with one underlying requirement: an independent credit view derived from institutions with actual lending exposure to the same borrower types, used alongside the issuing bank’s internal ratings and any available agency coverage.
A great first step would be a CB coverage assessment of the obligor types, sectors, and geographies most relevant to your current and prospective SRT pools. The output would be a concrete list of where consensus coverage exists for the borrower population you face, and where the largest gaps between issuer-internal and peer-consensus ratings sit in your pipeline.
Book a demo now to get your coverage assessment.
Frequently asked questions
What is a significant risk transfer?
An SRT is a transaction in which a bank transfers the credit risk of a defined pool of loans to third-party investors, typically via a credit-linked note or credit default swap, while retaining the loans on its balance sheet. Regulators permit banks that achieve significant risk transfer to reduce the risk-weighted assets associated with the pool, freeing up capital for new lending. Investors receive a coupon in exchange for absorbing losses on the protected tranche if borrowers default.
How are SRTs regulated?
In the EU, SRTs are governed by the Securitisation Regulation under CRR Articles 244 and 245. The EBA issued updated guidelines in 2017 that clarified SRT criteria and increased market transparency.
In December 2025, the ECB introduced a fast-track assessment for standardised SRT transactions. In the U.S., the Federal Reserve issued guidance in September 2023 clarifying that directly issued credit-linked notes qualify for regulatory capital relief. Basel IV’s output floor, phasing from 50% in 2025 to 72.5% by 2030, is the primary structural driver of growing SRT issuance across all jurisdictions.
What are the different types of SRTs?
Three main structures exist. First, a credit-linked note (CLN) issued directly by the bank — the most common structure in the U.S. Second, a financial guarantee or credit default swap between the bank and an investor, which can be unfunded. Third, a CLN issued by an SPV that provides credit protection to the bank, common in Europe due to STS framework eligibility. The first and third structures are funded, meaning investors provide cash upfront.
What is the difference between a disclosed and blind pool?
In a disclosed pool, the issuing bank reveals the identities of the underlying borrowers, allowing investors to run entity-level credit analysis. In a blind pool, only aggregate metadata is provided — industry, geography, average company size, internal rating distribution — without naming specific obligors. Blind pools are more common and require sector-level credit indices, transition matrices, and correlation analysis rather than entity-level lookup.