
SRT Case Study: Portfolio Risk Management Based on Projected Default Rates
The Significant Risk Transfer (SRT) market continues to expand. Encouraging Fed guidance on credit-linked notes is likely to attract more investors, increasing the need for risk / return benchmarking to ensure transparent pricing and rapid market clearing.
SRT investors effectively write a Credit Default Swap (CDS) on an obligor basket covering multiple geography, industry and credit categories. Pricing across these multiple dimensions is a blend of art and science, especially when the underlying portfolio includes undisclosed obligors.
This note outlines recent applications for Credit Benchmark’s credit consensus dataset in managing portfolio risk and optimizing trade structures.
As the two EU sector charts below show, credit consensus data shows clear credit cycles[1]. These patterns can be used to model the relationship between different geographies and industries, with scope for leads, lags and turning points. They can also be used as inputs to simulate default rate projections.
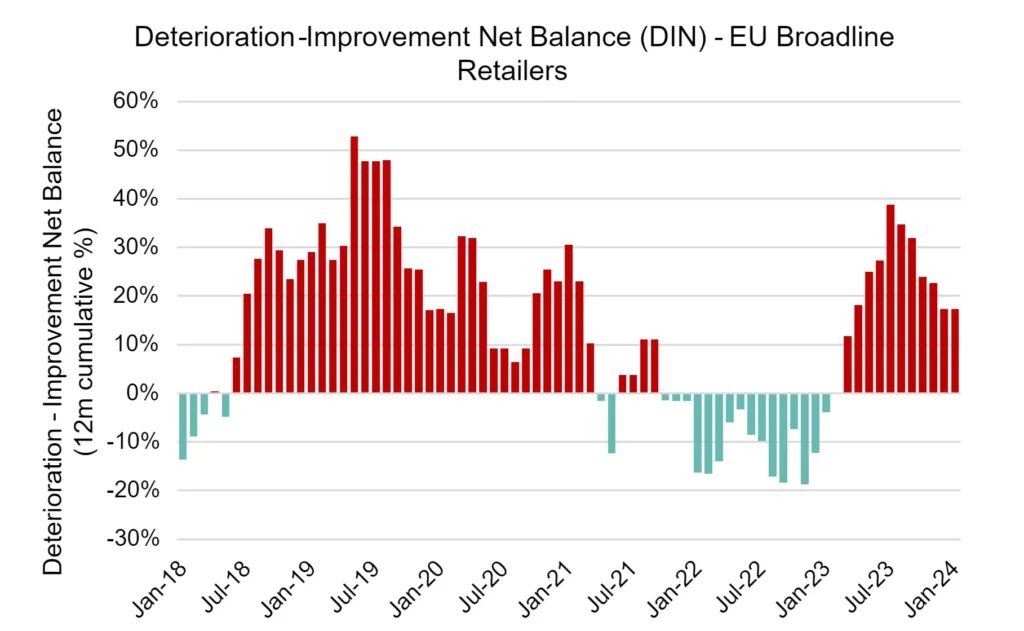
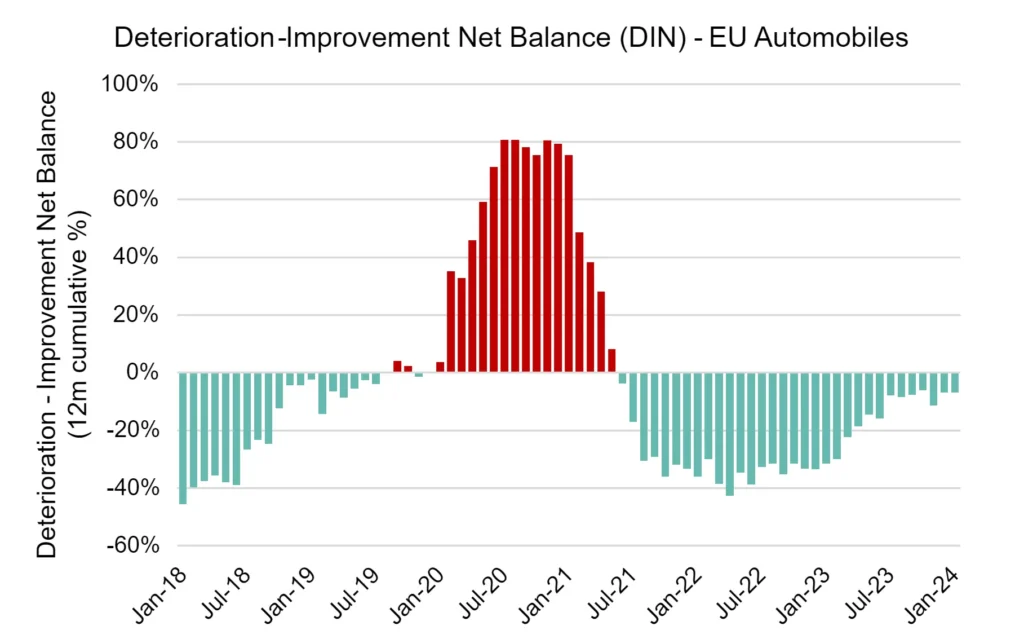
These two charts plot the rolling 12-month cumulative Deterioration/Improvement net balance (DIN), a leading indicator for changes in transition matrices and potentially for observed default rates.
Credit Benchmark’s EU Automobiles index (comprising 93 constituents) show an obvious peak – with deteriorations outnumbering improvements – during the early stages of the Covid pandemic. But Credit Benchmark’s EU Broadline Retailers index (comprising 45 constituents) posted significant deterioration long before that, peaking in mid-2019. Their post-Covid recovery is patchy and turned negative again in early 2023. Autos remain slightly positive.
These are just two of more than 1,200 credit consensus indices available from Credit Benchmark covering geographies and industries; many of those display a strong global credit factor effect during Covid, but they also exhibit specific country and industry effects, as well as leads and lags as credit effects move through supply chains.
These indices are built from credit consensus data that covers a large number of obligors across multiple geographies and industries. The resulting dataset is especially powerful for top-down default rate projections; by projecting trends in credit categories and transitions, it is possible to plot the likely range of default rate outcomes for individual sectors. For some SRT trades, the possible default rate range may be an important factor in pricing.
The examples below contrast Global and Swedish Corporates. These plot the expected position, scale and shape for two contrasting 12-month projections in default rate distributions.
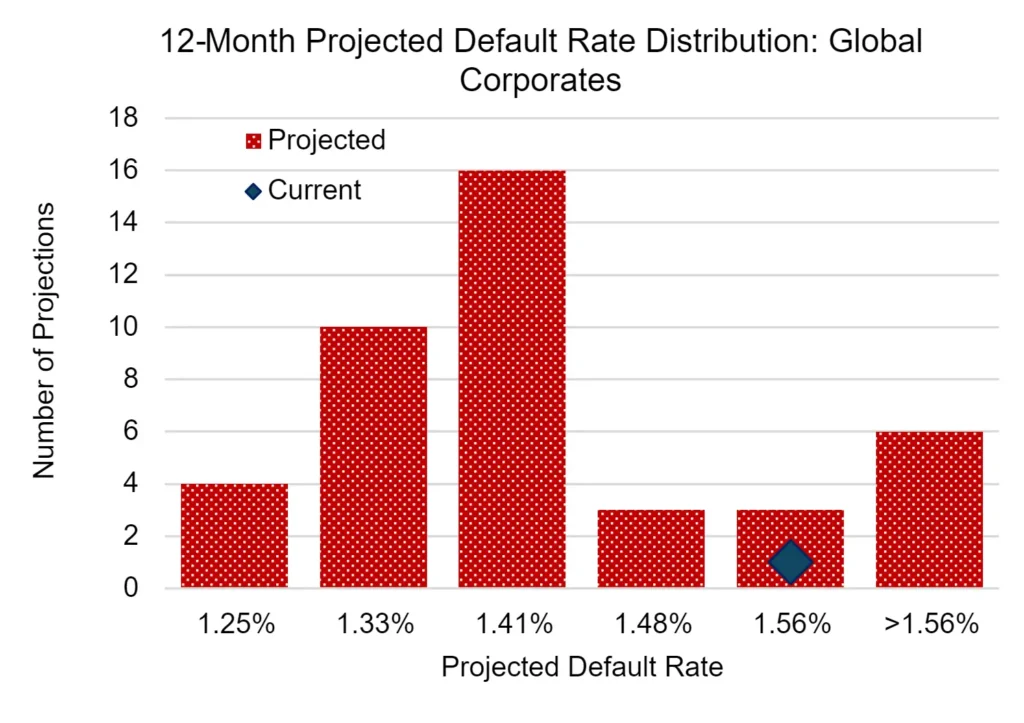
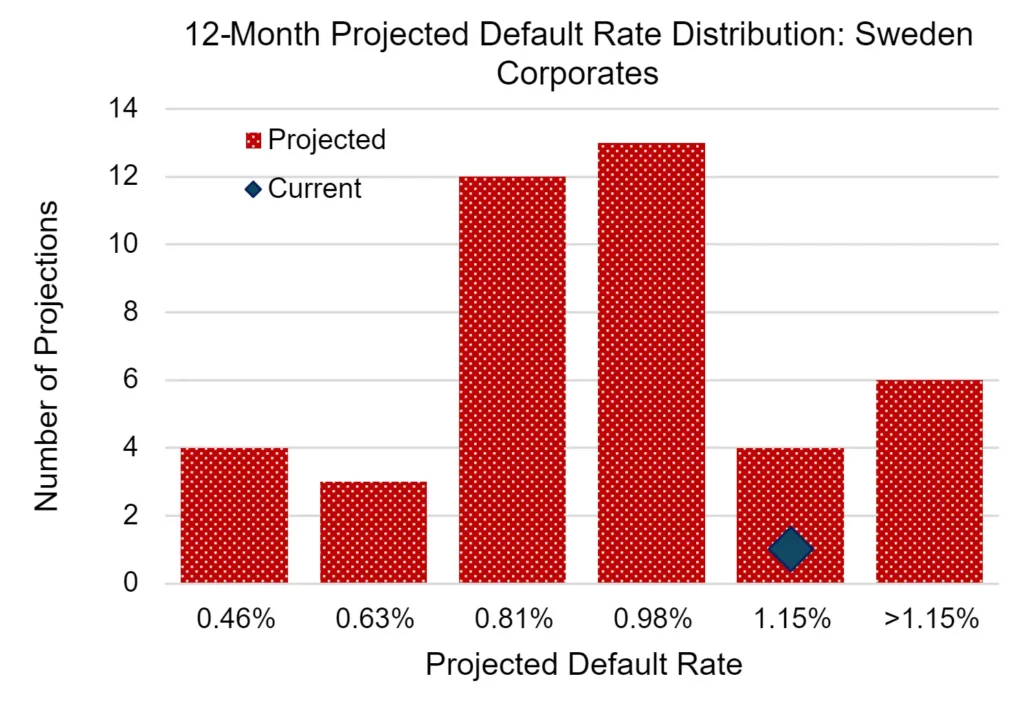
The upper and lower limits plotted here are the 10th and 90th percentiles drawn from a large number of projected default rate paths. Credit Benchmark’s Global Corporates index (comprising 20,533 constituents) show a narrow “Default Rate Index”[2] range of 1.25% to 1.56%, whereas Credit Benchmark’s Swedish Corporates index (comprising 89 constituents) show a wider absolute and % range of 0.46% to 1.15%. The dark diamond shows the current default rate index, so the most likely Global projection is for the median Corporate default rate to fall slightly, from 1.56% to 1.41%, with a small chance of it rising. For Swedish Corporates, the most likely outcome is an increase from 0.63% to the 0.81%-0.98% range, with a small chance that it exceeds 1.15%, almost doubling the possible loan loss.
The Global range is positively skewed (majority of outcomes are clustered on the left) whereas the Swedish Corporate range is more symmetric around the higher projected median.
Predictive analytics like these are powerful when combined in support of portfolio optimization. Leads and lags in the 12m DIN offer scope for diversification (or concentration) as cycles diverge or synchronise; variations in the position and shape of projected default rate ranges can also be offset through optimal portfolio structures.
The scatterplot below shows the projected default rate and projection range for Credit Benchmark indices of corporate obligors in 10 countries / regions; the point labelled “Portfolio” shows the same analytics for the equally weighted average of each plotted credit index.
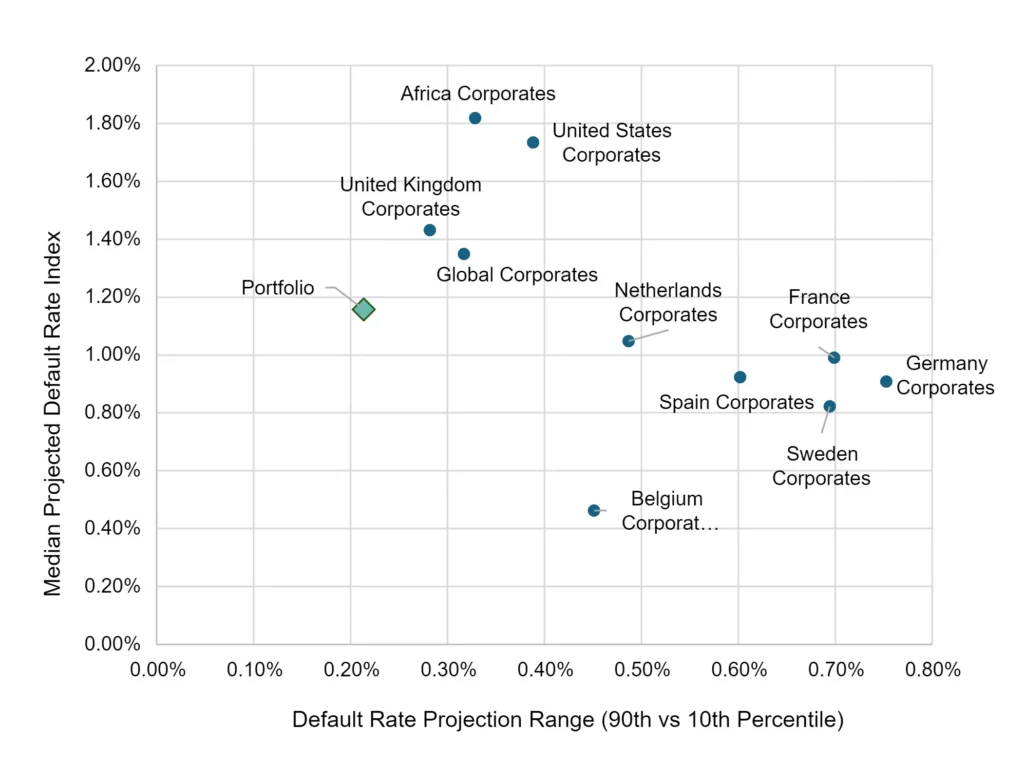
The average projected default rate for the portfolio is the simple average of the default rates for the ten indices, but the range (on the x-axis) is noticeably lower than those of the plotted indices.
This shows the very powerful diversifying effect that a portfolio approach has on this metric. It is the result of (1) divergences in the timing of potential turning points in the Deterioration / Improvement Net balance plus (2) negatively correlated projected default rate paths for different indices.
This analysis can be extended in several ways. For example:
- Projected default rate trends for High Yield and Investment Grade credit categories can be modelled separately, to give a more granular assessment of the impact of default spikes on tranches.
- Correlations in the Deterioration / Improvement Net (“DIN”) balance for different indices can be measured to test assumptions about implied default rate correlations between tranches.
- The DIN series can be used as a macro factor proxy in the z-factor approach, used to forecast detailed transition matrix changes and future credit distributions.
Wider Usage of Credit Consensus Ratings in SRT Transactions
The top-down approach based on credit indices is especially useful for analysing undisclosed portfolios. Where individual obligor data is at least partly available, it can be mapped to the granular Credit Consensus Ratings (CCR) dataset to provide detailed analysis of disclosed portfolio transactions.
CCRs for single borrowers give investors an unbiased view of the inbound portfolio, and can be extended to monitoring of the collected portfolio. In particular, investors can compare the credit distribution (see below) of current and proposed portfolios, in their own credit scales as well as the classic 21-category format for comparison with external quotes. The chart below shows a detailed comparison based on individual CCRs. (Red dotted lines show differences of more than one notch).
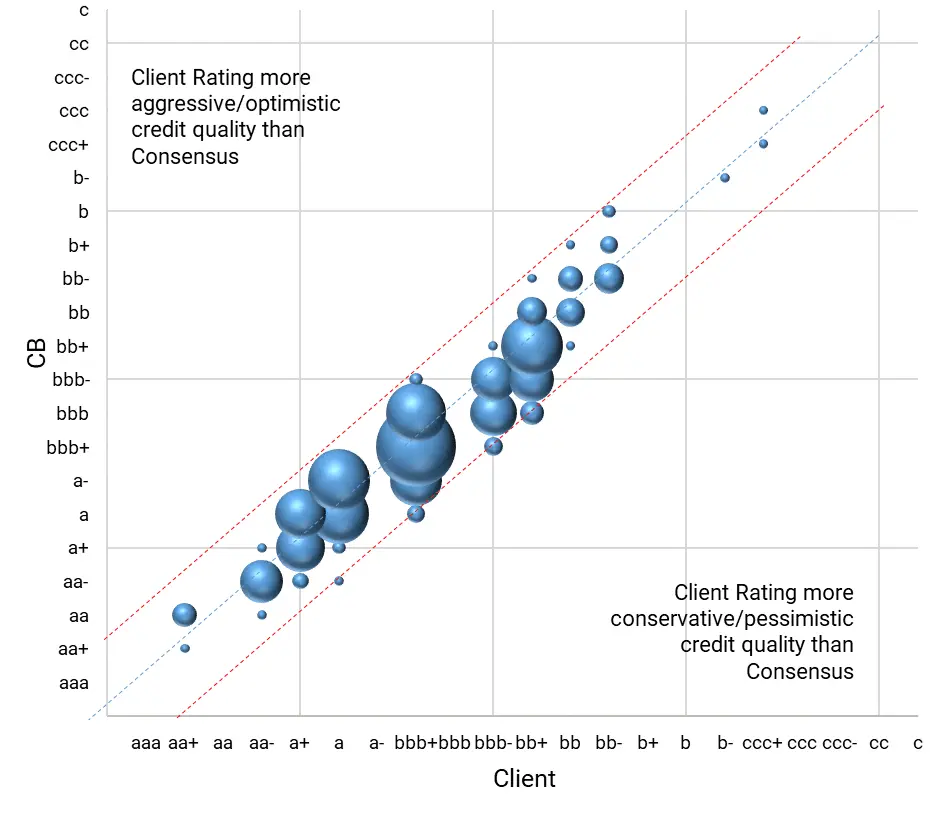
Banks can leverage similar analysis based on detailed CCRs, but without the need to divulge individual entity ratings. Comparative credit distribution comparisons allow them to demonstrate the efficacy of their underwriting standards.
For undisclosed transactions, banks can demonstrate how internal pool ratings compare with the market, again without divulging either entity specific detail or ratings linked to specific entities, providing a clear and tangible quantification of the efficacy of bank underwriting standards.
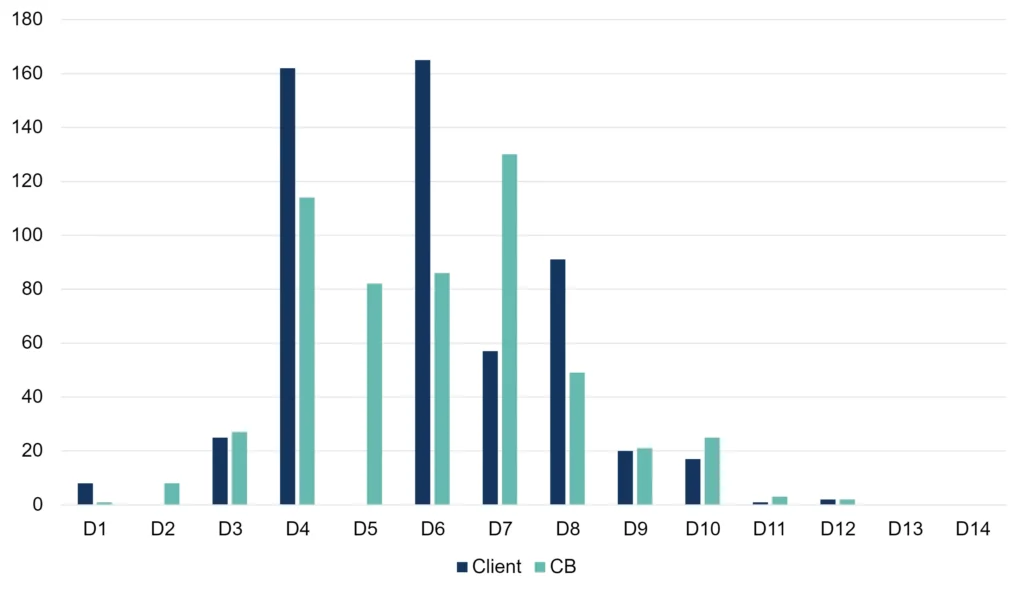
Like for like comparison: whole portfolio
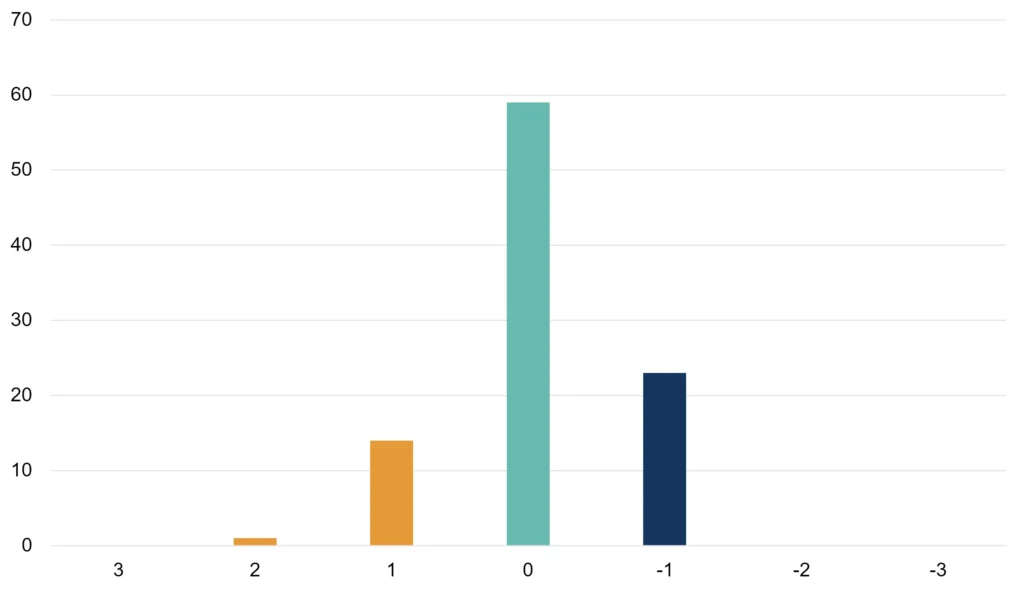
Notch differences: High Yield portion
The rich consensus dataset also supports ongoing portfolio monitoring, servicing and substitutions. Detailed CCRs allow investors to assess marginal changes to risk through additional transactions. For banks who provide ongoing portfolio / trade reporting, consensus data is an independent and regularly updated reference point covering the portfolio lifecycle from trade inception onwards.
For a free portfolio risk report, and to learn more about how consensus default risk data is now being used every day in SRT transactions, contact us at info@creditbenchmark.com.
Download
Please complete your details to download the PDF of this report:
[1] These are based on the 12-month rolling cumulative Deterioration-Improvement Net (12mDIN) balance, which records all default probability changes across every credit category. Some of these will filter through to transition matrices.
[2] The Default Rate Index is the weighted sum of the long run S&P observed global default rates for each credit category. The weights are the monthly credit distributions for each sector. This index is an estimate of the observed default rate that would have been observed in each sector if the default rates by credit category had been aligned with the long run (40+ years) default rates observed and reported by S&P.