
Some Sectors Resilient Despite Higher Rates
Introduction
Key Findings
- Global Corporates vs. Global Financials vs. Global Sovereigns: Corporates Tick Up
- Industry and Sector Turning Points: Positives Outnumber Negatives
- US Sector PD Comparisons: Leisure Goods Shows Largest Monthly Drop
- Credit Volatility: Equity VIX Up, Credit Volatility Plateauing
- Leveraged Loans: Gap Between Index Value and Credit Downturn Continues to Widen
- Artificial Intelligence: Computer Services An Overlooked Beneficiary
- Climate Change, Record Temperatures & Wildfires: Negative Impact on Insurance Spreading
- US Corporate Default Rate Projections: Central Case 4% By Mid 2024, Small Risk of 7% Or More.
The global economy is still giving mixed signals. US growth is strong, reflected in a tech-driven stock market boom. But China is grappling with increasing real estate problems that now threaten its banking sector and could hit its Asian neighbours. UK growth is holding up and recent data revisions have been positive, but the EU remains sluggish, while Russia has devalued the rouble. The Middle East and India look more robust. However, most Central Banks have been quick to pour cold water on any imminent rate-cut hopes, citing stubborn inflation.
Some of the gloomier forecasts from early 2023 have been abandoned, and many sectors are seeing credit improvements, But Moody’s and S&P have downgraded a range of second tier and trust banks in the US, partly reflecting looming problems with real estate loans – a growing issue for many economies.
Climate change continues to wreak havoc. Some of the largest wildfires ever recorded are still burning in Southern European scrubland and North American forests. Heavy rain and high winds, exacerbated by El Niño, have caused widespread damage in mountainous and coastal regions globally. Freak weather incidents have disrupted various cities around the world. This is likely to hit food prices, insurance companies, and travel firms.
These trends are reflected in the latest credit consensus data. In this month’s report, we cover the usual macro features and sector trends, but also put the spotlight on AI, Climate change, and US Corporate default rate forecasts.
Global Corporates vs. Global Financials vs. Global Sovereigns
Corporates Tick Up
The following charts show global trends for average PDs and % balances between improving and deteriorating companies, for the past 12 months.
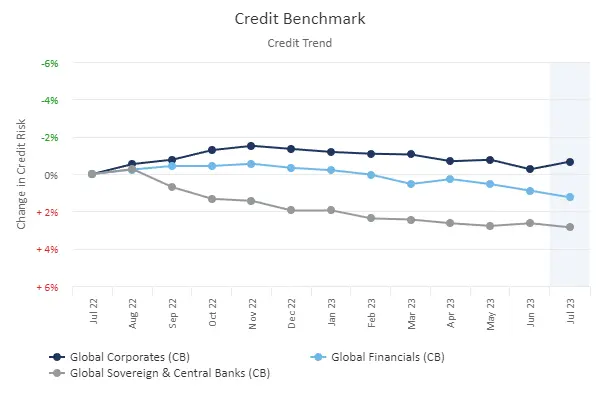
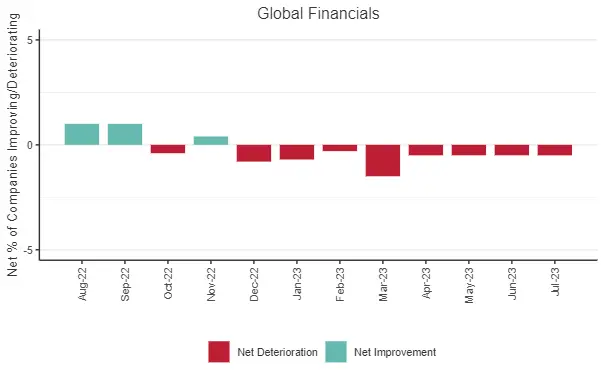

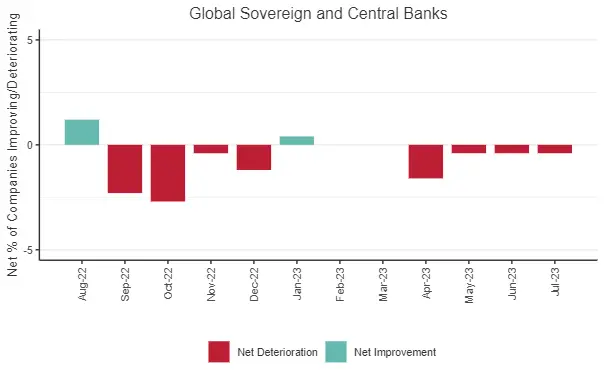
Global Corporates have now ticked up for the second time in 8 months. Financials and Sovereigns continue to show negative credit trends; for Financials this is the eighth consecutive negative month.
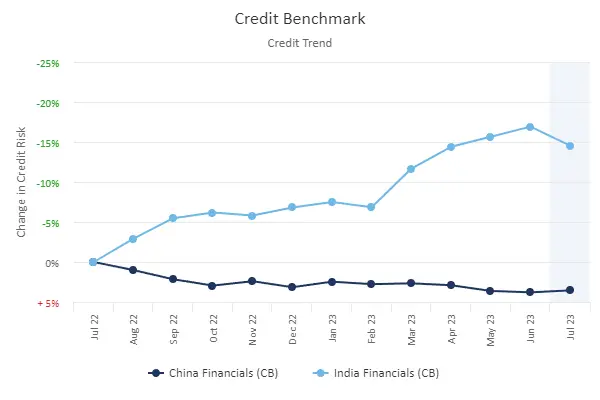
China’s property woes are likely to have an impact on its banking sector and beyond; the chart below shows the striking divergence between Financial Industry credit risks in China vs. India over the past year. (Although it is worth noting the sharp deterioration in India this month).
Industry and Sector Turning Points
Positives Outnumber Negatives
The lists below shows detailed global industries and sectors that may be at turning points. These have either started to show negative balances after a run of positives, or vice versa.
Positive Turning Point: Previous 3M Negative, Current 1M Improving
- Global Basic Materials
- Global Commodity Chemicals
- Global Industrial Metals and Mining
- Global Iron and Steel
- Global Construction and Materials
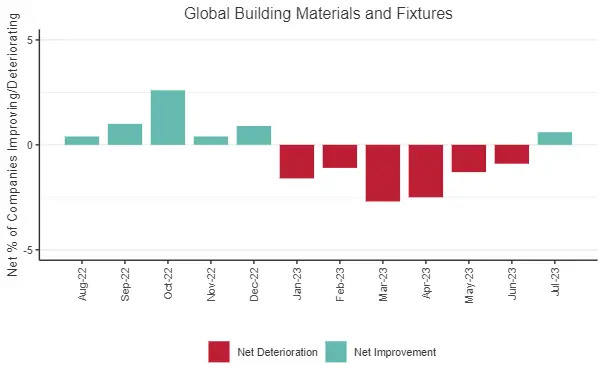
- Global Building Materials and Fixtures
- Global Industrial Engineering
- Global Software and Computer Services
- Global Computer Services
- Global Software
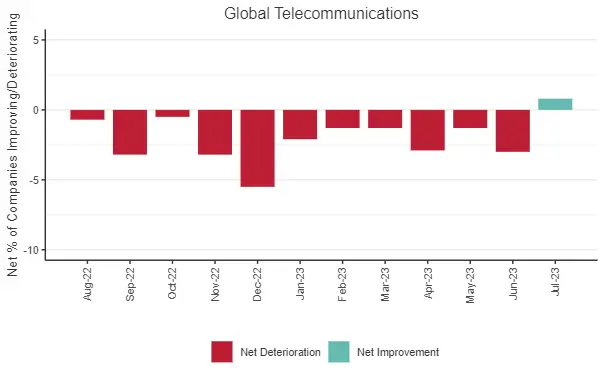
- Global Telecommunications
- Global Fixed Line Telecommunications
- Africa Corporates
- Africa Construction and Materials
- South Africa Corporates
- Asia Construction and Materials
- Hong Kong Corporates
- Hong Kong Industrials
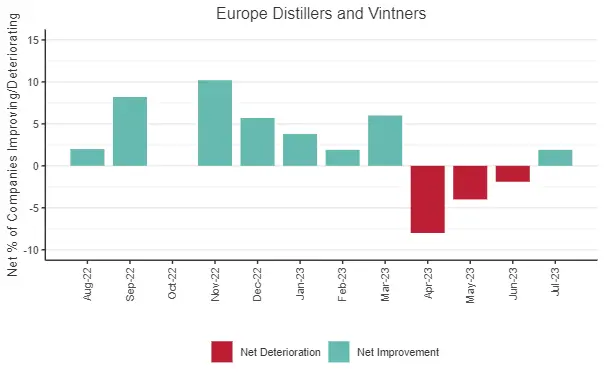
- Europe Distillers and Vintners
- Europe Farming, Fishing and Plantations
- Europe Durable Household Products
- EU Banks
- United Kingdom Commodity Chemicals
- United Kingdom Consumer Goods
- United Kingdom Food Producers
- United Kingdom Farming, Fishing and Plantations
- United Kingdom Industrial Machinery
- United Kingdom Software and Computer Services
- United Kingdom Computer Services
- North America Broadline Retailers
- North America Building Materials and Fixtures
- North America Industrial Engineering
- North America Technology
- North America Computer Services
- North America Real Estate Investment and Services
- North America Real Estate Holding and Development
- Canada Corporates
- Canada Consumer Goods
- Canada Consumer Services
- United States Top 500 (Consumer Goods)
- United States Technology
- United States Real Estate Investment and Services
- United States Real Estate Services
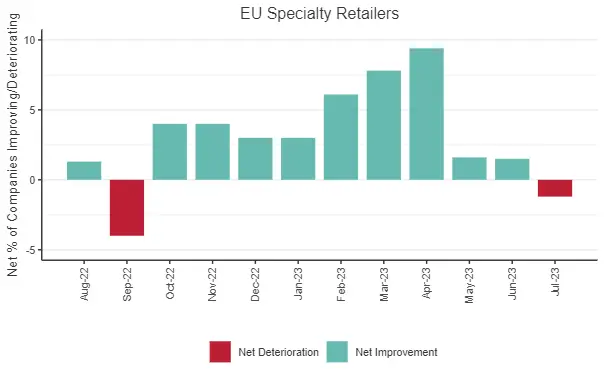
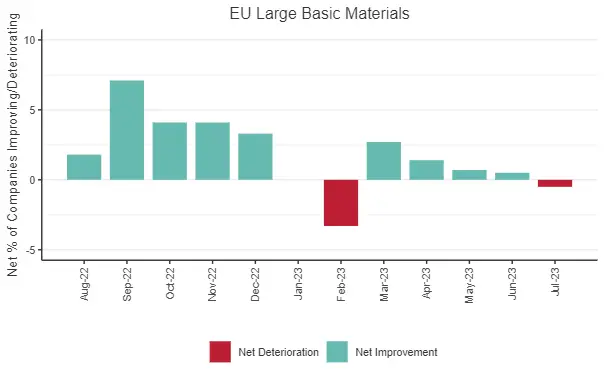
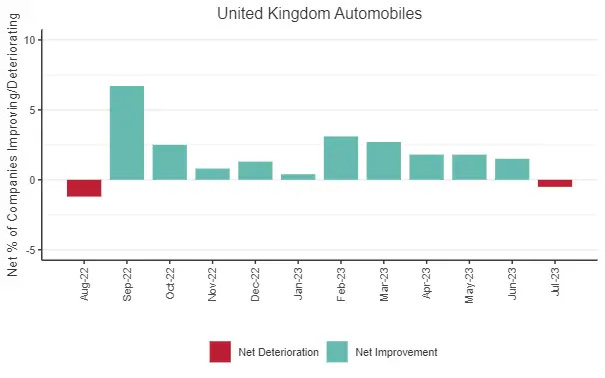
Negative Turning Point: Previous 3M Improving, Current 1M Negative
- EU Large Basic Materials
- EU Specialty Chemicals
- Europe Specialty Chemicals
- EU Consumer Goods
- EU Large Consumer Goods
- Europe Automobiles
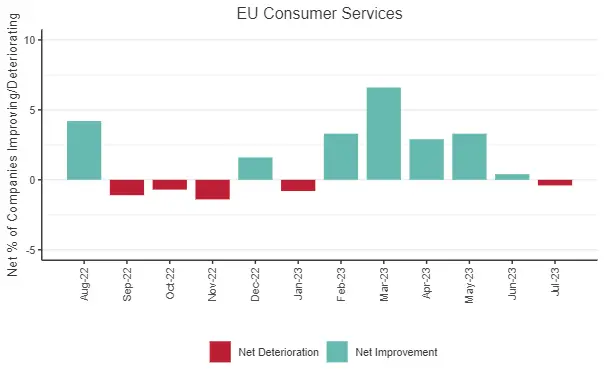
- EU Consumer Services
- EU Specialty Retailers
- Europe Consumer Finance
- Europe Property and Casualty Insurance
- United Kingdom Automobiles and Parts
- United Kingdom Automobiles
- United Kingdom Travel and Leisure
- United Kingdom Hotels
- United Kingdom Consumer Finance
- United Kingdom Specialty Finance
- United Kingdom Nonlife Insurance
- United Kingdom Property and Casualty Insurance
- Middle East Banks
- North America Industrial Transportation
These trend shifts are spread across diverse sectors and this month there are twice as many positive turning points than negative turning points.
Computer Services still features heavily in the positive turning point column (left), across North America, UK and Globally. Industrial sectors also regularly appear in the positive turning point column.
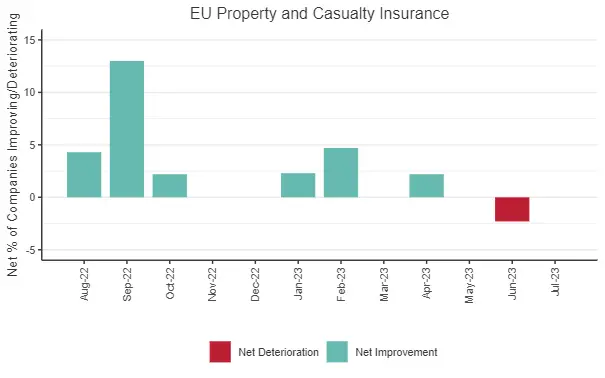
EU and UK feature heavily in the negative turning point column (right). Property and Casualty Insurance across UK and Europe is also in the negative column, possibly partly due to the growing impact of climate change related claims.
The charts below show highlights from the Industry and Sector Turning Points in the previous table – these are based on the % of improving vs. deteriorating credit estimates across each sector universe.
Positive Turning Point

Negative Turning Point
US Sector PD Comparisons
Leisure Goods Is Largest Monthly Drop
With economies and markets giving mixed signals, there is a lot of uncertainty about 2023 default rates. The table below compares average consensus default probabilities for a range of US sectors.
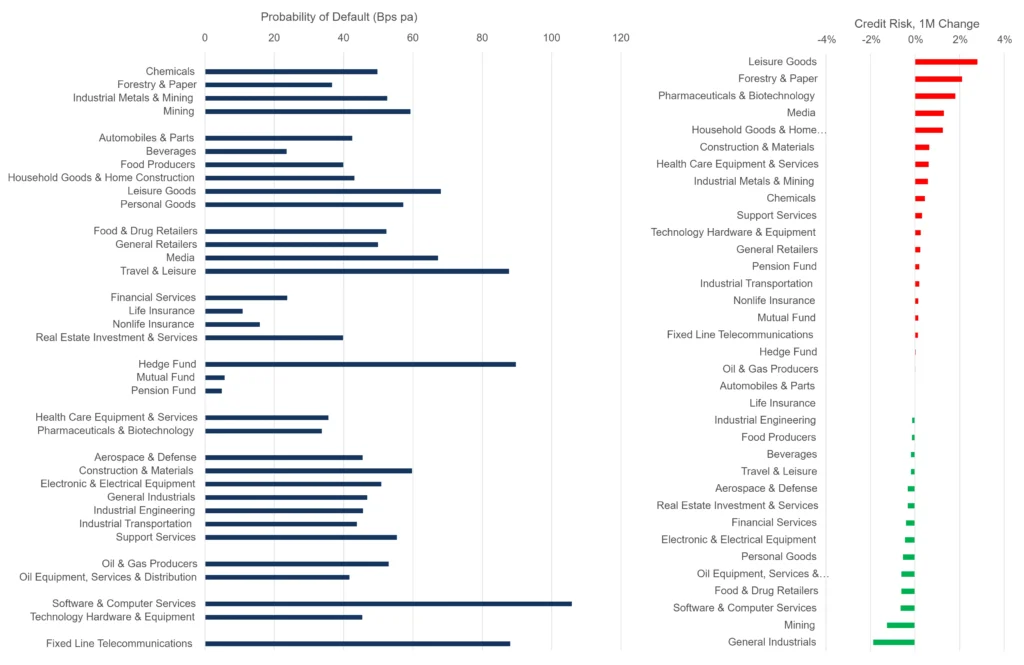
Insurance and Funds – apart from Hedge Funds – are very low risk. Travel & Leisure, Hedge Funds, Software, and Fixed Line Telecomms are highest in the 80 -120 Bps range. The mid-range includes Leisure Goods and Media.
Large sector increases this month include Leisure Goods, Forestry & Paper and Pharmaceuticals & Biotechnology. Improvements include General Industrials and Mining.
Credit Volatility
Equity VIX Up, Credit Volatility Plateauing
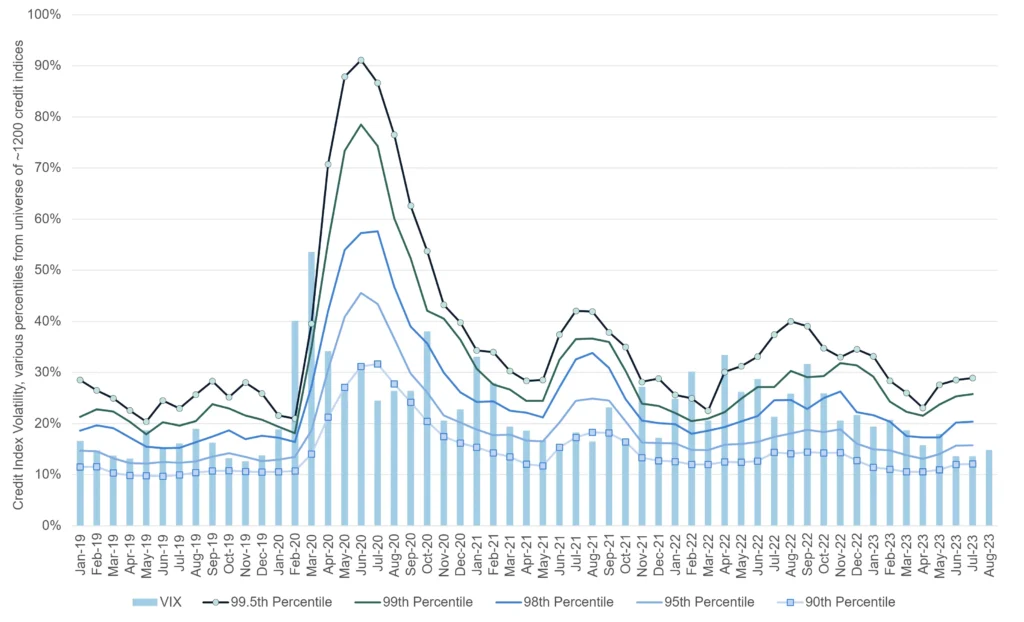
The chart below shows percentiles for credit index 6-month rolling volatility. For approximately 1,200 indices, rolling volatility shows the speed and scale of PD changes; these can give advance warning of changes in transition rates. The percentiles plotted here are the most sensitive to turning points in PD volatility.

Across the CB index universe, all percentiles are plateauing this month. However, the Equity VIX is starting to creep up once again.
The next chart is based on cross sectional volatility (“dispersion”) i.e., the average range of estimates for single name estimates. (A high value implies widespread uncertainty about individual firm credit ratings, probably around a key turning point; a low value implies a tight consensus and probably indicates that current trends will continue.)
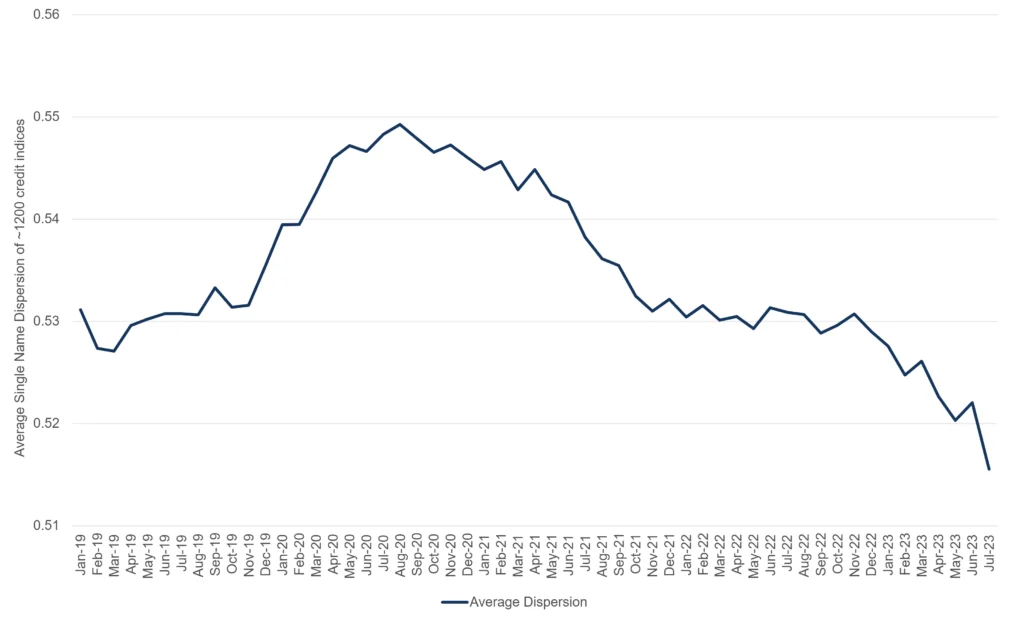
This shows a trend decline[1] since the start of the pandemic; latest data shows a strong down-tick. If dispersion continues to fall it will indicate growing consensus around credit risk opinions.
[1] The actual plotted range is small (about 4% of the average value). Changes in dispersion are more marked at the single name level – for example, when a legal entity is downgraded, the range of PD estimates usually increases.
Leveraged Loans
Gap Between Index Value and Credit Downturn Continues to Widen
The FDIC have highlighted the risks that Leveraged Lending poses for the banking sector in their 2023 Risk Review. They report that default rates are rising, although they are not expected to reach previous market stress peak levels. (For consensus-based Leveraged Loan default rate projections, see our recent white paper).
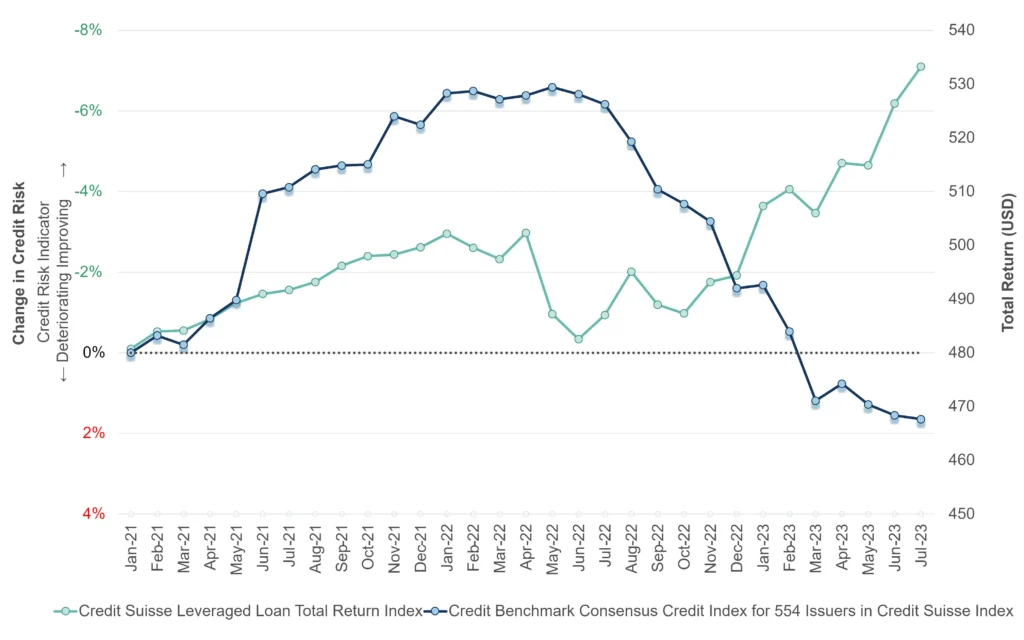
The chart below plots the credit trend of the Credit Benchmark Leveraged Loan Index, made up of 554 issuers in the Credit Suisse Leveraged Loan Index.
The credit index tracked the Credit Suisse Leveraged Loan Total Return in 2021 to early 2022. However, credit has deteriorated by nearly 8% in the past year while total return is up approximately 9% – the gap between investment performance and credit continues to grow.
Artificial Intelligence
Computer Services An Overlooked Beneficiary
The Artificial Intelligence (AI) gold rush is driving mini-bull markets in silicon chips and relevant stock prices, but some recent large deals (many led by Microsoft) are aimed at the apparently mundane area of cloud infrastructure and server capacity, which are likely to be a key foundation for AI success. With exponential growth in real world applications from healthcare to industrial decarbonisation, AI is now driving credit improvements in a growing list of tech sub-sectors.
The following charts show the net balance between improving and deteriorating companies in the Computer Services sector across various geographies.
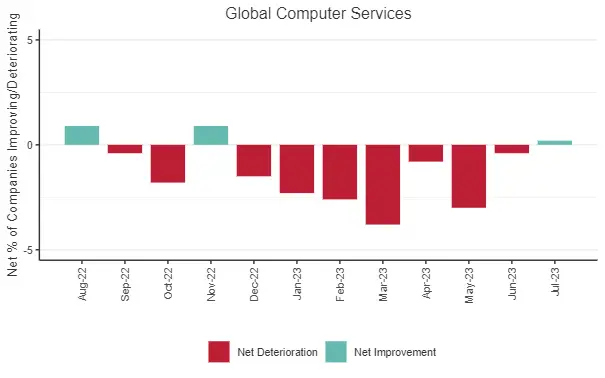
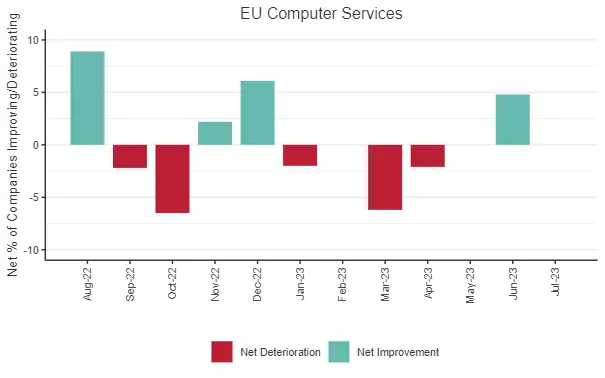
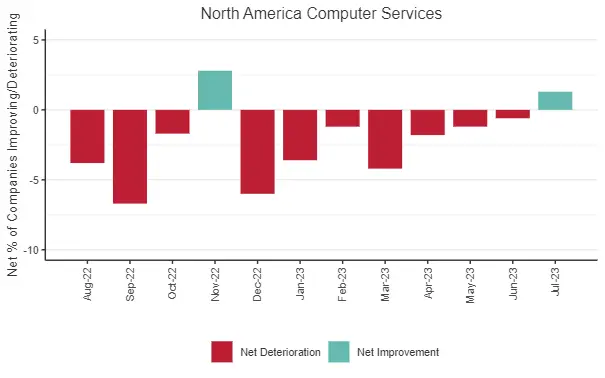
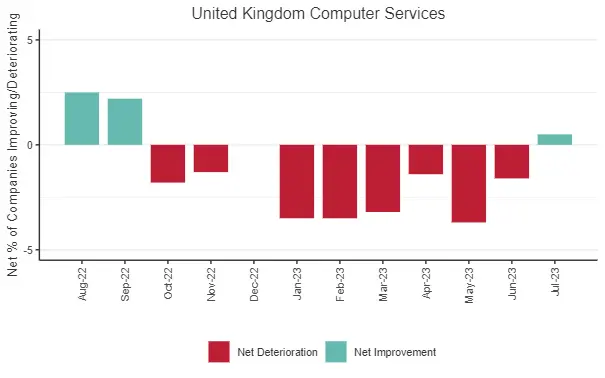
The strong negative trend in Global Computer Services reached a low in Q1 this year; negatives have continued until this month, with a very slight positive. The EU is the largest contributor to this.
Climate Change, Record Temperatures and Wildfires
Insurance Sector Sees More Negatives
Temperature records and wildfires rage on in Europe and around the Globe. The insurance industry faces a lengthening list of claims as homes and businesses are devastated. Insurance rates are rising as capacity drops – partly due to rising interest rates – but the eventual scale of climate-linked losses remains unknown. It is also not yet clear where the losses will eventually be absorbed – non-life insurers, reinsurers, policyholders or governments?
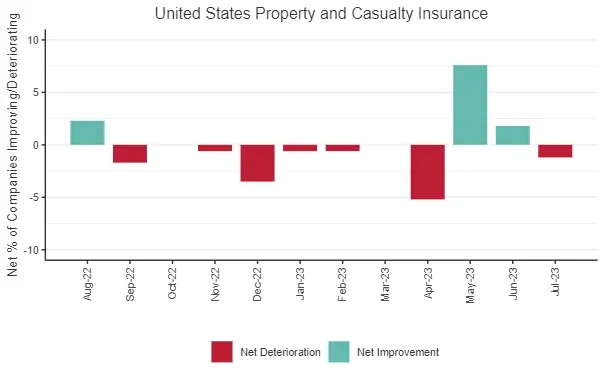
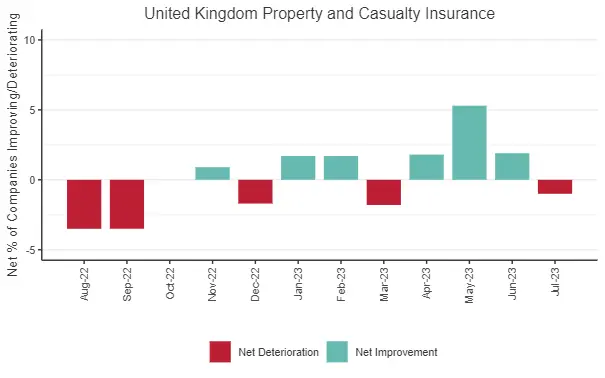
The following chart shows 1Y credit trends for Property and Casualty Insurance sector in US, Europe, Bermuda (a major Reinsurance centre) as well as the wider Global Financials index.
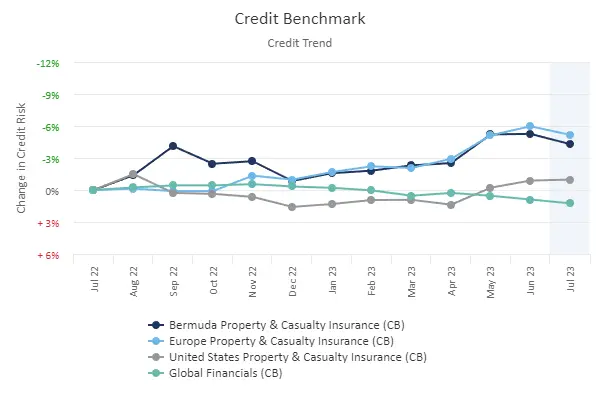
The charts below show the net balance between improving and deteriorating Property & Casualty Insurance companies within for Canada, US, EU and UK. These all show recent deterioration, suggesting further negative credit movements in coming months.

US Corporate Default Rate Projections
Central Case 4% By Mid 2024, Small Risk of 7% Or More.
The recent Moody’s and S&P downgrades of US Banks have highlighted the spreading impact of higher interest rates. Banks that relied on very low cost financing are now having to compete for deposits; higher funding rates are likely to hit loan volumes with knock-on effects to the wider economy.
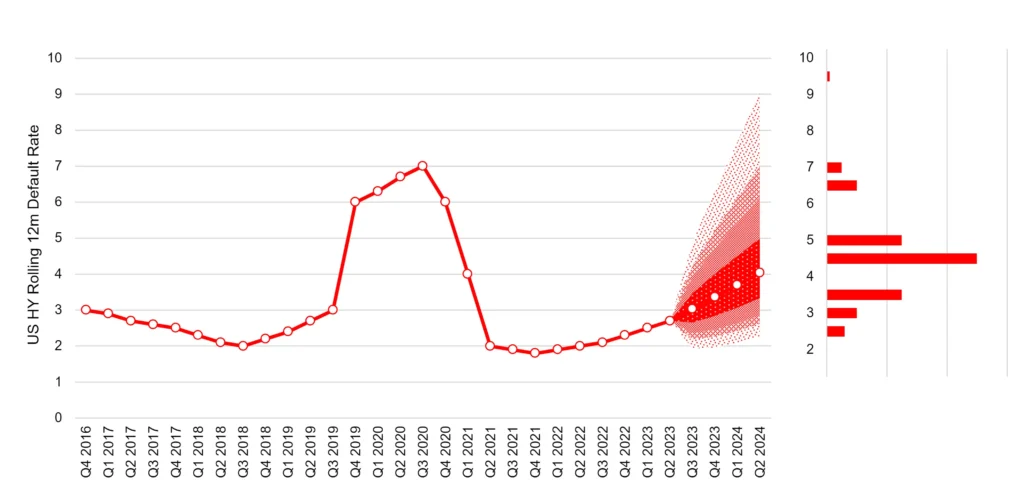
As a result, default rates are trending up and likely to rise further over the next 12 months. S&P reported a provisional June 2023 default rate for US speculative grade (“High Yield”) corporate bonds of 3.24% (a significant increase from the March rate of 2.5%) and are currently projecting 4.25% by mid 2024. Their pessimistic scenario could see default rates hit 6.25%.
As the chart below shows, consensus data implies a broadly equivalent rate in the range of 3.3% to 5%, with a median of 4%. But simulations based on the relationship between S&P default data and bank-sourced consensus estimates suggest a significant chance of the rate reaching 7% or more by Q2 2024.
The key consensus metric is the Deterioration/Improvement Ratio (“DIR”) – similar to S&P’s Downgrade/Upgrade ratio but based on a wider universe that included unrated borrowers, and updated every two weeks. As the chart below shows, both series are strongly correlated with observed default rates.
The recent white paper on this topic (which includes detailed analysis of S&P annual default data) is available on our website.
Conclusion
Stubborn inflation expectations and higher interest rates are the main issue. Some rate hikes have only started to work their way through the system, and the effects are being seen in tightening corporate credit, lower mortgage approvals, competition for deposits and higher food prices. Defaults are likely to rise as a result.
Real estate problems are spreading: troubles in China (and some high profile bankruptcies) mirror the stress in US Commercial Real Estate reported earlier this quarter. House prices are dropping, and associated securitisations are expected to show some stress.
But some economies are proving to be much more robust than expected at the start of 2023. Sectors showing a turn towards positive credit now hugely outnumber those turning negative (after some steep declines in H1), and credit volatility has stabilised despite an uptick in the Equity VIX. The AI boom is driving credit improvements in some unexpected corners of the tech industry.
Even the growth impact of widespread extreme weather events is less than many would have expected. The impact will be felt in Travel/Leisure and Insurance – it is not yet clear who will carry most of the cost but insurance credit risks look likely to rise.
So, 2023 is turning out to be better than many expected, but specific sectors are likely to see more problems before they stabilise and the world economy does not yet have a clear path out of the inflation / interest rate squeeze.
Download
Please complete your details to download the full Monthly Credit Outlook :