Executive Summary
Key Findings
- Default rates for US Speculative Grade bonds and Leveraged Loans are rising, expected to peak in Q2 2024.
- Credit Consensus estimates are based on twice monthly DIR (Deterioration/Improvement Ratio) covering thousands of issuers across a wide range of sectors.
- Credit Consensus data implies 12-month rolling Q2 2024 median default rates of 4% for Speculative Grade, and 2.5% for Leveraged Loans.
- 25% chance of 5% or more for Speculative Grade, 3.2% or more for Leveraged Loans.
- 10% chance of 6%+ for Speculative Grade, 3.5% for Leveraged Loans.
- Worst-case (similar to 2008/9) highly unlikely but would mean 9% for Speculative Grade and 5%+ for Leveraged Loans.
The recent Moody’s downgrades and review announcements for 16 US banks have come as a wake-up call to investors. The downgrades included a number of Trust banks, usually one of the lower risk segments in the financial sector. The issue is higher interest rates: Trust banks have been heavily dependent on low-cost finance, and depositors are now becoming much more active in moving cash balances. It highlights a broader issue – competition for funding is rising rapidly.
As a result, credit default rates are trending up, and likely to rise further over the next 12 months. S&P report a provisional June 2023 default rate for US speculative grade (“High Yield”) corporate bonds of 3.24% (up a hefty 74Bps from 2.5% in March), and this is currently projected to hit 4.25% by Q2 2024. They also project a pessimistic scenario where defaults hit 6.25%, and an optimistic scenario where they drop back to 1.75%. The June increase is above the recent trend, so it is possible that all the S&P 2024 projections – optimistic, median and pessimistic – may be revised upwards in the second half of this year.
Credit Consensus Ratings[1] imply a broadly equivalent mid-2024 default rate in the range of 3.3% to 5.0%. The median projection is 4.0%, but the default rate could plausibly reach 7% or more. For Leveraged Loans, the median forecast for mid-2024 is 2.4%, with an interquartile range of 2.1% to 3.2%; but there is a small chance that they exceed 5%.
These estimates are derived from the Deterioration/Improvement Ratio (“DIR”) – a metric based on monthly credit risk estimates from banks covering thousands of issuers across a wide range of sectors. This metric is very similar to the S&P Downgrade/Upgrade Ratio (“DUR”). This and other S&P metrics are described in detail in the final section, which shows that every peak in default rates has its own unique characteristics, but that the overall DUR is closely correlated with aggregate default rates.
However, the consensus-based DIR is more granular than the DUR because it captures deteriorations in credit quality that may precede a full notch downgrade, and it is based on a larger borrower universe.
US Speculative Grade (“High Yield”) Corporate Bond Default Rates
The chart below shows the DIR range for more than 100 US credit indices since 2017, along with the 12-month rolling S&P US Speculative Grade Corporate Bond default rate.
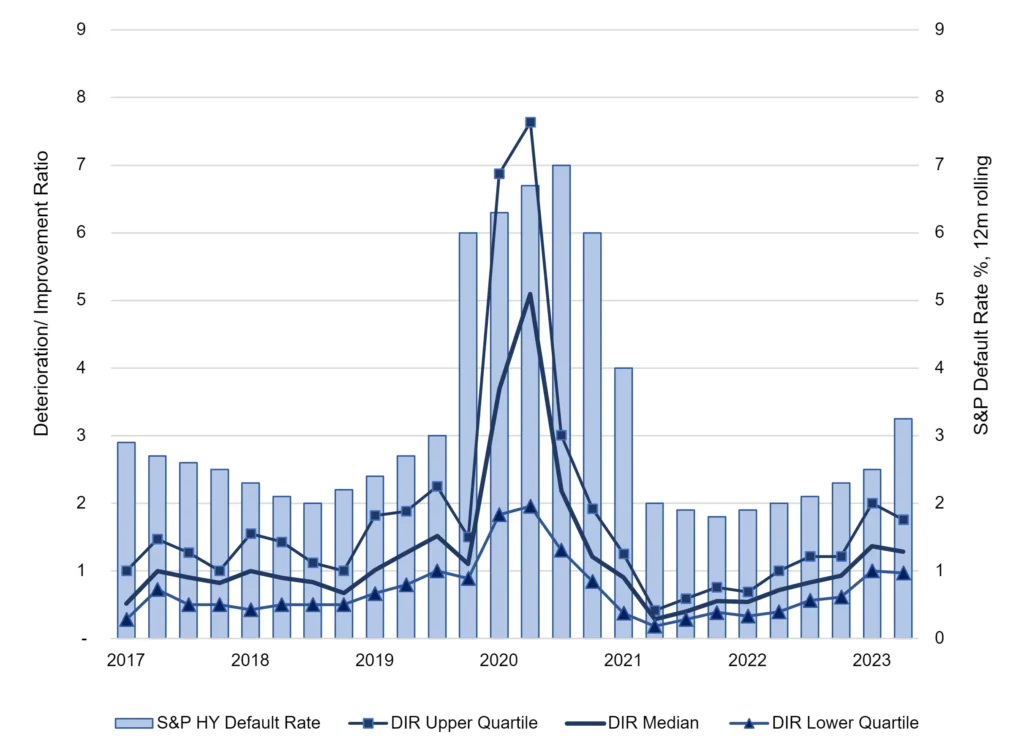
Sources: Credit Benchmark, Standard & Poor’s Inc[2].
This shows that the median DIR is close to 1, (i.e., deteriorations and improvements are in balance). The upper quartile has reached 2 at some points in the credit cycle – i.e., deteriorations outnumber improvements in the ratio of 2:1. The ratio was close to 8 during the Covid crisis.
The next chart shows a related metric, the proportion of credit consensus indices with a DIR greater than 1. This measure has a range of 0% (all DIRs below 1) to 100% (all DIRs above 1, i.e., all show a balance to deterioration). It is plotted for all sector indices globally as well as for US indices specifically.
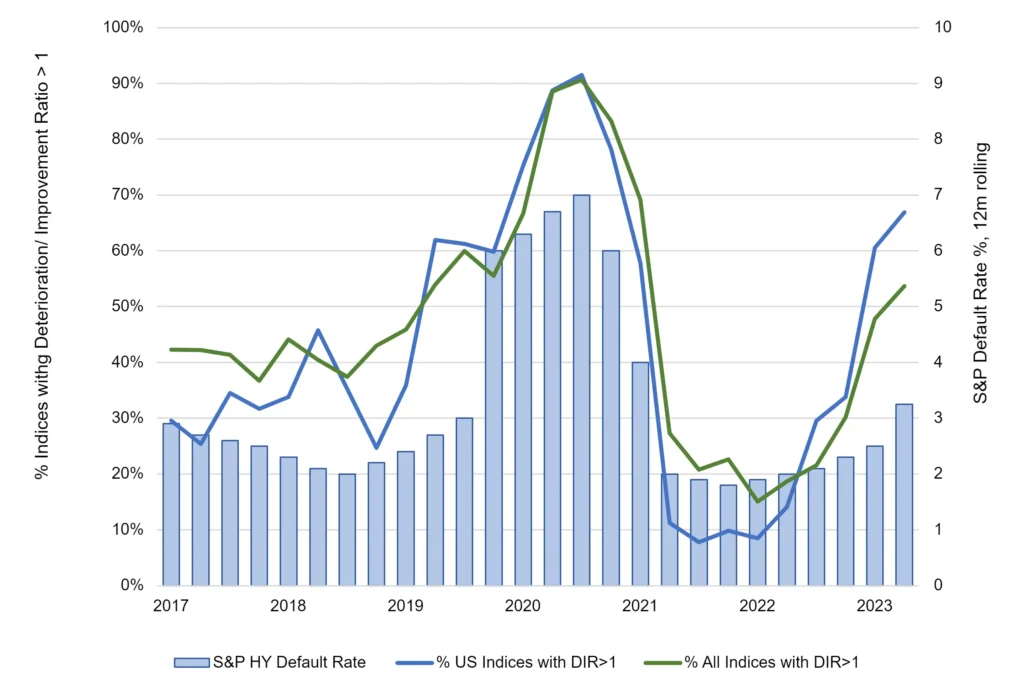
Sources: Credit Benchmark, Standard & Poor’s Inc
The chart shows that this metric currently stands at slightly over 50% for global indices and nearly 70% for US indices. Both measures have been climbing steeply in recent quarters, and the sharp Q2 increase in defaults provisionally reported by S&P is consistent with this.
As both charts show, DIR metrics are highly correlated with the S&P default rate – although the various series diverge in some quarters[3]. Combining the “signal” (the DIR / S&P correlation) with the “noise” (the divergences) it is possible to extrapolate the likely path of US Speculative Grade / High Yield (“HY”) default rates, as well as the best case and worst-case probabilities.
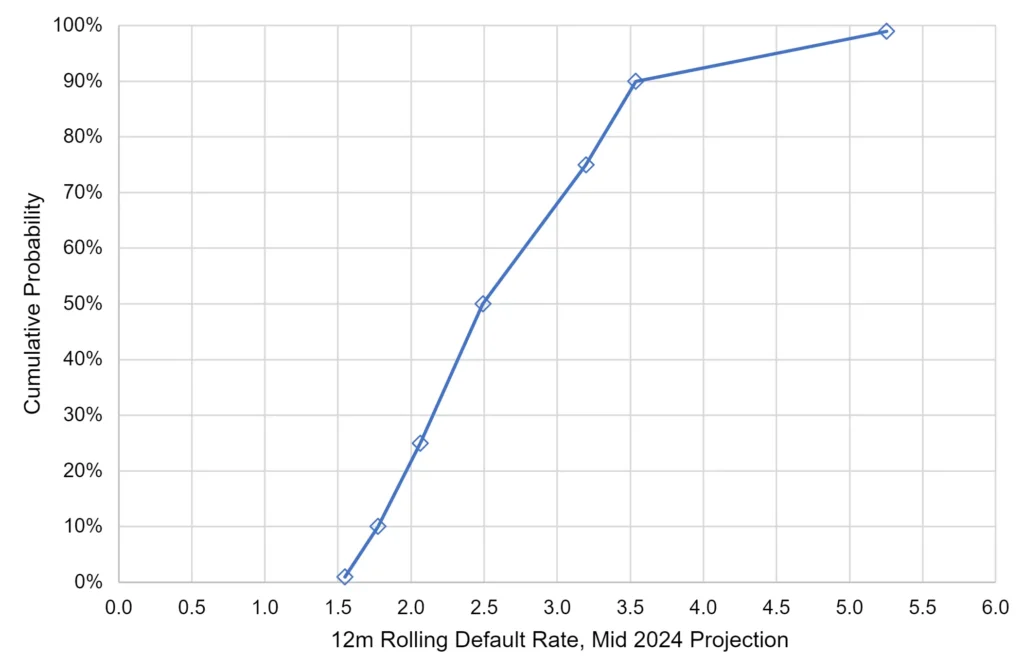
The next chart plots the likely (smoothed) trend and optimistic/pessimistic distribution for the US HY default rate. The numbers to the right of the bars are the corresponding percentiles for each simulated default rate.
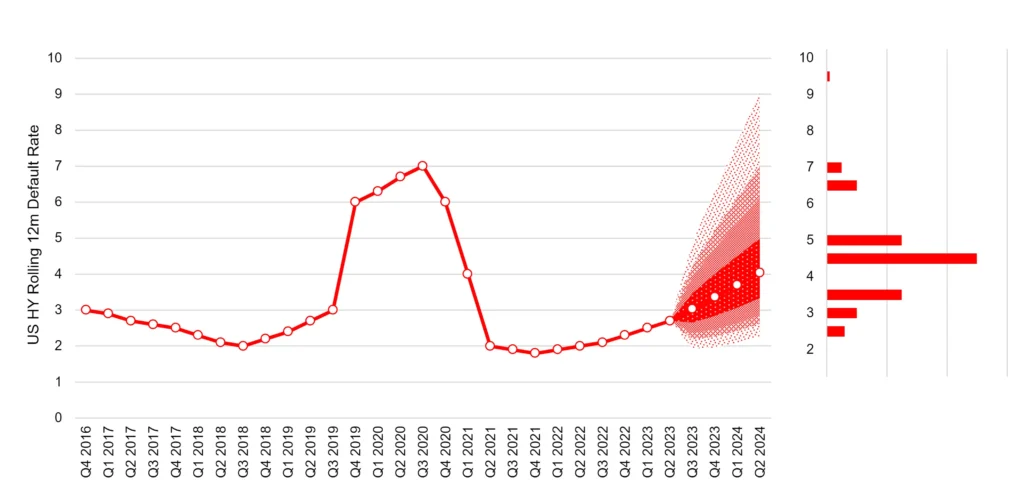
Source: Credit Benchmark
Current trends in consensus DIR metrics imply that the default rate is likely to climb to 4% but there is a significant chance (25%) that it exceeds the S&P projections of 4.25% and a 10% chance of exceeding 6%. There is a 5% chance of it reaching the 7% – 9% range, and a 1% chance of hitting 9% or more.
There is also a 25% chance that the default rate is better than the central projection, peaking at 3.3%; with a 10% chance of stabilizing at 2.9% by mid-2024. There is a less than 1% chance that it will drop below 2%.
These projections suggest that the default rate is most likely to be slightly lower (4%) than the S&P forecast of 4.25%; but there is a 1 in 4 chance of at least matching the S&P projection, and a 10% chance of exceeding it. Based on the current behavior of credit consensus estimates, there is very little chance of the S&P optimistic scenario where default rates dip below 2% by 2024.
However, default rates are notoriously difficult to predict because even in downturns defaults are sparse, and usually sector- or segment- specific. Since credit consensus data includes large numbers of unrated issuers, it reflects the state of the wider economy, including the credit dynamics of some of the larger SMEs. So, projections from this dataset run the risk that they overstate the worst-case default rate for the S&P rated universe but may give an accurate picture of the wider economy default rate.
Leveraged Loans
According to LCD, the 10-year default rate average for US Leveraged Loans is 1.57%. The latest 12m rolling average is 1.86%, a steep increase from 1.58% in May and 1.31% in April.
S&P expect the rate to hit 2.5% in March 2024. (It is worth noting that these are 12-month trailing numbers – some reports use annualized 3-month estimates which results in a much more volatile series with some very high peaks.)
The relationship between credit consensus metrics and US Leveraged Loan default rates is similar to the S&P speculative default rate discussed previously. The projections reported in this section are based on a subset of 540 Leveraged Loan issuers (rather than loans) that are all constituents of the Credit Suisse Leveraged Loan Index.
However, as the chart below shows, the projected outcomes are much narrower.
Source: Credit Benchmark
The median projected default rate for leveraged issuers is 2.5%, with an interquartile range of 2.1% to 3.2%. There is a 10% chance of 3.5% or more – close to double the long run average. There is also a very low probability – but high impact – worst case of 5.3% – more than triple the long run average.
Background: High Yield / Speculative Grade Bond Default Rate Patterns in Historic S&P Data
With higher interest rates and stubborn core inflation, all major rating agencies are forecasting higher default rates by the end of 2023 and into 2024. Multiple research papers by major agencies show that – in large samples – credit ratings are a good predictor of future default rates.
The chart below uses the S&P default study to plot the regional breakdown of default waves since 1996.
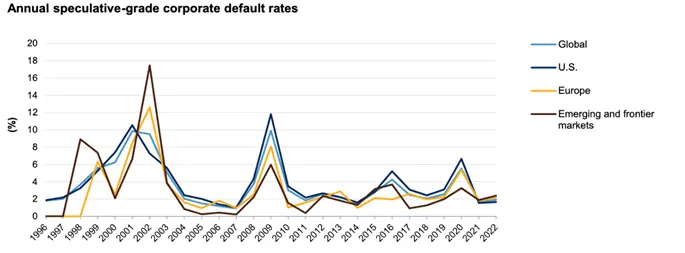
Source: Standard & Poor’s Financial Services LLC.
Default spikes are highly correlated across regions, and the correlation seems to be rising although the peaks are lower in recent waves.
The next chart shows the most recent credit category preceding a default.
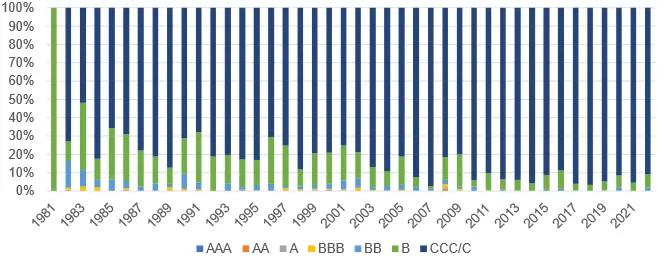
Source: Standard & Poor’s Financial Services LLC.
Reassuringly, most defaults occur in companies that were previously in the C categories, and the proportion has been increasing in recent years.
S&P also report that multiple downgrades precede an actual company default, so it makes sense to use their downgrades / upgrades ratio (“DUR”) to predict default rates. The two series are plotted below.
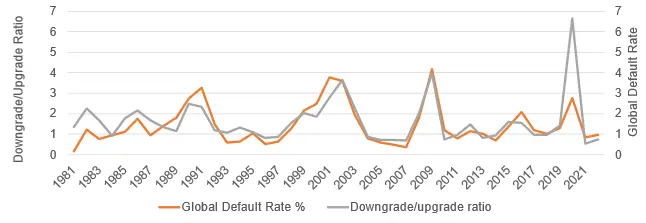
Source: Standard & Poor’s Financial Services LLC.
While actual defaults are rare, they are often clustered during economic downturns, and the next chart shows the sector breakdown of these spikes.
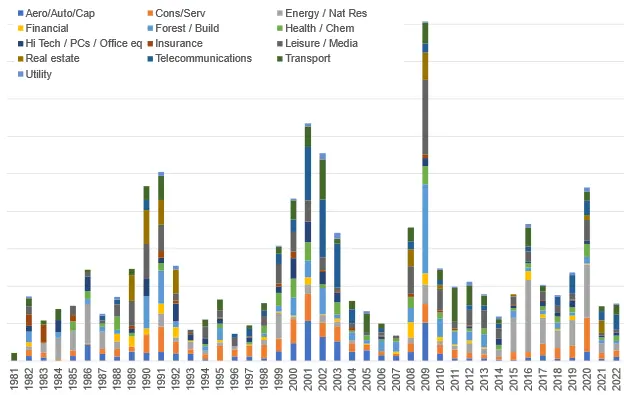
Source: Standard & Poor’s Financial Services LLC.
Some sectors – like Oil & Gas and Real Estate – tend to feature heavily in every default rate cluster. But the detail of each cluster seems to be unique; the spike around 2000 is particularly diverse.
In conclusion: defaults are clustered in time, and these clusters are correlated across regions. Most defaults are in companies in the c-category, but the sector split of each default cluster is less predictable. The downgrade/upgrade ratio is strongly correlated with the default rate; so, any metric which is a leading indicator of the DUR can also be a leading indicator of default rates.
Credit Consensus data is based on issuers, rather than bonds; the equivalent metric – the DIR – is more granular, based on a large universe (with many unrated issuers) and is published every two weeks. It is also correlated with the S&P default rate (although the correlation is slightly lower than for the DUR), but it will be a valuable complementary metric as economies continue to be buffeted by high levels of economic uncertainty.
Download
Please complete your details to download the whitepaper:
[1] Based on internal ratings provided by approx. 40 global banks.
[2] S&P 2022 Default and Transition Study for US Bonds; additional data from S&P quarterly press releases.
[3] The rate of growth of the DIR metrics is likely to slow, since it is very rare for ALL indices to be deteriorating simultaneously.