
Transition matrices (“TMs”), derived from credit data, track the speed of full notch and multi-notch upgrades and downgrades over a set timeframe1. Figure 1 shows the one-year TM for 9,560 US Corporates.
Figure 1: US Corporates, One-year TM
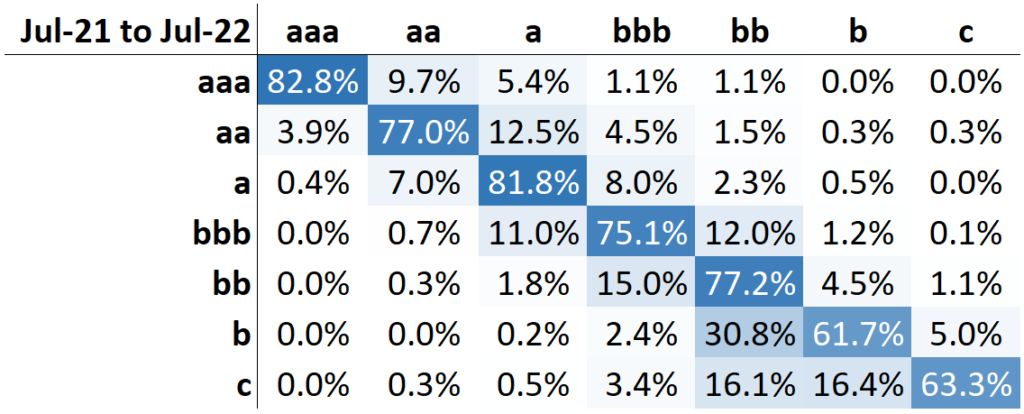
For example, 12.5% of this large sample of US Corporates changed credit rating from aa to a over the past year. The leading diagonal shows the proportion of US Corporates that had no change in credit rating – for example, 75.1% remained in the bbb credit category.
Multi-year matrix benchmarks can be derived from the one-year matrix2. These multi-year “equivalent” matrices can be compared with actual multi-year transition rates to show if upgrades and/or downgrades are speeding up or slowing down.
Figure 2 shows the 3-year equivalent (left) and the 3-year actual (right) for the same sample of US Corporates
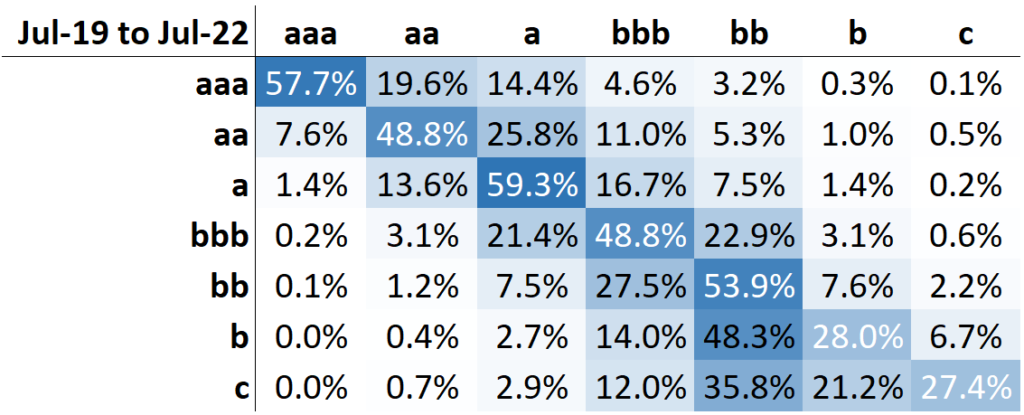
Figure 2: US Corporates, Three-year equivalent, and actual TMs
3Y equivalent = “Adjusted 1Y”
3Y actual
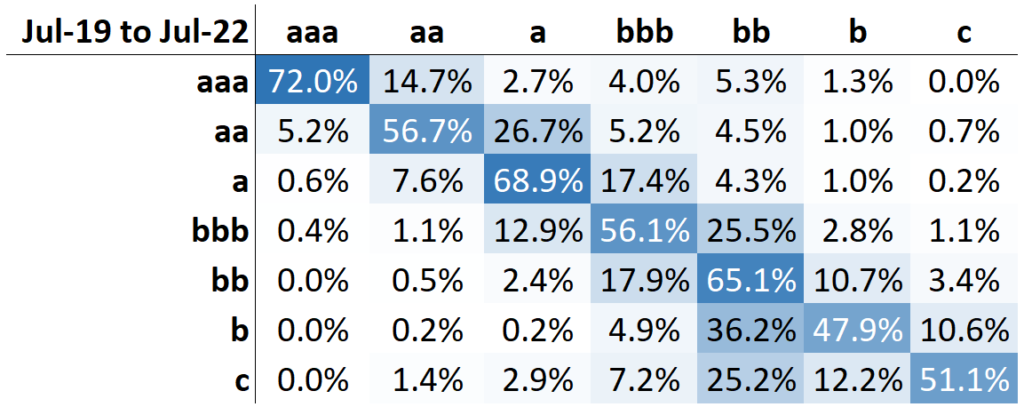
This shows that the frequency of transitions has increased in the past year – the actual three-year transition frequency is lower across all seven credit categories. The leading diagonal for the actual 3Y matrix shows more firms staying in the same credit rating category throughout the period, compared with the recent activity in the adjusted 1Y matrix.
It also shows that higher recent credit mobility appears in both the upper (downgrades) and lower (upgrades) triangles. The 3Y equivalent aaa to a transition rate is 14.4% compared to the actual value of just 2.7%, and the aa to bbb is 11% in the 3Y equivalent compared with 5.2% for the actual.
The lower triangle shows faster upgrades – the recent “Rising Stars” 3Y equivalent rate for bb to bbb transitions is 27.5%, compared with 17.9% for the actual 3Y. And the recent 3Y equivalent proportions of very high risk b and c names moving to investment grade bbb are 14% and 12%, compared with 4.9% and 7.2%
The implication is that bank credit estimates for US Corporates show a rising proportion of one-notch upgrades and some multi-notch upgrades in the lower credit categories. But while one-notch downgrades have continued at a similar rate, multi-notch downgrades within the investment grade categories have picked up. The 3Y equivalent proportion of names with no credit rating change has been lower in the past year than for the past three years. So previously downgraded names are staying in their lower categories, and across the investment grade categories those downgraded firms are being rapidly joined by firms that have seen multi-notch downgrades.
The conclusion is that the post-COVID credit recovery has been strong across most credit categories, but at the same time a significant number of investment grade firms have started to be subject to multi-notch downgrades. This may indicate a structural shift in credit – in the new regime of rising interest rates and supply-side shocks, new winners are emerging, and previously sound firms are showing credit weakness. Any further evidence of more widespread credit deterioration following recent rate hikes will quickly show up in these matrices.
To receive regular updates on credit trends across 1000+ geographic and industry/sector combinations, contact us on [email protected]. Credit Benchmark TM updates are also available upon request for various geographic and industry/sector combinations, and for more detailed credit categories (e.g. 21×21).
[1] A (credit) transition matrix shows frequency counts of revisions to probability of default estimates that are sufficiently large that the credit rating changes by at least one full 7-category notch over a set time period.
[2] To derive the three-year matrix, the one-year matrix is multiplied by itself, and the resulting two-year matrix is post-multiplied by the original one-year to give the three-year matrix.

