
Whitepaper // No.6
September 2016
Sovereign Credit Ratings
›Sovereign credit crises tend to occur in waves and Sovereign credit quality measurement aims to identify the most vulnerable countries.
›Agency ratings do not cover every country, but consensus views crowd-sourced from global IRB banks cover many of the same Sovereigns and extend to a number of unrated Sovereigns.
›Crowd-sourced bank views have a 96% fit with agency ratings, but are more conservative.
›Bank views provide benchmarks for agency ratings, CDS spreads and real bond yields.
›Bank views also support unbiased, monthly evaluated credit benchmarks for unrated Sovereigns.
›Crowd-sourced consensus estimates show lower variance than standard model estimates.
Download the PDF “Measurement Of Sovereign Credit Quality“
So far this year, the main credit rating agencies have been downgrading Sovereigns at the highest rate since 2009.
Credit losses arising from Sovereign debt crises are rare, but when they do occur they may have major consequences, and the amounts involved are usually significant. Such crises may occur in clusters and may spread indirectly to the corporate sector in the affected countries.
Specifically, this paper briefly reviews the history of Sovereign debt crises and introduces crowd-sourced credit estimates as a new metric in the assessment of Sovereign risk. These estimates are compared with opinion-based ratings and are then used to calibrate a framework that extends credit risk estimates to currently unrated Sovereigns.
This paper compares bank-sourced views of Sovereign risk in the form of the Credit Benchmark Consensus (“CBC”) with the opinions of the main credit rating agencies (“CRAs”). It then shows the scope for using economic data to extend credit risk assessments beyond either of those universes.
This report is the first in a series. Subsequent reports will tackle questions about predictive leads and lags between changes in bank views, rating opinions, and economic data.
| Credit Benchmark: Collective Intelligence for Global Finance | |
| Credit Benchmark (CB) has brought together a group of key global banks who anonymously and securely pool their internal credit risk estimates, to create consensus Probabilities of Default (“PD”) and senior unsecured Loss Given Default (“LGD”) metrics. The Credit Benchmark service offers monthly updated consensus PDs and LGDs on thousands of obligors at the individual legal entity level, extending from Sovereigns and banks to public and private corporates and funds. Credit Benchmark also offers data on tens of thousands of obligors for use at portfolio level. Quorate consensus PDs are simple, unweighted averages of at least three independent PD or LGD contributions for an identical legal entity over an equivalent estimation period. Participation in the service is open to any banks that use the IRB method for calculating regulatory capital. Credit Benchmark warmly invites interested institutions to become contributors. |
There are many books and papers on this topic 1 , covering theory and practice, and ranging from econometric models to policy prescriptions. Kindelberger 2 provides a comprehensive and recently updated overview of actual historical credit crises.
Sovereign credit crises are often linked to systemic issues or commodity shocks; but the way in which these play out in individual economies can be very different. Historical crises are often linked to territorial ambitions, especially if they result in outright war. Like ‘cheap’ foreign currency debt, printing money to finance the invasion of a neighbor may seem like an easy way to expand an economy but they usually bring disproportionate costs. Modern Sovereign crises are more likely to be driven by purely economic factors, although the recent deterioration in the credit standing of Russia and Ukraine can be partly linked to their territorial dispute.
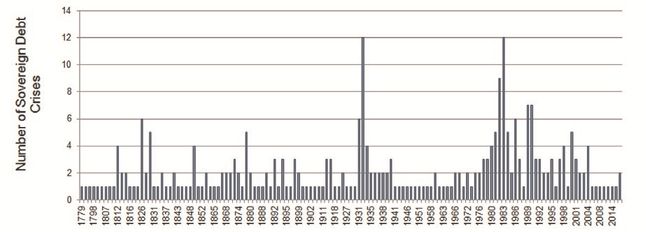
Exhibit 1.1 shows the historical frequency 3 of the main Sovereign debt crises going back more than 200 years, showing clear clusters in time.
The clustering suggests that a regime switching approach is a potential topic for further research 4 .
Sovereign risk differs from pure corporate risk, since a Sovereign rarely defaults in the corporate sense, or the definition of default is unclear. It is much more likely that Sovereign credit crises are resolved through compromises, asset transfers, currency devaluations or write-offs. The willingness as well as the ability to pay becomes critical. Rating agencies reflect this in the category ‘Selective Default’ which they sometimes apply to instruments issued by this obligor group.
The main types of Sovereign crises are discussed in Frenkel, Karmann and Scholtens (2004). A key type of crisis is cause by is flawed macroeconomic policy, (which may exacerbate structural issues specific to each economy). They also highlight moral hazard, where a ‘Government Put’ encourages excessive risk taking. Asset price drops may follow or they may be the cause. Their analysis also identifies financial panics and disorderly workouts, where collective creditor action precipitates a crisis (as each attempts to salvage their investment, even if it results in collapse). Related to these are bubble collapses (where financial assets are mispriced, and some catalyst causes this to correct).
Sovereign credit crises often follow periods of excessive borrowing, especially by ‘soft’ currency countries in ‘hard’ foreign currencies that offer the apparent benefit of low interest rates. Such booms typically end because of an external shock or a drop in lender confidence, leading to currency devaluation and a liquidity crisis; it becomes difficult to meet interest payments or to repay or rollover the principal. The stricken Government may choose to avoid making external payments in order to preserve cash; or they may make selective payments. Some recent examples of selective payments are:
Credit risk measurement differs from credit risk prediction. There is an analogy with the analysis of earthquakes or avalanches – it is possible to identify that there is a heightened risk, but the timing and scale of the actual events are much less certain. And a ‘crisis’ can last for years, with protracted negotiations, swings in economic fortunes, or the discovery of previously hidden liabilities.
This paper will treat the Sovereign 1-year PD as an estimate of the risk of a significant Sovereign debt crisis, rather than an outright default. It will focus on bank views, credit ratings, and economic statistics in the measurement of credit risk. It will ignore the short term asset valuation position, but in practice investors often use technical and liquidity measures – capital stocks, flows and market prices – to anticipate potential crises.
Sovereign credit risk estimation begins with debt. A country may have too much debt, it may have problems servicing the debt, or it may have a fragile economy so that any external or internal shock may force it to attempt to resort to debt. So risk assessments will typically use measures of outstanding debt and/or debt growth, the scope to grow the economy and service the debt, and the expected productivity benefits of any debt-fueled spending.
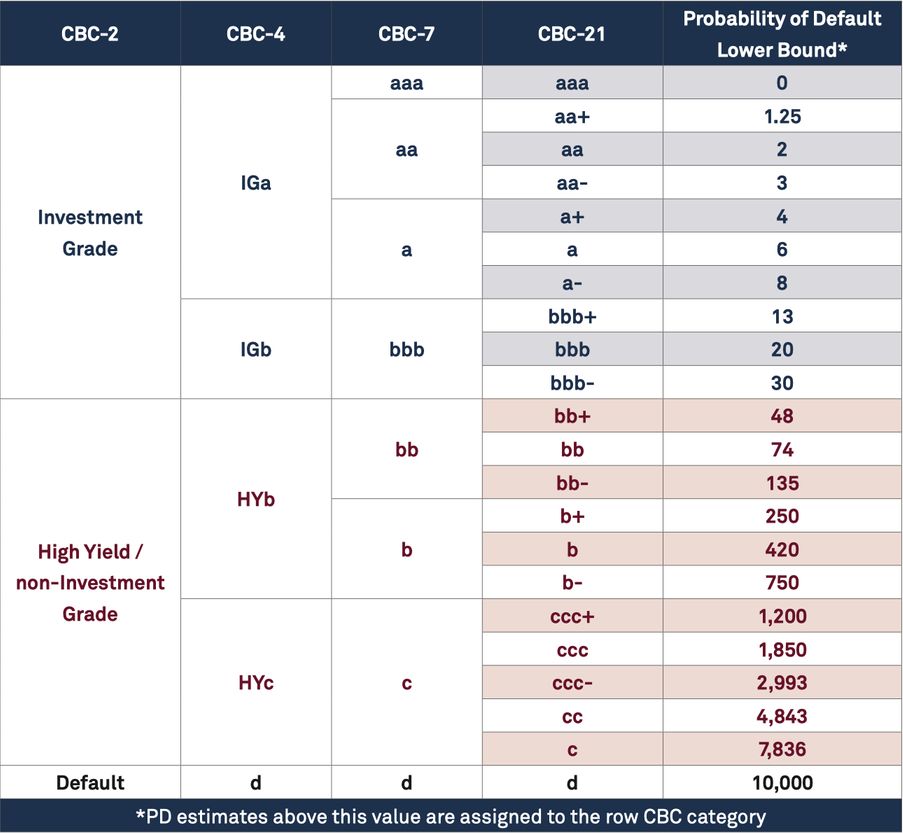
The UN currently recognizes 193 Sovereigns 5 . The exact number covered by rating agencies fluctuates, especially due to initiation or withdrawal of unsolicited ratings, but for the purposes of this paper we have used 112 comparable ratings from one or more of the major agencies. In a typical month, Credit Benchmark publish quorate 6 Probability of Default (“PD”) estimates for 88 of these, and are semi-quorate on 31 more for a total of 119. Contributed bank and rating agency coverage includes 85 Sovereigns in common. Some of these are not rated by any of the major agencies. Throughout this paper, PDs will be converted to CBCs 7 ; these and agency ratings will be expressed as numeric categories, with AAA / aaa = 1 and C/c = 21.
Exhibit 4.1 compares the CBC and S&P Long Term Sovereign ratings, converted into numeric ranks.
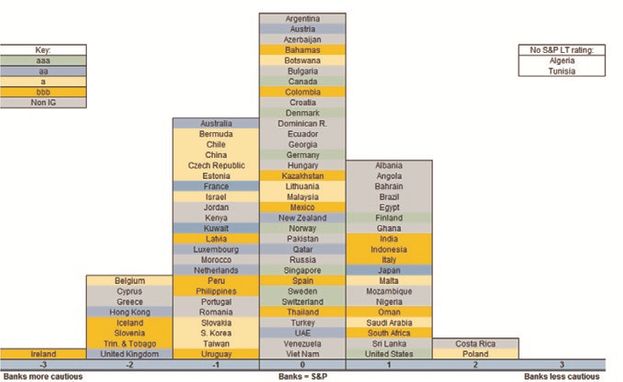
Exhibit 4.1 shows that most of the differences are +/- 1 notch. The 2- notch differences are skewed to the left.
This shows that banks tend to be more slightly more cautious than S&P, with a slightly higher proportion of Sovereigns to the left of the center of the histogram (i.e. there are a higher proportion of Sovereigns where CBCs are lower than the agency rating.)
N.B. This chart is based on CBC categories and CRA ratings from H1 2016.
Exhibit 4.2 shows the relationship between the Sovereign CBC and the long term, foreign currency agency rating categories averaged across the three main agencies.
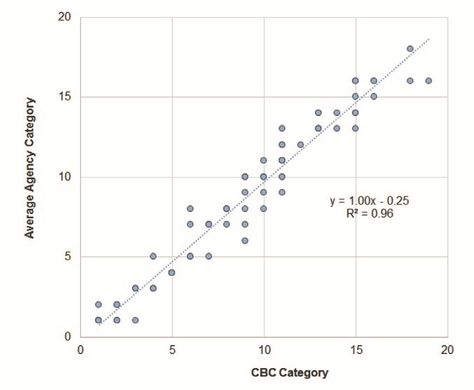
Exhibit 4.2 shows that a comparison with all 3 rating agencies leads to a larger number of differences of more than +/- 1 notch.
However, the fitted line shows that the CBC explains 96% of the variation in the average agency credit rating, across 85 Sovereigns.
The slope of the line suggests that the CBCs are an unbiased estimate of the CRA rating, after adjusting for the constant level of increased caution.
The negative value for the intercept confirms that banks tend to be slightly more cautious than an average of all three the rating agencies for this group of Sovereigns.
The examples in this section demonstrate the value of Sovereign risk measures. In addition to the obvious use cases of protecting loan books, export revenues or direct investments, these risk measures also provide a benchmark for calculating market risk premiums and detecting anomalies in other financial metrics.
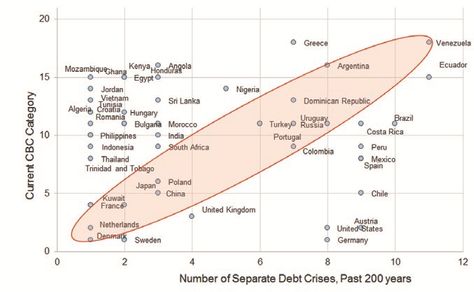
Exhibit 5.1 plots the relationship between the current bank estimate of credit risk measured by the CBC, and the number of times that an individual country has been involved in a debt crisis in the past 200 years. The red oval shows countries where the current risk assessment is proportional to the previous crisis history. There are relatively few names in this area, although Argentina and Venezuela currently stand out as respectively emerging from, and potentially entering, a crisis.
This chart shows that the current assessment of credit risk large ignores previous history of serial defaulting. This may be because the countries with the highest default frequency – many of them in South and Central America – have typically implemented such wide-ranging reforms that the previous history is now irrelevant.
Countries that are currently viewed as high risk which are less prone to crises – mainly in Africa and the Middle East are typically a source of current political concern.
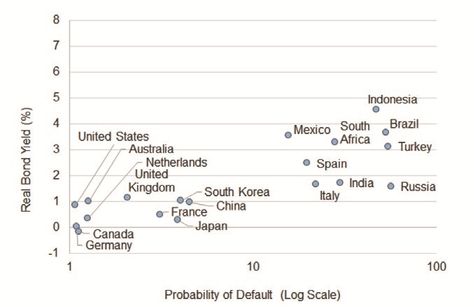
Exhibit 5.2 shows the relationship between real bond yields (i.e. inflation and nominal bond yields adjusted for inflation) and credit risk, measured by the PD. The chart uses July 2016 data, and updates a previous white paper 8 , which showed evidence of mean reversion in this relationship; suggesting a long run correlation between real bond yields and credit quality.
The chart shows that the moderately stable relationship between real yield and PD has persisted. The three elements of this relationship – credit risk, nominal yields, and inflation – are interconnected 9 .
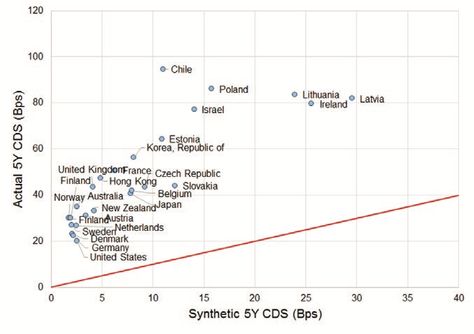
Exhibit 5.3 shows the relationship between actual Sovereign CDS spreads and synthetic CDS spreads, estimated from PD and LGD data. This chart uses July 2016 data and is an updated extract from a previous Credit Benchmark White Paper 10 , which used late-2015 CDS prices.
This chart shows that, with suitable assumptions, it is possible to identify the risk premium, which drives the difference between risk neutral (i.e. market implied) and real world PDs 11 . If the risk premium is zero, then all of the plotted points would lie on the red line.
The CDS approach shown here can also be applied to Government bond yields, which would extend the risk premium analysis to a larger group of Sovereigns.
The risk premium varies over time and is often viewed as equivalent to the ‘Market Price of Risk’. In practice, there is likely to be more than one risk premium which corresponds to different credit quality categories, and it may vary by other dimensions – such as industry or region.
Exhibit 5.4 shows the risk premiums by CBC category for the period July-2015 to April-2015, as implied by the Sovereign CDS market.
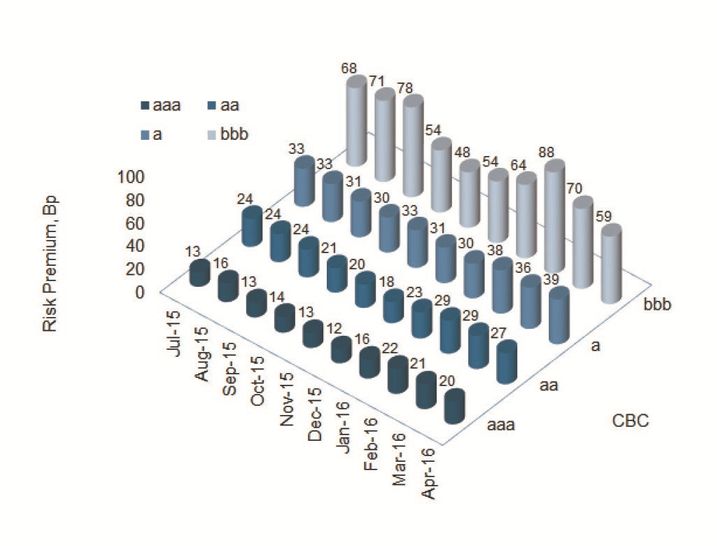
Exhibit 5.4 shows that the risk premium varies over time but it also varies by credit quality, so extending the Sovereign universe to include all Government bond issuers would provide a more granular and robust set of risk premium time series.
The risk premiums shown in Exhibit 5.5 are specific to Sovereigns but the approach can be extended to corporate obligors, where the risk premium and credit transition matrix may vary by sector or region.
If the risk premium analysis shown here is combined with the relevant transition matrix, then it becomes possible to estimate PD term structures for different credit classes over time. This has applications for IFRS9 and CECL accounting requirements.
This report uses a simple set of explanatory variables 12 to classify the Sovereigns in the bank universe, with the aim of providing ‘Evaluated’ credit risk estimates and categories for the unrated Sovereigns.
These are listed in Exhibit 6.1.
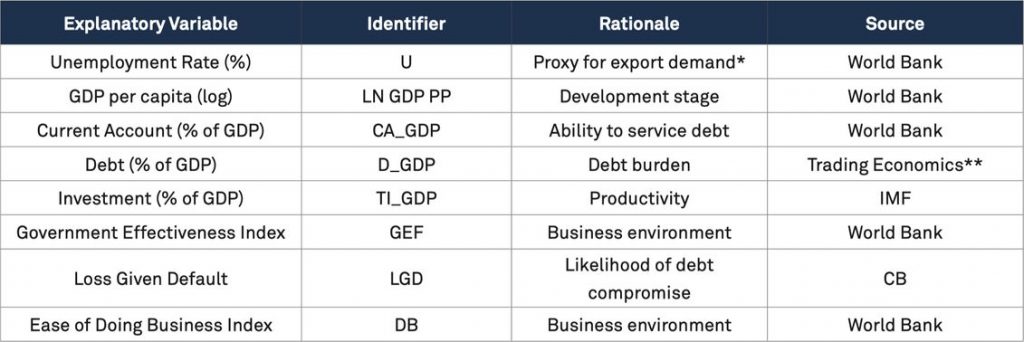
Exhibit 6.2 shows the correlations between these.
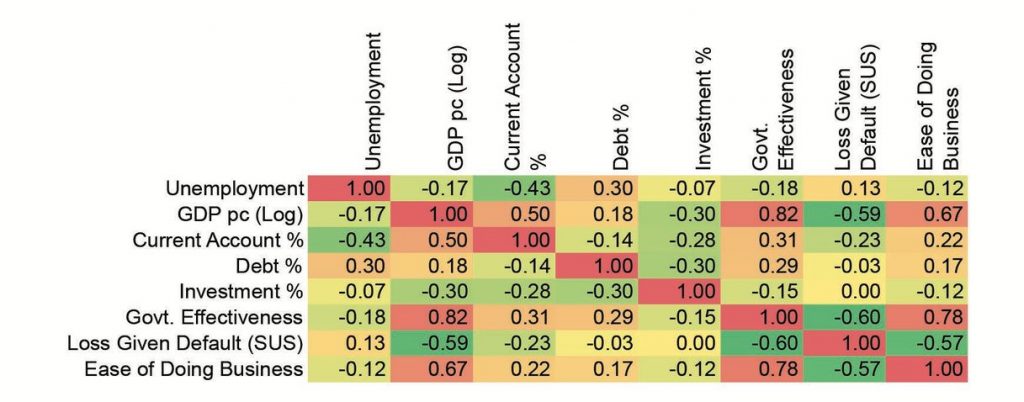
This shows some strong positive cross-sectional correlations between, for example, Government Effectiveness or Current Account surplus and GDP per capita. There are negative correlations between GDP per capita or Ease of Doing Business and Loss Given Default. Exhibit 6.3 shows the z-scores 13 for each explanatory variable across each of the Sovereigns in the bank universe, sorted by default probability.
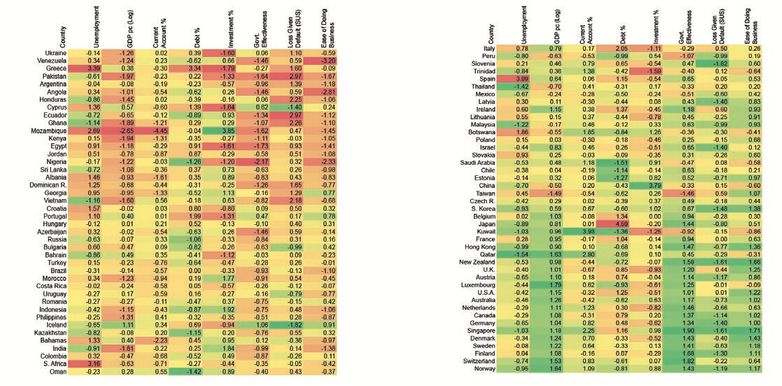
This shows that both high- and low- PD Sovereigns have similar z-scores for the same explanatory variables, but the two groups tend to have opposite signs on the z-scores. There are some obvious exceptions to this, such as LGD in Cyprus or Debt in Japan.
Exhibit 6.4 shows regression results 14 for the universe of Sovereigns covered by the banks. All explanatory variables are initially included, but the correlations in Exhibit 6.2 suggest that some of these are interchangeable, and the t-stats indicate that some of them are of secondary importance. The dependent variable is the logarithm of the PD, which correlates very highly with the CBC but allows for more granularity in the regression.
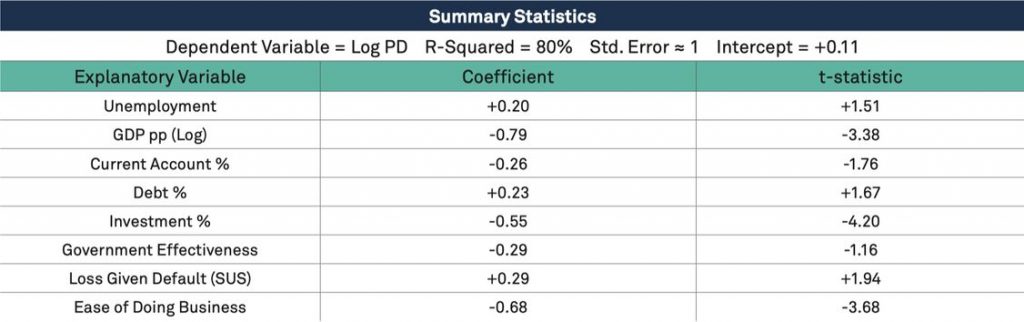
This shows that GDP pp, Investment and Ease of Doing Business are the most significant variables, with Loss Given Default, Debt, Unemployment and Current Account close to significance at the 5% level. As Exhibit 6.2 showed, Government Effectiveness and Ease of Doing Business are highly correlated so in practice either can be used. The coefficient signs are consistent with a priori expectations.
Exhibit 6.5 shows macroeconomic profiles for Costa Rica, Azerbaijan and Paraguay. The z-scores for the explanatory variables for each country are plotted in the various dimensions of the radar charts; the signs are modified to reflect the regression coefficients so that a country with zero credit risk would appear as a single point in the center. And in general, the larger the plotted profile, the higher the credit risk – although as Exhibit 6.4 shows, some variables have considerably more significance than others.
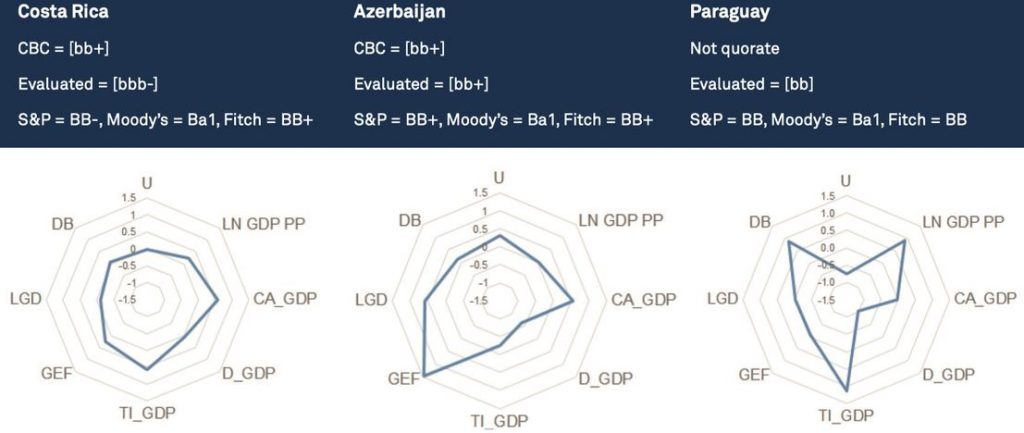
These three countries have similar CRA ratings, but all show very different macroeconomic profiles. For Azerbaijan, the CRA ratings are aligned with the CBC and the evaluated CBC. For Costa Rica, two of the three agencies are aligned with the CBC, but the evaluated category is about half a notch higher. Paraguay is not quorate, but the evaluated category is the same as S&P and Fitch. Paraguay scores badly (high positive values increase credit risk) on Investment GDP per person; but Debt and Unemployment are not major issues. Azerbaijan suffers from poor Government Effectiveness and a Current Account problem; Costa Rica also scores badly on its Current Account as well as Investment.
This demonstrates how different macroeconomic drivers can balance one another in driving credit risk; but also highlights how a change in any one of those drivers may result in a credit upgrade or downgrade.
Exhibit 6.6 shows the evaluated (i.e. Estimated) and actual CBCs for the Sovereigns in the bank universe.
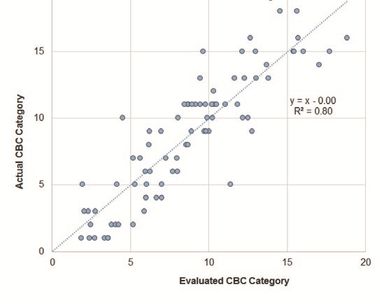
The slope of the line is insignificantly different from a value of 1, suggesting that the evaluated CBC is an unbiased estimate of the Actual CBC. In other words, the outliers are evenly distributed on either side of the fitted line.
The Evaluated CBC explains 80% of the variation in the Actual CBC.
The standard error of the regression gives an indication of the ‘noise’ in evaluated credit categories. The equivalent for the quorate estimates is given by the standard deviation (“SD”) of the individual bank estimates. Exhibit 6.7 shows the relationship, in logs, between the quorate Sovereign PDs and SDs.
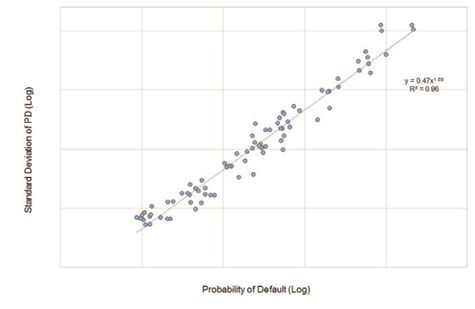
This shows a stable positive relationship between this standard deviation and the PD average 15 .
This implies that obligors with high PDs show more uncertainty between banks. That uncertainty is broadly proportional to the PD, although that proportion is slightly higher for high risk obligors.
However, another interpretation is that the causality runs the other way – that high uncertainty implies higher PDs, due to the lower bound on PDs. Even if most banks agree about the risk for an obligor, it only needs one bank to take a different (higher) view to push up the average and the standard deviation.
Exhibit 6.8 shows two sets of credit risk estimates, for the Quorate and Non-quorate universes respectively. The set on the left are the actual, bank-sourced CBCs for the quorate Sovereigns sorted by CBC value. The set on the right are evaluated CBCs, again sorted by value. The vertical blue bars are the actual or evaluated CBC categories. The black bars represent estimate errors (i.e. confidence intervals). The horizontal red line shows the Investment Grade threshold.
Quorate Sovereign error bars use the SD of the relevant PD, converted into CBC scale units. For non-quorate Sovereigns, the relationship plotted in Exhibit 6.7 has been extrapolated to give SD estimates for each Sovereign in that group. The actual plotted error bars for the evaluated CBCs are based on a combination of the estimated standard deviations and the standard error of the regression reported in Exhibit 6.4. 16
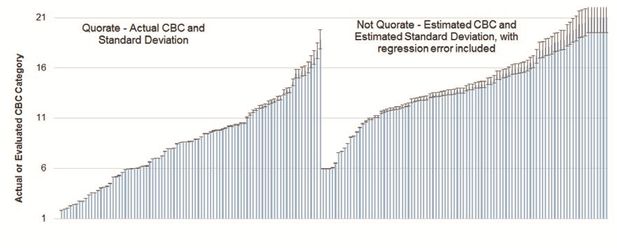
This shows that most of the evaluated CBCs are non-Investment Grade; few of them have agency ratings.
It also shows that the error bars for the evaluated CBCs are, by construction, wider than the quorate CBCs, reflecting the additional source of uncertainty arising from the regression framework.
The evaluated CBC rank values have been truncated: they are capped at a value of 21, which corresponds to one notch above default, and are floored at a value of 6, which corresponds to a CBC of [a]. In practice the regression framework can return estimated CBC values which are higher than 21 or lower than 6 (or even lower than zero), depending on the macroeconomic data for each Sovereign.
These cut-offs are somewhat arbitrary, but the values in the tails of the evaluated CBC distribution tend to be driven by outlier values of the explanatory variables and this truncation only affects a small number of evaluated Sovereign CBCs. It is uncontroversial for the capped values which are close to default, but could be seen as excessively cautious for the floored values.
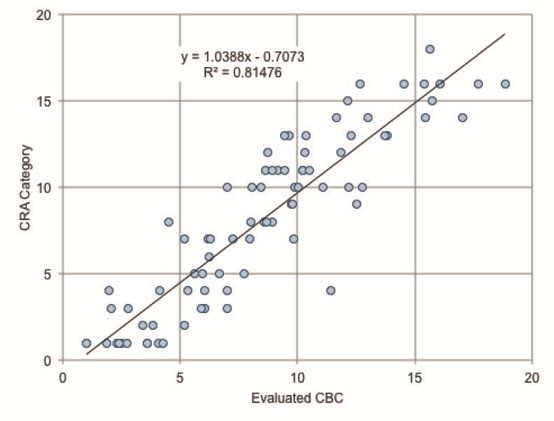
Exhibit 7.1 shows the relationship between the evaluated CBCs and the equivalent CRA category, for the quorate Sovereign subset.
The R-squared of 81% can be compared with the 96% fit between quorate CBCs and CRA categories in Exhibit 4.2.
The fitted line shows that the lower risk Evaluated CBC categories are generally more conservative than the equivalent CRA category, but the CRA view becomes more conservative for the higher risk countries.
Current Credit Benchmark research is focused on the out-of-sample performance of the evaluated CBCs. The overlap with rating agencies is small, so to draw firm conclusions it will be necessary to carry out historical back testing and assess a variety of evaluation frameworks and explanatory variable sets.
›Banks cover at least as many Sovereigns as the main rating agencies:
›88 Sovereigns are Quorate (more than 3 contributors)
›31 Sovereigns are Semi-Quorate (2 contributors)
›20 Sovereigns are covered by one contributor.
›Rating agencies cover about 110 – 120 Sovereigns, but this varies depending on the number of live unsolicited ratings.
›Banks views explain 96% of the variation in Big 3 views but are systematically slightly more conservative than rating agencies.
›Bank-sourced views provide a benchmark for the analysis of a broad range of anomalies – such as the relationship with historic debt crises, CDS spreads and real bond yields.
›Bank sourced views also provide a regular and robust source of real world default probability estimates Combining these with market data (CDS spreads and / or bond yields) and credit transition matrices makes it possible to estimate liquidity risk premium term structures which vary over time and by credit category.
›For Sovereigns that are not adequately covered by banks, it is possible to construct unbiased evaluated ratings based on weighted linear combinations of fundamental data. This gives provisional, but higher variance, evaluated credit views on 94 additional Sovereigns. These evaluated views are not intended to be a substitute for bank views, but they do provide an expected range for the likely credit standing.
›The evaluated rating framework used here is only one of a large number of Sovereign risk models which could be calibrated using bank views – there are a large number of specialised Sovereign risk models currently in use, which could use the bank sourced views as an additional low variance model input or model validation benchmark.
Manias, Panics, and Crashes: A History of Financial Crises, Charles P. Kindelberger (1978)
Devil Take the Hindmost: A History of Financial Speculation, Edward Chancellor (1998)
Sovereign Risk and Financial Crises, Michael Frenkel, Alexander Karmann & Bert Scholtens (Eds.) (2004)
The Forgotten History of Domestic Debt, Reinhart & Rogoff, NBER WP 13946 (2008)
This Time is Different: Eight Centuries of Financial Folly, Carmen M. Reinhart & Kenneth S. Rogoff (2009).
Sovereign Credit Risk in a Hidden Markov Regime-Switching Framework, Louise Potgieter & Gianluca Fusai (2013)
Download the article “Measurement Of Sovereign Credit Quality” on PDF.
We aggregate the views of thousands of institutional credit analysts to create new, unique consensus data and analytics. Our clients use the unique entity- and aggregate-level data and analytics to understand and manage their risks effectively. The data helps clients focus their attention on where and when it matters most, whether in their risk management, investment process, or regulatory compliance. Learn more.
Barbora Makova
David Carruthers
1 See Appendix 1 for a brief selection.
2 Manias, Panics, and Crashes: A History of Financial Crises, Charles P. Kindelberger (1978)
3 This time is different: Eight Centuries of Financial Folly. Reinhart & Rogoff (2009). A ‘crisis’ is defined as a default or restructuring. Some crises take years to resolve, so the start date is used in the chart.
4 Sovereign Credit Risk in a Hidden Markov Regime-Switching Framework, Louise Potgieter & Gianluca Fusai (2013)
5 This excludes Sovereign-like entities such as Puerto Rico, or the Channel Islands.
6 PD and LGD estimates are ‘quorate’ when 3 or more banks contribute estimates for the same legal entity in the same month. Semi-quorate entities are those where only 2 banks currently contribute PD estimates. Credit Benchmark can only publish PD estimates or CBC categories for quorate entities.
7 The Credit Benchmark Consensus (“CBC”) is a convenient summary credit risk scale based on 21 PD breakpoints, similar to the scales used by rating agencies. It is explicitly based on PD breakpoints (agreed with contributor banks) and provides a benchmark for agency ratings. See Appendix 2 for the CBC to PD mapping.
8 See https://www.creditbenchmark.com/research/sovereign-bond-risk-management
9 For example, following the Brexit vote, banks and rating agencies have increased their risk estimates for the U.K. Government while the currency has weakened. The weaker currency may have some inflationary impact, and the lower credit rating may feed into borrowing costs. All three components of this relationship may adjust to bring the relationship back to its long-run position.
10 See https://www.creditbenchmark.com/research/sovereign-default-risk-developing-economies
11 The original paper used a simple survival function approach to extrapolate from 1-year PDs to 5-year PDs. Current Credit Benchmark research is leveraging the very large and frequently updated Credit Benchmark dataset to develop credit transition matrices (“CTMs”), which may vary by obligor type or sector. Part of this research is aimed at estimating Sovereign-specific CTMs, which will support more refined estimates of the Sovereign risk premium.
12 There are a large number of Sovereign risk models, some of which use highly proprietary data. For example: IHS-Markit Sovereign Risk Service, Economist Intelligence Unit Sovereign Risk.
13 Definition: Z-score(i) = [X(i) – µ(X)]/ Ω(X) where X(i) is the value of explanatory variable X for country i and µ(X) and Ω(X) are the mean and standard deviation of X.
14 If CBCs are used as the (limited) dependent variable, ordered probit might be more appropriate. In practice, for this dataset, the two methods give very similar results, although ordered probit provides probabilities of membership of each dependent variable category. With y=log PD, the estimated CBC values can lie between the integer notch thresholds (e.g. the estimated CBC value could be 9.6, rather than 9 or 10).
15 A very similar relationship is observed for all quorate obligors (including financials, corporates and funds).
16 Combination assumes independence i.e. Error Bar (i) = √ ([Est. Standard Deviation (i)] 2 + [Standard Error of Regression] 2 )
Credit Benchmark is an entirely new source of data in credit risk. We pool PD and LGD estimates from IRB banks, allowing them to unlock the value of internal ratings efforts and view their own estimates in the context of a robust and incentive-aligned industry consensus. The resultant data supports banks’ credit risk management activities at portfolio and individual entity level, as well as informing model validation and calibration. The Credit Benchmark model offers full coverage of the entities that matter to banks, extending beyond Sovereigns, banks and corporates into funds, Emerging markets and SMEs.
We have prepared this document solely for informational purposes. You should not definitely rely upon it or use it to form the basis for any decision, contract, commitment or action whatsoever, with respect to any proposed transaction or otherwise. You and your directors, officers, employees, agents and affiliates must hold this document and any oral information provided in connection with this document in strict confidence and may not communicate, reproduce, distribute or disclose it to any other person, or refer to it publicly, in whole or in part at any time except with our prior consent. If you are not the recipient of this document, please delete and destroy all copies immediately.
Neither we nor our affiliates, or our or their respective officers, employees or agents, make any representation or warranty, express or implied, in relation to the accuracy or completeness of the information contained in this document or any oral information provided in connection herewith, or any data it generates and accept no responsibility, obligation or liability (whether direct or indirect, in contract, tort or otherwise) in relation to any of such information. We and our affiliates and our and their respective officers, employees and agents expressly disclaim any and all liability which may be based on this document and any errors therein or omissions therefrom. Neither we nor any of our affiliates, or our or their respective officers, employees or agents, make any representation or warranty, express or implied, that any transaction has been or may be effected on the terms or in the manner stated in this document, or as to the achievement or reasonableness of future projections, management targets, estimates, prospects or returns, if any. Any views or terms contained herein are preliminary only, and are based on financial, economic, market and other conditions prevailing as of the date of this document and are therefore subject to change. We undertake no obligation to update any of the information contained in this document.
Credit Benchmark does not solicit any action based upon this report, which is not to be construed as an invitation to buy or sell any security or financial instrument. This report is not intended to provide personal investment advice and it does not take into account the investment objectives, financial situation and the particular needs of a particular person who may read this report.

