
Credit Spreads have widened by as much as 74% so far this year: as the chart below shows, B-rated credit spreads are up from less than 4% to more than 6%.

Spreads show a major shift to a “risk-off” mindset, as supply shocks and rate hikes show no sign of abating. Many basic foodstuffs are up 20%; some, like eggs, are up more than 200%. Non-food commodity prices are mixed as global demand falters – so some Developing economies face the double hit of falling export revenues and rising import costs.
Central banks continue to hike rates, while commercial banks are now reserving against future loan impairment. Corporate default rates are likely to spike; Credit Consensus distributions show sector-by-sector proportions in the vulnerable b and c categories.
Across those sectors, correlations between default risks are changing – typically rising, others moving sharply down. Consensus data tracks these shifts across many otherwise unrated country/sector universes.
Figure 1.1 shows recent credit trends Global Financials, Corporates and Sovereigns.
Figure 1.1 Credit Trend and Distribution: Global Corporates, Financials and Sovereigns


Corporates continue to improve at a faster rate than Financials, which appear to be plateauing. Sovereign Government credit may be bottoming out after a steep decline but the monthly numbers are volatile.
Figure 1.2 shows regional trends and distributions for Sovereigns, Corporates and Financials.
Figure 1.2 Credit Trends and Distributions by Region: Sovereigns, Corporates, Financials


Regional Sovereign aggregates are all turning down, Corporates continue to improve (although see Figure 1.3 below) – and Europe is slower than the rest; Financials improvement is slowing and turning down in Africa and Latin America. This is worth noting for any lenders with large exposures to financial counterparts in those regions.
Figure 1.3 shows the balance of 3-month upgrades and downgrades for Global Corporates and Global Financials.
Figure 1.3 3-Month Upgrades and Downgrades


Figure 1.4 compares the 3-month balance rates (% upgrades – downgrades) for Q2 2022 vs Q1 2022 across global industries.
Figure 1.4 3-Month Balance Rates (% Upgrades – Downgrades) by Global Industry – Q2 2022 vs Q1 2022
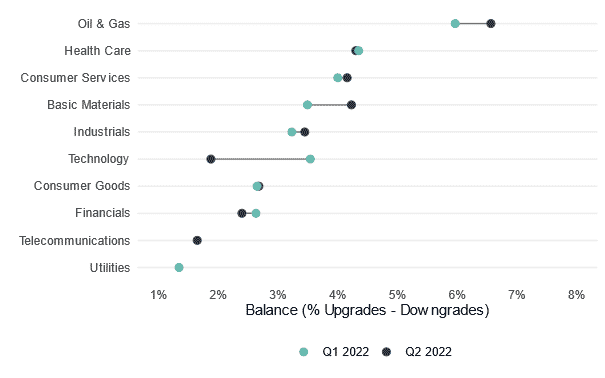
The Q2 2022 values lower than Q1 2022 imply that recovery rates have continued to slow. Technology has the largest drop over the quarter. Oil & Gas and Basic Materials show an increased rate of recover over the quarter.
Figure 1.5 plots the 3-month balance rates (% upgrades – downgrades) of Corporates and Financials by country, comparing Q2 2022 vs Q1 2022.
Figure 1.5 3-Month Balance Rates (% Upgrades – Downgrades) by Country – Q2 2022 vs Q1 2022

This again shows slowing recovery rates in many countries, including Hong Kong, Spain, Korea and Brazil. However, compared with Q1, there is an increased rate of improvement in Netherlands and Japan. But overall there are more countries below the 45-degree line (i.e. net improvements continue to slow).
Figure 1.6 shows the regional breakdown of credit trends in Corporates and Financials, comparing quarterly credit risk change in Q2 2022 and Q1 2022.
Figure 1.6 Quarterly Credit Risk Change: Q2 2022 vs Q1 2022
Corporates
Financials


Measured by change in average PD, most countries show a slight improvement in Corporates with the notable exception of the UK. Financials are more mixed: Canada, Pacific, Asia and the EU all show improvement; Africa, Latin America, US and UK all show slight deterioration.
Figure 1.7 lists the Corporate geography/industry/sector combinations that have shown recent turning points. The names on the left show a one-month deterioration after three months of improvement; those on the right show a one-month improvement after three months of deterioration.
Figure 1.7 Turning Points Q2 2022
| Deteriorating 1M After Improving Last 3 Months | Improving 1M After Deteriorating Last 3 Months |
| Europe Basic Materials | Europe Food & Drug Retailers |
| Europe Chemicals | Europe Oil & Gas Producers |
| Europe Durable Household Products | Global Drug Retailers |
| Europe Pharmaceuticals & Biotechnology | Global Electronic Office Equipment |
| France Construction & Materials | Global Forestry & Paper |
| France Corporates | Global Multi-utilities |
| Global Durable Household Products | Global Nondurable Household Products |
| Global Household Goods & Home Construction | United Kingdom Conventional Electricity |
| Global Marine Transportation | United Kingdom Distillers & Vintners |
| Global Pharmaceuticals | United Kingdom Electricity |
| Global Pharmaceuticals & Biotechnology | United Kingdom Food & Drug Retailers |
| Global Tires | United Kingdom Integrated Oil & Gas |
| Latin America Corporates | |
| North America Business Support Services | |
| South Africa Automobiles & Parts | |
| Taiwan Corporates | |
| United Kingdom Durable Household Products | |
| United Kingdom Exploration & Production | |
| United Kingdom Household Goods & Home Construction | |
| United States Support Services |
The list of recent deteriorations includes Durable Household Products in the UK, Europe and Globally, Household Goods & Home Construction in the UK and Globally and Pharmaceuticals & Biotechnology in Europe and Globally.
The improvements list includes instances of Electricity and Utilities, as well as Oil & Gas and Food & Drug Retailers.
A growing number of Central Banks have hiked rates in the face of spiralling inflation. The 60 rate rises across 55 countries in recent months, the fastest pace since 2000. Spreads have widened, especially in High Yield bonds – BB, B and C spreads are up around 75% since the start of the year.
Aggressive US rate hikes are likely to continue; driving the Dollar higher and pushing up prices of some USD-denominated commodities that are already in short supply. But there have also been substantial commodity price drops. Figure 2.1 shows the range.
Figure 2.1 Commodity Price Changes, % YTD.

At a time when public debt levels are rising, higher funding costs are an added burden for Government finances; see section 3 below on Food Price Inflation and Sovereign credit.
Some Corporates have correctly anticipated the shift in interest rate policy and have issued large amounts of long-duration cheap debt. This has insulated them from the immediate impact of rate hikes; and they have limited amounts of maturing debt needing to be rolled over at higher coupons.
Figure 2.2 shows the top 25 aggregates based on the proportion of constituents in the c category (i.e., closest to default).
Figure 2.2 Top 25 Aggregates by % in c Category
| Aggregate | % in c category |
| Africa Sovereign Government | 24.1% |
| Africa Sovereign & Central Banks | 21.7% |
| Emerging/Frontier Sovereigns | 16.4% |
| Africa Banks | 14.5% |
| North America Hotels | 13.3% |
| Global Sovereigns | 13.2% |
| Global Airlines | 13.1% |
| United States Hotels | 11.8% |
| North America Retail REITs | 10.7% |
| United States Retail REITs | 10.7% |
| United Kingdom Recreational Services | 10.3% |
| Europe Recreational Services | 9.9% |
| North America Aerospace | 9.8% |
| North America Travel & Leisure | 9.7% |
| Turkey Banks | 9.5% |
| Global Sovereign Government | 9.4% |
| Turkey Financials | 9.1% |
| United States Travel & Leisure | 9.1% |
| United States Aerospace | 8.8% |
| Latin America Sovereign & Central Banks | 8.7% |
Developing markets – Sovereign and Financial – feature heavily in this list, but it also includes US Hotels / Travel & Leisure, UK Recreational, US Aerospace, Global Airlines and Global Coal.
This suggests that Global Sovereigns, Developed market financials and US / UK leisure Industries are the most likely immediate casualties in the event of rising default rates.
Figure 2.3 shows latest trends for some of the most and least leveraged US industries.
Figure 2.3 US Industry Credit Trends by Leverage
High Leverage (Av. Equity Index -16% YTD)
Low Leverage (Av. Equity Index -10% YTD)


Industries with higher leverage have seen higher stock price declines this year. Three of the four industries plotted on the left showed limited credit deterioration during the pandemic but have also shown only modest improvement.
The less leveraged sectors, on the right, declined more during the pandemic but three of the four have either matched or exceeded the credit changes for the more leveraged industries. Transportation is a laggard.
If interest rates continue to rise, Credit Consensus Ratings for the less leveraged industries are likely to continue to outpace the more leveraged. For Financials, the impact is mixed. Net positive for banks (rising margins, but potentially lower business volumes) and insurance companies (cash floats / strong cash flow). However, banks also face rising loan delinquencies, and reinsurers may see some negative impact from trade credit insurance losses and other forms of credit insurance. Rising annuity rates are probably net positive, but it depends on the balance between assets and liabilities in terms of interest sensitivity.
Food prices inflation will be difficult to control as long as the Ukraine war continues. Even if the Ukraine harvest partially succeeds, there are logistical problems in moving grain out of the Black Sea although the Turkey-brokered deal may solve part of this. The fertilizer shortage means higher prices across a broad range of foodstuffs. Volatile weather and continued COVID waves have made shortages worse.
Figure 3.1 shows projected food price inflation and Sovereign credit risk for 115 countries.
Figure 3.1 Projected Food Price Inflation and Sovereign Credit Risk for 115 Countries

High food price inflation has a disproportionately negative effect on most of the countries that already have low credit quality.
Countries with a combination of poor Credit Consensus Rating (b or c) and high sensitivity to food price inflation (projected >20% in 2022), and hence at higher risk of being pushed into default / bailout territory include Angola, Egypt, Ethiopia, Ghana, Turkey, Malawi, Nigeria and Paraguay.
Countries in the bb category with similarly high food price inflation include Georgia and Kazakhstan (Credit Benchmark Credit Consensus Rating = bb+, although agency ratings still show it as investment grade). Colombia, currently bbb- (although agencies rate it as high yield), is also facing excessive food price inflation.
Six of these countries are in Africa, two in Latin America, two in the Black Sea region and one in central Asia. Turkey and Kazakhstan have had serious food and energy riots already; there has been similar unrest in Peru, Tunisia, Uganda and Sri Lanka.
Some of the countries on this list have external revenue sources that may cushion the blow; Nigeria has oil and Kazakhstan has oil and uranium. But for most the impact of food price inflation is direct and likely to become more severe in the coming 12 months.
Figure 3.2 shows credit trends for Food Producers in various regions.
Figure 3.2 Credit Trends for Food Producers in Various Regions


Africa is rebounding and Asia is continuing to improve; but Europe and Latin America are plateauing and may be turning down. The outlook for profits and credit is the result of a delicate balance between higher input costs vs higher output prices; that may be driving the regional differences seen here.
Oil price spikes this year have briefly exceeded the highs recorded in 2012-2014; gas prices are at their highest for over 10 years (see Figure 2.2). If prices remain at these levels, mothballed and marginal sources of fossil fuels become economic again – although growing recession concerns may offset some of the supply chock impact.
If fuel costs and the need for fuel security give a boost to traditional non-renewables, it may be long-term positive for renewables. While alternative energy cannot yet fill the supply gap, the current crisis will drive more investment into diverse, sustainable and secure energy sources. At least the crypto winter has reduced energy demand from digital mining.
European energy supplies face major, direct challenges. If Russia cuts gas exports to Europe completely, then winter power cuts and rationing are likely; plus increased friction within Europe as individual countries focus on securing their own supplies.
Figure 4.1 shows latest credit trends for Oil & Gas firms.
Figure 4.1 Oil & Gas Producers: Credit Trends


Oil & Gas Producers were badly hit during the early phase of the pandemic as international travel shut down, but most of them have been recovering since mid-2021. African producers have taken longer, and although the 2021 deterioration seems to have ended the series remains volatile. North American producers show the largest improvement; Europe (which includes the UK) has yet to recover.
Credit trends for Integrated firms show a similar pattern to Producers. In the E&P sector, the gap between North America and Europe is even more pronounced.
The pandemic has changed the relationship between credit risks in different sectors. Figure 5.1 and 5.2 show correlations between PD changes for various US Corporate sectors for the periods (1) early 2016 to early 2020 and (2) early 2020 to Q2 2022.
Figure 5.1 Correlations Between PD Changes, Early 2016 to Early 2020

From mid-2016 to the start of the pandemic in early 2020, correlations were generally low to negative across many aggregate pairs. Financials and Corporates showed moderate correlation.
Some specific examples:
Figure 5.2 Correlations Between PD Changes, Early 2020 to Q2 2022

Since the start of the pandemic, correlations between corporates and financials have risen.
In addition:
The list of aggregates with a full monthly history starting in 2016 includes more than 850 geographic and industry/sector combinations. Correlation matrices are available for subsets of these, and a matrix generator worked example is also available from Credit Benchmark.