
Stubborn inflation risks steeper global credit deterioration
Key Findings:
- Global Corporates vs Global Financials vs Global Sovereigns: PDs flatlining but slight downgrade bias continues for Corporates and Financials
- Credit Risk Scores and Changes: Canada Farming tops list, more Asian and European indices appearing, CCPs still high, Africa remains heavily represented
- Credit Volatility Stable to down: suggests larger companies may avoid worst of any 2023 default spike
- US Sector PD comparisons: Consumer sectors deteriorating, some respite for higher risk tech sectors
- Leveraged Loans: Global downtrend paused, balance shifting to upgrades; but UK driving Europe deterioration
- Wage inflation and credit: Financial Services and Transport most at risk; Telecomms and Personal Products downgrades may be overdone
- Renewable Energy vs Fossil Fuel: Renewables show major deterioration past few years, but credit tide may be turning in their favour
Despite increased US-China tension and return of the US Debt Ceiling stand-off, the general optimism reported last month has continued in some areas, justified by better US growth numbers, better UK fiscal numbers, and drops in inflation as the mild winter has brought gas prices to pre-war levels – curtailing energy company windfall gains. But bond market hopes of early rate cuts seem to be fading as inflation remains stubbornly high.
Challenges remain – extreme weather in US, Brazil, Japan, North Africa and Southern Europe have hit fresh food supplies. Rising bank interest earnings are the flipside of higher mortgage costs, as low fixed rate deals expire. Job losses are climbing and SME defaults are rising, especially in Europe. In addition to regular updates, this report includes special features on Leveraged Loans, wage cost credit impacts, latest US sector default rates and renewable energy credit trends.
Global Corporates vs Global Financials vs Global Sovereigns
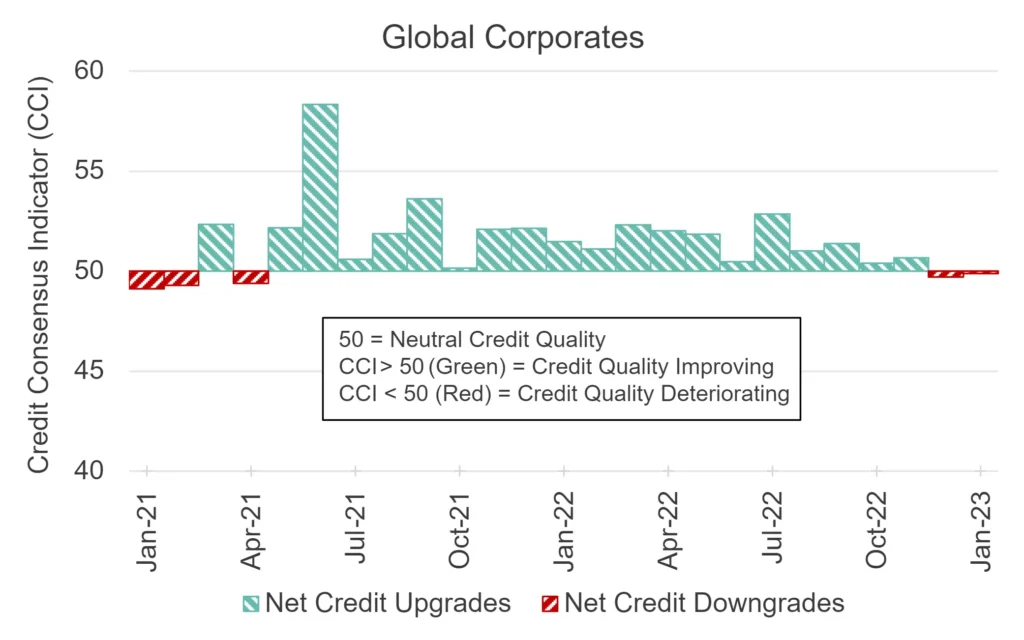
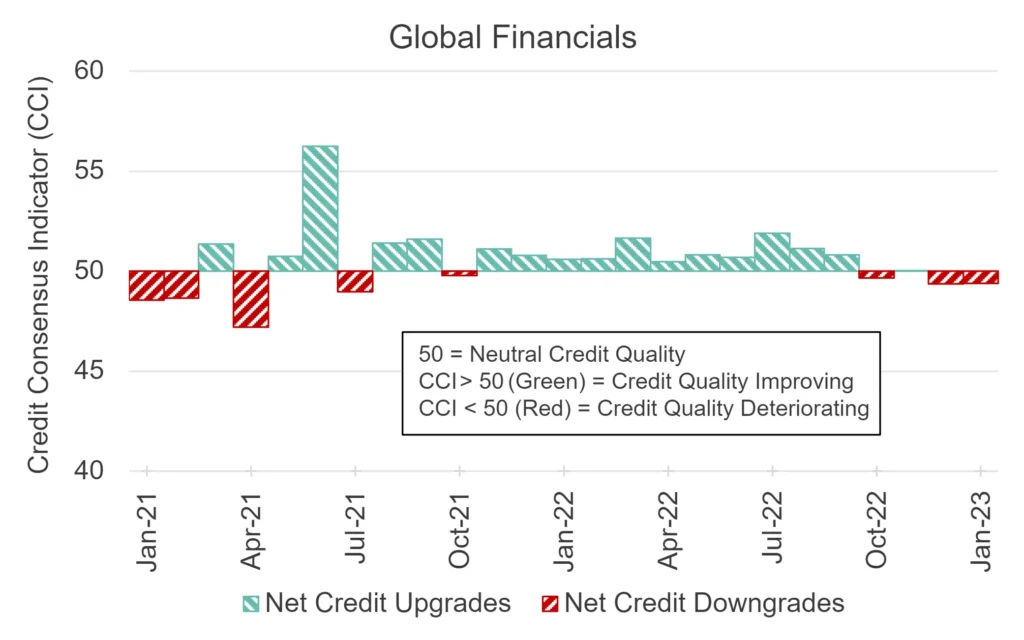
PDs flatlining but slight downgrade bias continues for Corporates and Financials.
The charts below show global trends for average PDs and their 2-year Credit Consensus Indicators (CCIs)1.
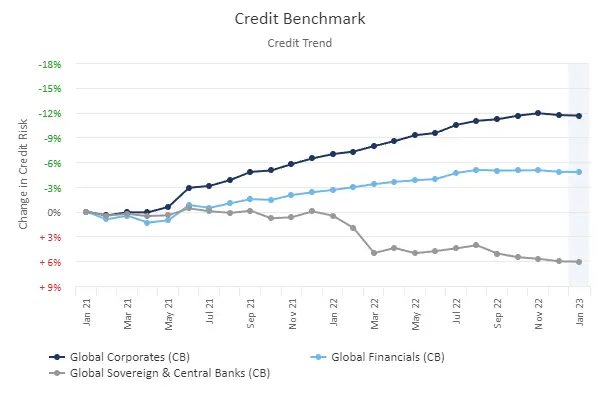
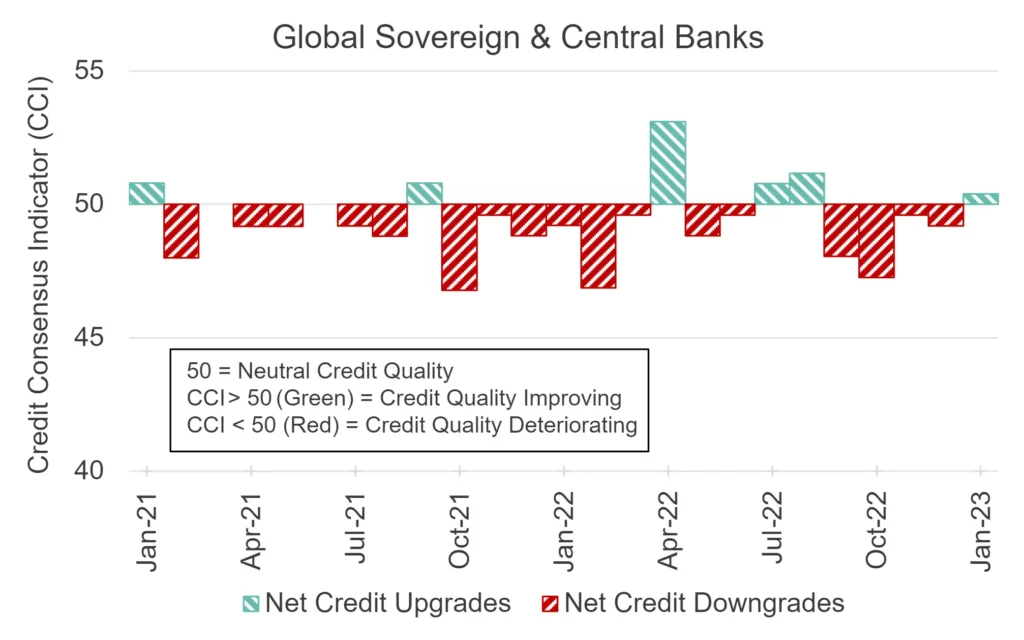
Globally, Sovereign PDs have stabilised after a prolonged deterioration vs. Corporates and Financials, and the CCI has turned positive. As the energy shock fades and public support programs wind down, fiscal balances will likely improve unless economic headwinds put a drag on tax receipts.
Corporates and Financials are reporting very mixed results – everything from massive windfall gains (energy, banks) to cratering demand (consumer discretionary, housebuilding) – but the credit indicators are biased towards downgrades. Sector selectivity will be key for credit portfolios.
Industry Trends: Six to Watch
The charts below are based on the net balance between upgrades and downgrades which forms the Credit Consensus Indicator (CCI). The plotted indices are examples of consecutive net downgrades in recent months.
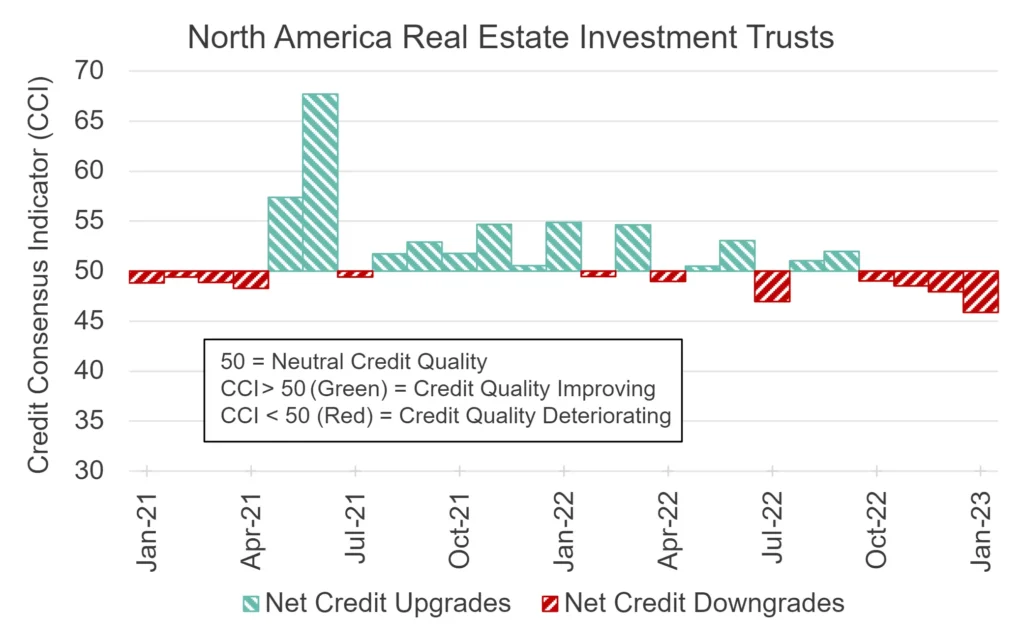
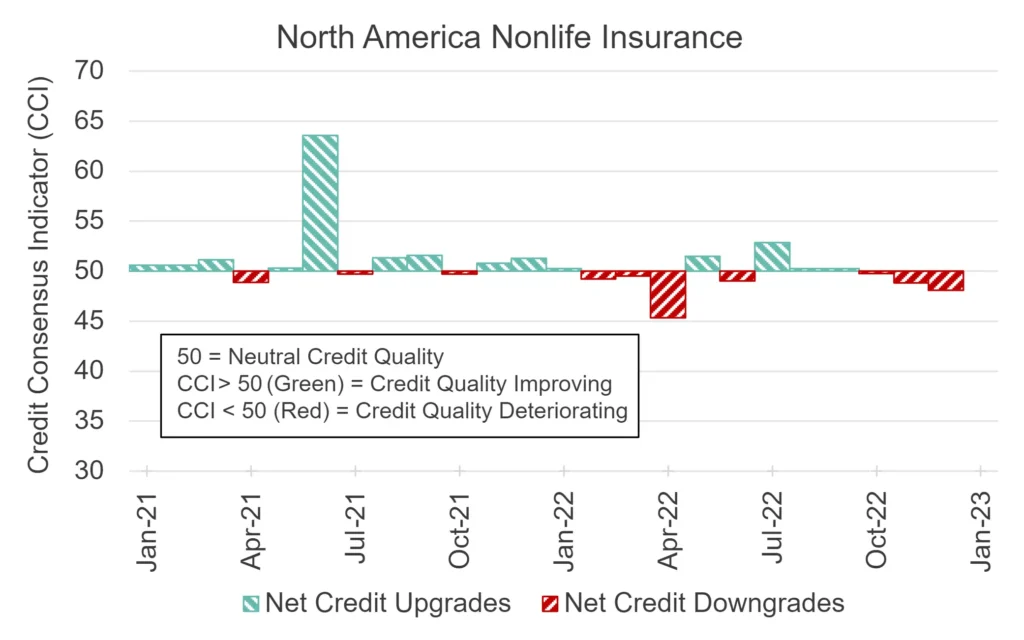
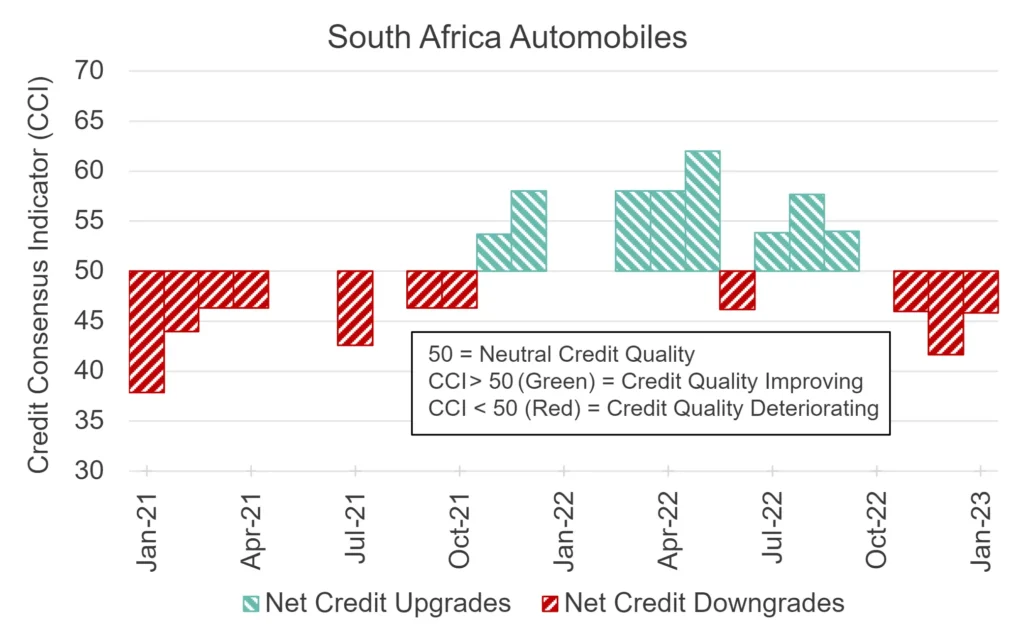
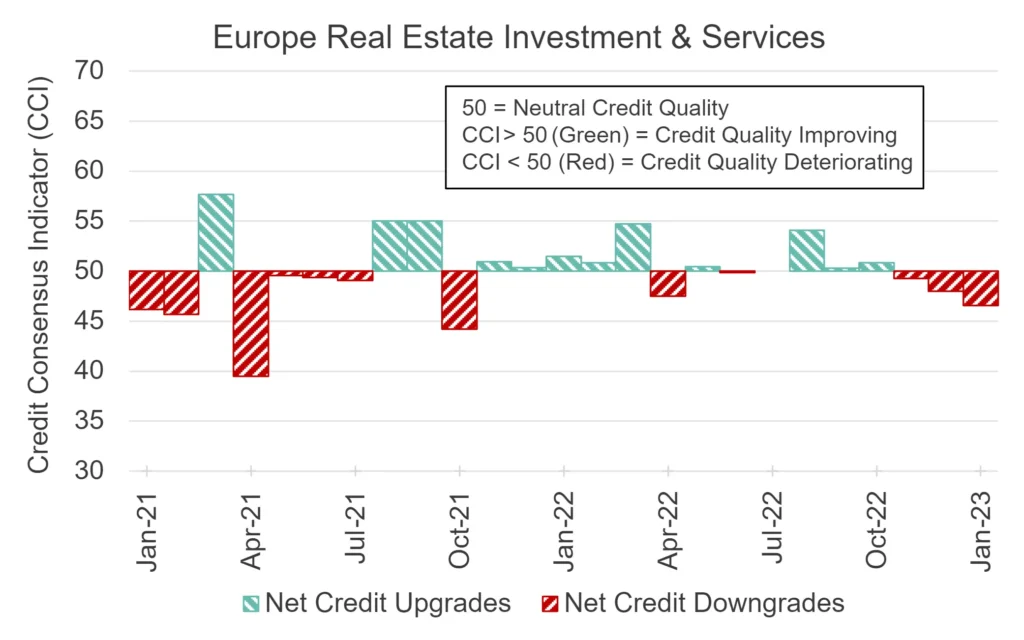
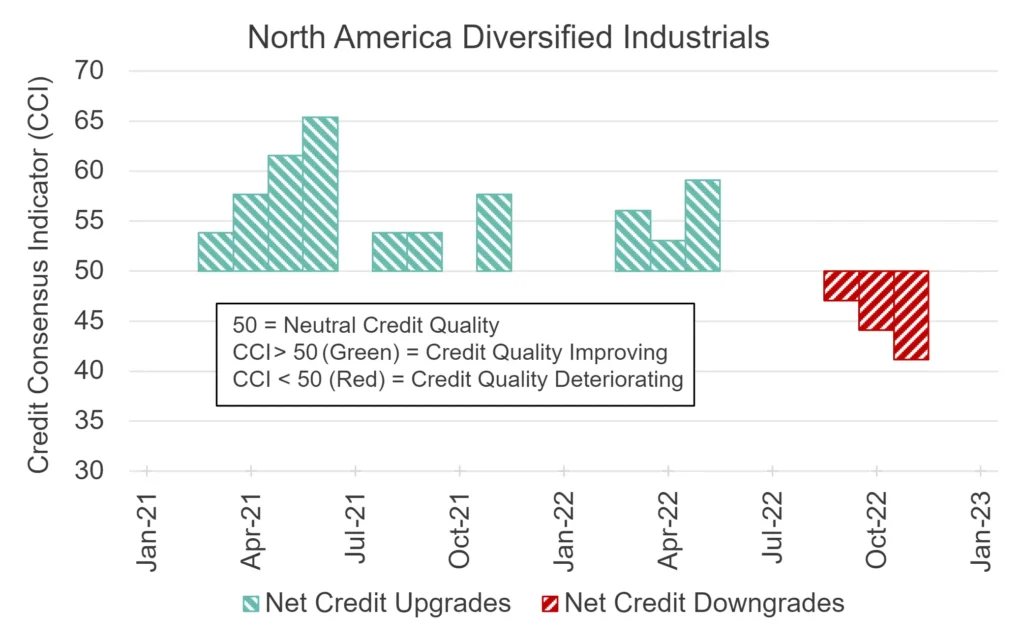
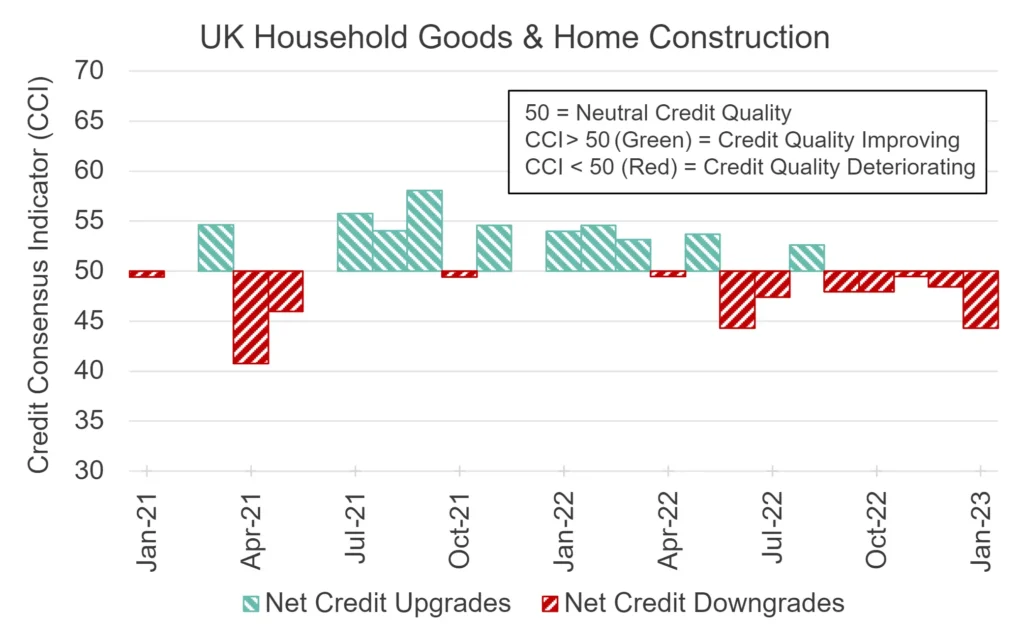
Various indices in the same or similar sectors show similar patterns but these are the most dramatic. These show further stress in the Real Estate sectors, and this has now spread beyond the Office & Industrial segment. The progressively larger negative balance for North American Nonlife Insurance is not dramatic, but probably reflects the impact of extreme weather. Diversified Industrials, again in North America, show a sharp decline – suggesting a slowdown in capital goods generally. South Africa Automobiles corroborates the risk indicators flashing red across the African index set (see next section). In the UK, stagnant transactions and falling house prices are starting to hit the Household Goods and Home Construction Sector.
Credit Risk Scores and Changes
Credit Risk Scores and Changes – Canada Farming tops list, more Asian indices appearing, CCPs still high, Africa remains heavily represented, European indices now more prevalent.
Credit risk scores shown below are a normalized combination of changes in PD levels, PD volatility, and high yield exposures.
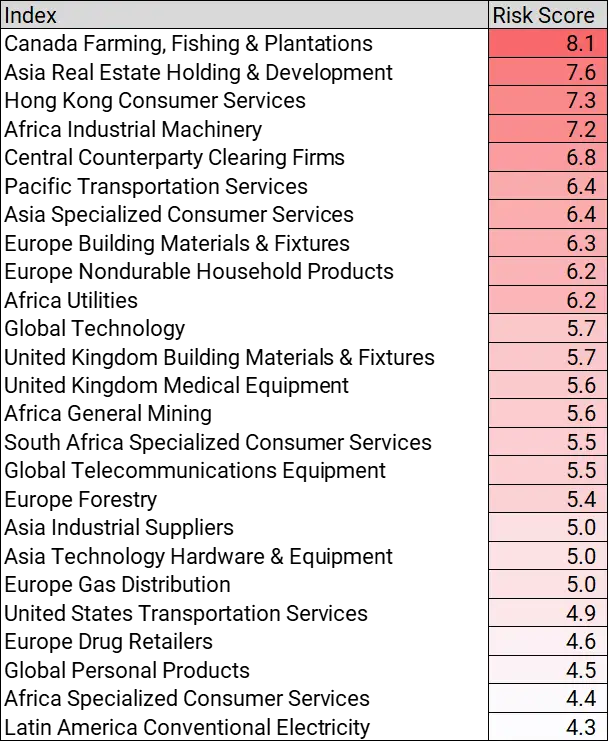
Canada Farming is top of the list. Compared with previous months there are more Global indices – Tech, Telecomms, Personal Products. There are more Asian credit indices, including Real Estate, Pacific Transport and Hong Kong Consumer Services. African indices are still heavily represented. CCPs remain on the list. There are more European indices than UK, suggesting that EU indices are seeing increased credit risk after the wave of deterioration in the UK.
Credit Risk Scores and Changes
Credit Volatility Stable to down – suggests larger companies may avoid worst of any 2023 default spike.
PD volatility is a leading indicator for upgrades and downgrades – if default probabilities are changing frequently, some of those moves will result in notch changes. The chart below shows the tail percentiles for default risk volatility, taken from the CB universe of more than 1000 credit indices, plus the CBOE Equity VIX. As the chart shows, large PD volatility spikes reflect economic stress, when notch changes are more likely to be downgrades or defaults.
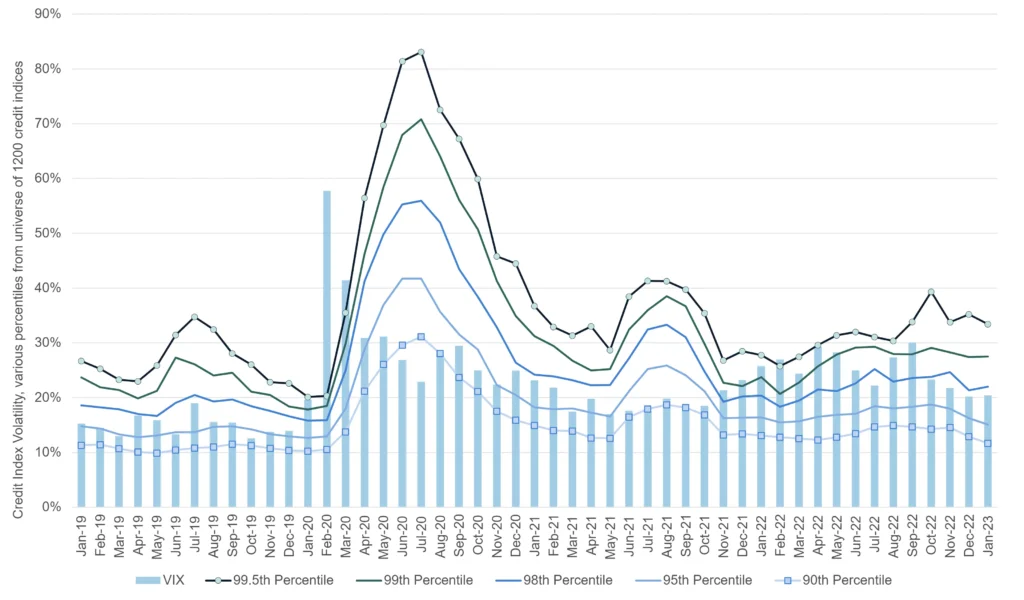
Similar to the VIX, credit volatility crept up in early 2022, but the Q4 downtrend continues. The 90th percentile is back to long-term lows, and the Equity VIX is also subdued. These metrics suggests that any hits to global profits and stress on balance sheets will be manageable, at least for the larger companies.
Featured This Month
US Sector PD comparisons: Consumer sectors deteriorating, some respite for higher risk tech sectors.
With economies and markets giving mixed signals, there is a lot of uncertainty about 2023 default rates. Some sectors are major winners (eg energy) and others (eg housebuilding) are facing a prolonged slump. There are also some major regional differences.
The table below compares average consensus default probabilities for a range of US sectors.
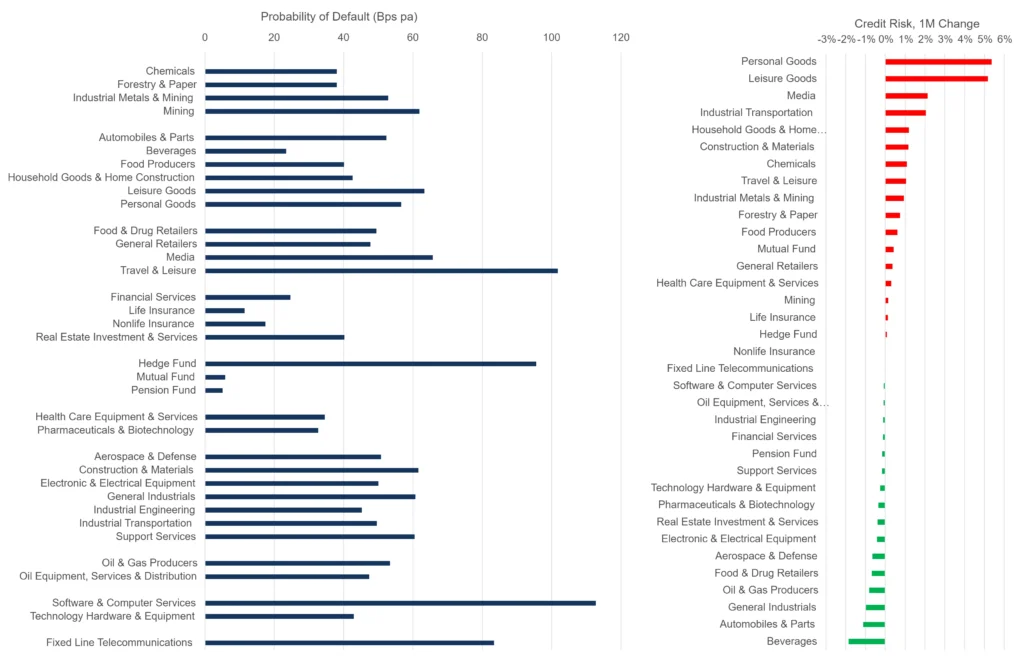
Financials and Funds – apart from Hedge Funds – are very low risk. Travel & Leisure, Software, Technology and Fixed Line Telecomms are highest in the 80 -120 Bps range. The mid range includes Mining, Media and Construction.
Large sector increases this month include Personal and Leisure Goods, Media, Industrial Transportation, Home Construction and Construction Materials, Chemicals, Travel and Leisure, Industrial Metals and Mining. Improvements include Beverages, Autos, Industrials, and Oil & Gas.
These trends are broadly consistent with retrenching consumer and the impact of higher interest rates on the housing and construction sectors. The improvement for autos is a surprise, but auto supply shortages may mean that pent up demand is only now being met.
In coming months, volatility metrics for these industries and sectors in each region will give a strong indication of future downgrades or default rates.
Leveraged Loans
Global downtrend paused, balance shifting to upgrades; but UK driving Europe deterioration.
Pitchbook report that the number of “weakest links” (S&P B- or worse with negative outlook or watch) in the Morningstar Leverage Loan index have started to tick up. They peaked at 18% in Q2 2020; they now stand at 8%, a 25% jump from 6% in Q3 2022.
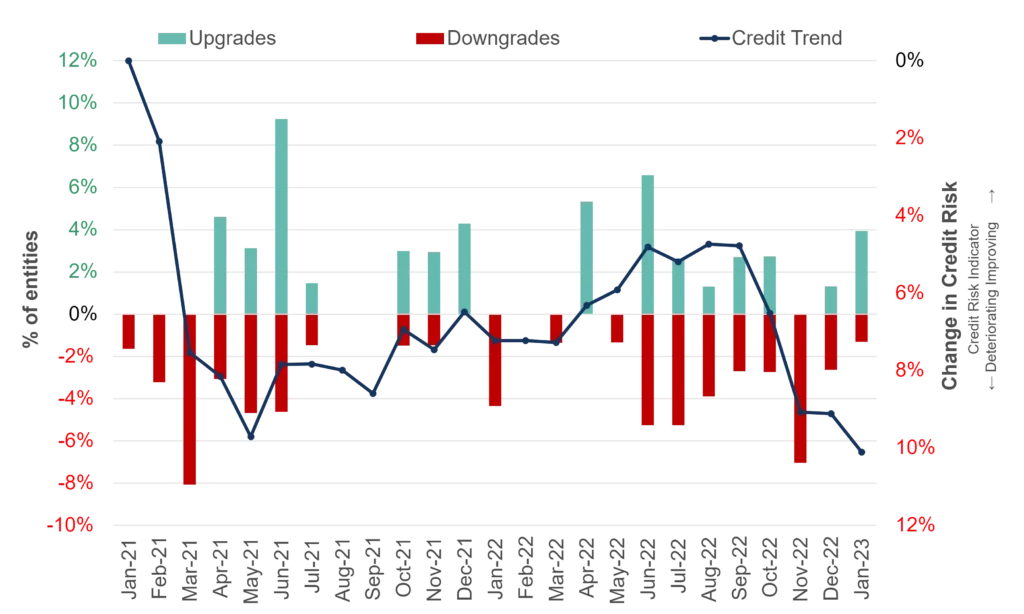
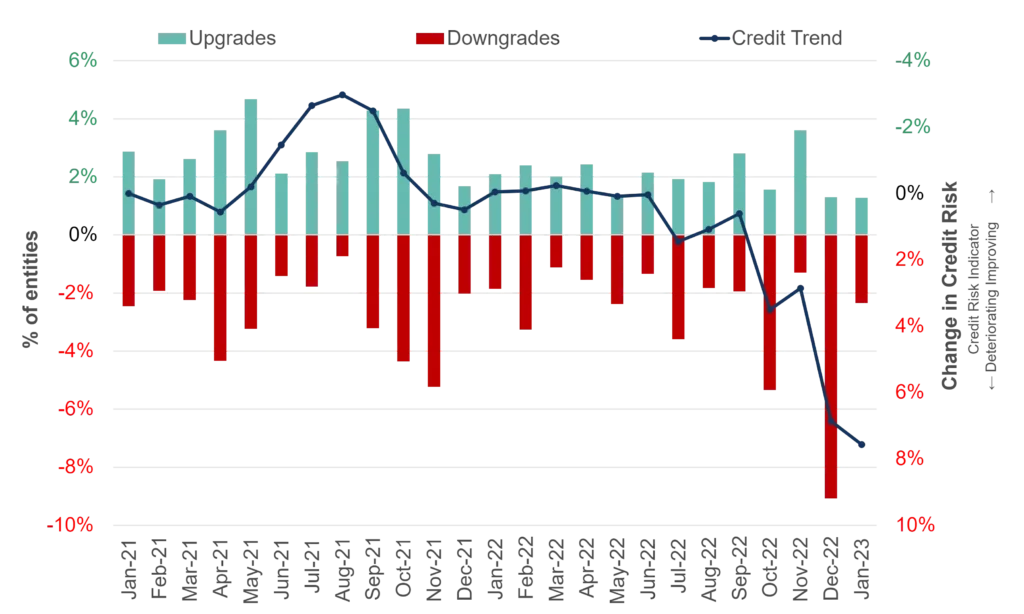
The charts below are based on two universes of Leveraged Loan issuers; the Global index contains 77 names from the Invesco Senior Loan ETF, with a US focus. The Europe index tracks 480 names, with a UK focus.
Global (US focus)
Europe (UK focus)
Leveraged loan fund holdings are generally sub-investment grade, although a minority of issuers may be rated higher by major banks. Global average PD has risen by over 10% after a decline in H2 2022; the balance is shifting to net upgrades.
But the European average PD – with a major UK focus – has risen by about 8%, and the upgrade/downgrade ratio is volatile, but trending towards downgrades.
In the Leveraged Loan sector, it is possible that a US/Europe gap is beginning to appear. The data here suggest that the UK Leveraged Loan sector is confirming the broader negative trend across European reported by Pitchbook.
Wage Inflation and Credit
Financial Services and Transport most at risk; Telecomms and Personal Products downgrades may be overdone.
Price inflation and labour shortages are pushing wages higher across many countries and sectors. The chart below plots the impact of wage inflation on profitability against Global credit risk changes over the past three months.
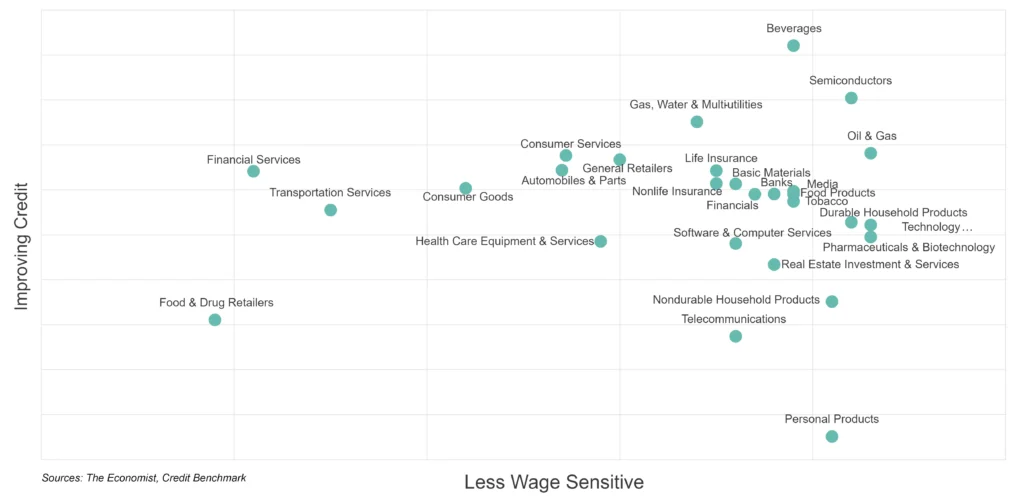
At the sector level, credit depends on debt levels, asset values as well as profit (i.e. equity) growth, so rising wages may be offset by lower input costs or growing sales. But unless these other factors are significant, the chart suggests that some labour-intensive sectors – like Financials Services – may see profitability and credit compromised over time.
At the other extreme, Personal Products, Non Durables, and Telecomms may be more robust in the face of wage inflation than recent credit assessments would suggest.
Renewable Energy vs Fossil Fuel
Renewables show major deterioration past few years, but credit tide may be turning in their favour.
The war in Ukraine means that energy security is now the key priority for most countries. Short term, this is good for fossil fuel companies who have reported record profits as global energy prices have spiked. Last year the UN gloomily reported that “…global energy transition the world had hoped for is simply not happening.” But the Economist shows that the war is now bringing forward the expected peak in CO2 emissions, due to immense investment in renewables in the US and Europe.
The Inflation Reduction Act (IRA) in the US includes an unprecedented list of clean energy incentives intended to accelerate the development of diverse, alternative and home-grown energy sources. Renewables have faced some major challenges in recent years, due to high development costs and still-nascent technology. But the war could be a critical turning point.
The charts below show relative credit risk and net upgrade/downgrade balances for 38 Global Renewable companies and 105 Global Oil & Gas companies.

Renewable Energy (38 entities)
Oil & Gas (105 entities)
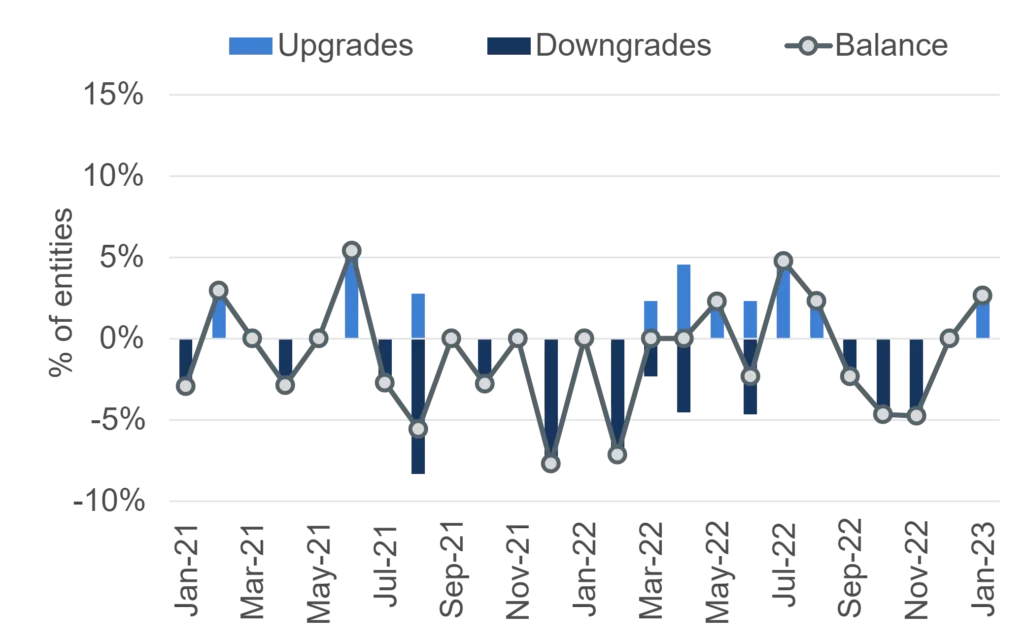
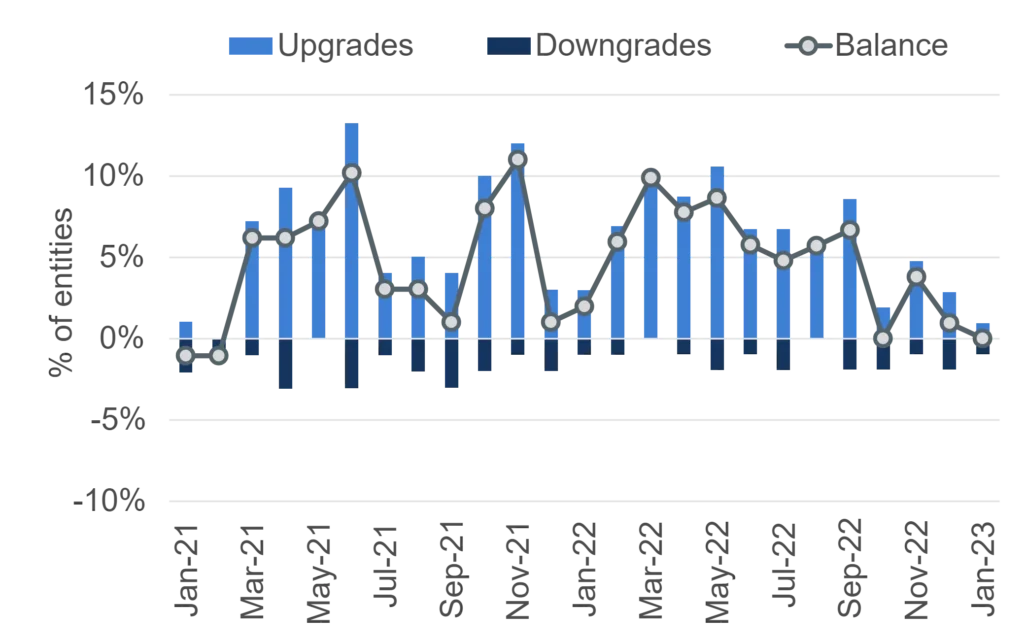
In the past two years, renewables show a credit risk deterioration of nearly 30%, while fossil fuel companies have improved by 50%; which aligns with the UN’s pessimistic assessment. But the net balance charts show that this is changing – recent months show increasing upgrades in renewables, while fossil fuel upgrades are fading.
Current global energy investment runs at $2trn pa, skewed to renewables. But from the perspective of energy security, the two types of energy have very different volatility profiles. Fossil fuel sources are reliable and easily adjusted; renewables like solar, wind, hydro and even bio are weather dependent. With no end in sight for the Ukraine war, all energy sources and technologies are likely to see an investment surge – to diversify sources and minimize overall supply volatility. Further credit upgrades for renewables seem likely.
The Excel chartbook containing all charts and underlying data from this report is available to download below:
1The CCI tracks the monthly net level of credit upgrades / downgrades for a given sector, based on the combined risk views of expert credit analysts at over 40 global banks. A CCI score of 50 indicates an equal number of upgrades and downgrades; over 50 is improvement; under 50 is deterioration.