Download full June End-of-Month Credit Update infographic below.
Credit Benchmark has released the latest end-of-month consensus credit data (from May 2020), based on the final and complete set of contributed credit risk estimates from 40+ global financial institutions. This final update takes into account the credit movements of ~26,000 separate legal entities.
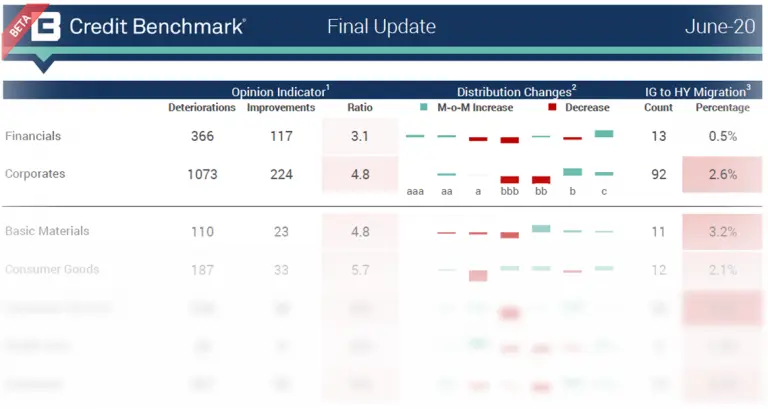
In the update, you will find:
- Opinion Indicator: Assesses the month over month observation-level net downgrades or upgrades.
- Ratio: Ratio of Deteriorations and Improvements calculated as Deteriorations / Improvements
- Distribution Changes: The increase or decrease in the percentage of entities in the given rating category
- IG to HY Migration: The absolute and relative movement from investment-grade to high-yield
Compared to the figures seen in our mid-month flash update, the final update shows:
- The bias towards deterioration flagged by the opinion indicator ratio has not changed drastically in either Corporates (4.8:1) or Financials (3.1:1)
- The opinion indicator marks the most impacted industries:
- There is a 7:1 deteriorating/improving ratio for Oil & Gas entities (up from 6.4:1 in the flash update). Though Oil & Gas has consistently performed the most poorly of the industries in recent updates, the ratio of deterioration is reducing.
- Consumer Services and Consumer Goods are both still among the industries most inclined to downgrade – the deteriorating/improving ratio for both groups is 6:1 and 5.7:1 respectively (down from 8.4:1 and 6.3:1 in the flash update).
- Telecommunications has shown a higher rate of downgrades compared to the flash update, with a 4.5:1 deteriorating/improving ratio (up from 2:1). Telecommunications was the only industry with a positive ratio one month ago, indicating that the pervading wave of Corporate downgrades has finally caught up with the group.
- The percentage of Investment Grade (IG) entities migrating to High-Yield (HY) increased for most of the industry cuts excepting Technology which remained the same since mid-month, as well as UK Oil & Gas in the sector cuts.
- Consumer Services again showed the strongest tendency to transition to HY with 5.8% of IG entities migrating (up from 2.9%).
- Travel & Leisure is still the most impacted sector with 10.1% of IG entities being downgraded to HY (up from 5.1% mid-month but lower than at May end-of-month, at 14.9%).
- General Retailers also fared poorly, with 6.3% of IG entities migrating to HY (up from 3.6% mid-month).
- Canadian Oil & Gas again showed no upgrades, and 24 downgrades, with 4.4% of IG entities in this group migrating to HY.
Credit Benchmark will continue to provide regular reports on these migration rates. If you have any questions about the contents of this update, please get in touch.