Download June intra-month flash update infographic below.
Credit Benchmark have released the intra-month flash update for June, based on a partial subset of the contributed credit risk estimates from 40+ global financial institutions.
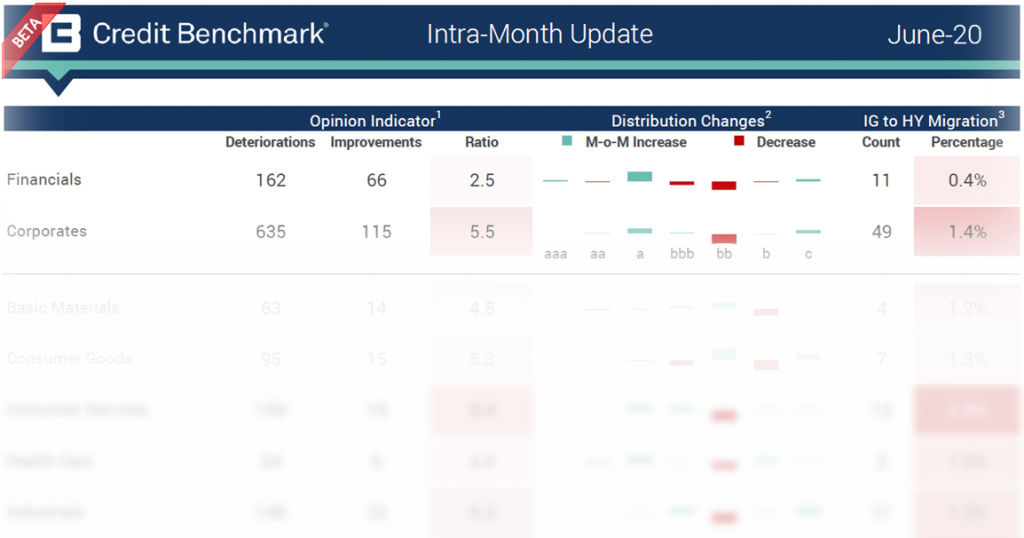
In the update, you will find:
- Opinion Indicator: Assesses the month over month observation-level net downgrades or upgrades.
- Ratio: Ratio of Deteriorations and Improvements calculated as Deteriorations / Improvements
- Distribution Changes: The increase or decrease in the percentage of entities in the given rating category
- IG to HY Migration: The absolute and relative movement from investment-grade to high-yield
Compared to the figures seen in the May End-of-Month Update, the June intra-month flash update shows:
- The rate of deterioration for Corporates remains fairly consistent (5.3:1 last update; 5.5:1 this update), but is slightly diminished for Financials – the ratio of deterioration to improvement flagged by the opinion indicator is now 2.5:1 (down from 3.2:1 last update).
- The opinion indicator marks the most impacted industries and sectors:
- Oil & Gas companies are starting to see some reprieve after weeks of downgrades. Though this group is still showing a negative ratio, the rate of deteriorations to improvements has dropped from 19.3:1 in the last update to 6.4:1 this update. This ratio still places the group as one of the worst affected industries.
- The industry with the most negative ratio this update was Consumer Services, with a 8.4:1 deteriorating/improving ratio (up from 6.6:1 last update).
- The sector with the most negative ratio this update was Travel & Leisure, worsening from the last update with a 21:1 deteriorating/improving ratio (up from 13.6:1)
- The positive trend for Telecommunications was short lived – this update sees the group back in negative territory, with a 2:1 ratio (down from 0.7:1 last update).
- Geographically, Canadian companies are performing the worst. Canadian Corporates and Canadian Oil & Gas firms both show a much higher ratio of deterioration to improvement than their US and UK counterparts.
Credit Benchmark will continue to provide regular reports on these migration rates. If you have any questions about the contents of this update, please get in touch.
For full details, please download the June intra-month flash update infographic here:
Download Flash Update