Download the End-October Industry Monitor infographic below.
Credit Benchmark have released the end-month industry update for October, based on the final and complete set of the contributed credit risk estimates from 40+ global financial institutions.
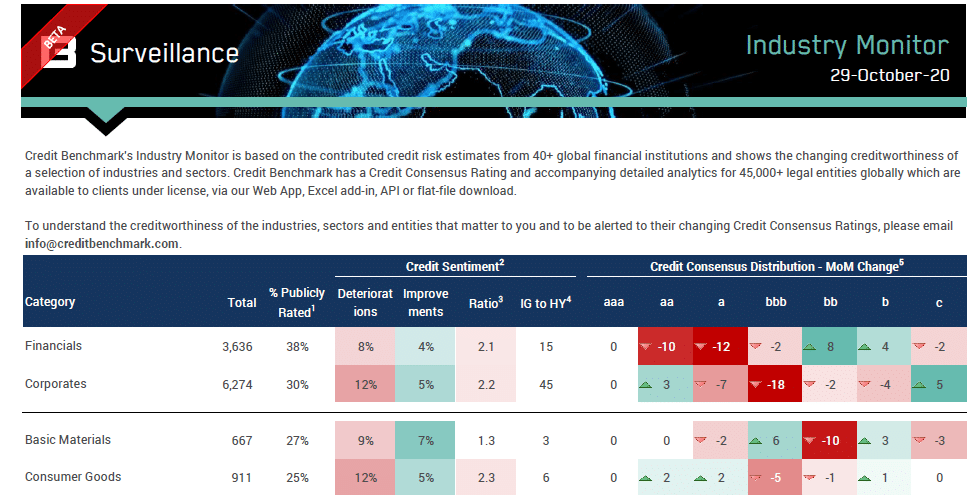
In the update, you will find:
- Credit Sentiment: Assesses the month-over-month observation-level net downgrades or upgrades, shown as a percentage of the total number of entities within each category.
- Ratio: Ratio of Deteriorations and Improvements in each category since last update, calculated as Deteriorations / Improvements
- IG to HY Migration: The number of companies which have migrated from investment-grade to high-yield since the last update (known as Fallen Angels).
- Credit Consensus Distribution Changes: The net increase or decrease of entities in the given rating category since the last update.
Compared to the figures seen in the September End-Month Industry Monitor, the October End-Month Industry Monitor shows:
- Financials and Corporates have both seen an improvement in their deteriorating/improving ratio since the last update (the ratio for Financials has dropped from 3.2:1 to 2.1:1, and the ratio for Corporates has dropped from 2.3:1 to 2.2:1). Both groups remain biased towards deterioration, however.
- All Industries showed a bias towards deterioration this update, however the severity was modest. The industry with the largest, or worst deteriorating/improving ratio this update was Oil & Gas (3.3:1, up from 2.7:1 last update).
- The industries with the lowest, or relatively ‘best’ deteriorating ratio this month were Basic Materials (1.3:1, an improvement from 1.6:1 in the last update), and Health Care (1.3:1, having worsened since last update’s positive ratio of 0.8:1).
- Within the sectors, UK Oil & Gas showed the highest rate of deterioration, at 10:1; a jump from last update’s ratio of 2.8:1.
- Travel & Leisure also showed high levels of deterioration, with a ratio of 6.1:1 (up slightly against last update’s ratio of 5.6:1).
- Corporates (45) showed a higher proportion of Fallen Angels (companies migrating from Investment Grade to High Yield) compared to Financials (15), and within the industries, Consumer Services showed the greatest proportion, with 14 companies dropping across the boundary. General Retailers and Travel & Leisure showed the highest proportion of Fallen Angels within the sectors.
Credit Benchmark will continue to provide regular reports on these migration rates. If you have any questions about the contents of this update, please get in touch.
For full details, please download the End-October Industry Monitor infographic here:
Download Industry Monitor