Download the End-September Industry Monitor infographic below.
Credit Benchmark have released the end-month industry update for September, based on the final and complete set of the contributed credit risk estimates from 40+ global financial institutions.
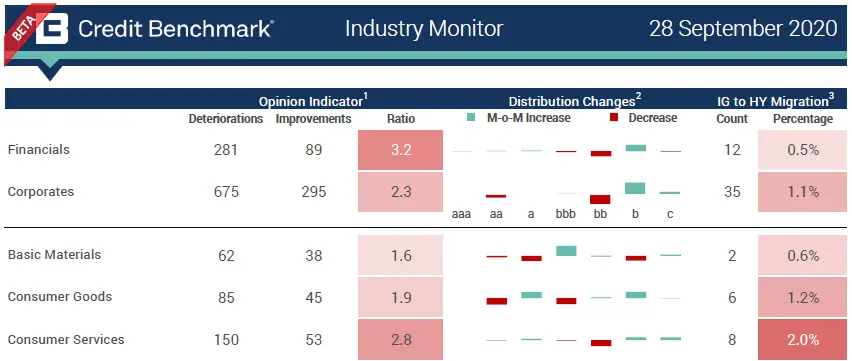
In the update, you will find:
- Opinion Indicator: Assesses the month over month observation-level net downgrades or upgrades.
- Ratio: Ratio of Deteriorations and Improvements calculated as Deteriorations / Improvements
- Distribution Changes: The increase or decrease in the percentage of entities in the given rating category
- IG to HY Migration: The absolute and relative movement from investment-grade to high-yield
Compared to the figures seen in the September Mid-Month Industry Monitor, the September End-Month Industry Monitor shows:
- The bias towards deterioration seen in the mid-month update worsened slightly for Corporates (2.3:1 deteriorating/improving, up from 1.9:1 in the last update) and more so for Financials (3.2:1 this update, up from 2:1 in the last update).
- There was little significant change in the deteriorating/improving ratios among the industries from mid-month to end-of-month. Of the industries, Telecommunications remained the worst performing industry, with a 4:1 deteriorating/improving ratio.
- All of the industries barring Healthcare (0.8:1 deteriorating/improving ratio) are dominated by deterioration this month, though the ratio for Utilities and Oil & Gas lessened in severity since the last update (Utilities show a 1.7:1 deteriorating/improving ratio, down from 2.4:1, while Oil & Gas has dropped slightly from 2.8:1 in the last update to 2.7:1 this update).
- Within the sectors, Travel & Leisure again tops the list of worst performers, with a 5.6:1 ratio (up from 3.8:1 in the last update). Canadian Oil & Gas continues to show high levels of deterioration at 4:1 deteriorating improving.
- The sector with the highest rate of Fallen Angels (companies migrating from Investment Grade to High Yield) is General Retailers, with 3.5% of all firms crossing the boundary. Amongst the industries, Consumer Services shows the most Fallen Angels, with 2% of companies crossing over.
Credit Benchmark will continue to provide regular reports on these migration rates. If you have any questions about the contents of this update, please get in touch.