
Many credit portfolio managers expect default rates – currently around 2% – to be sharply higher in 2023, but the scale of the increase is still a major unknown – pessimistic estimates range as high as 7.8% for US Corporates. The overall global observed rate across all credit grades has rarely been above 4% in the past 40 years.
A useful metric to anticipate rising defaults is credit volatility, measured by monthly percentage changes in default probability. If this trends higher, credit category transition rates will increase, including transitions into default.
Figure 1.1 shows various measures of credit volatility, calculated from more than 800 aggregates derived from bank Credit Consensus Ratings.
Figure 1.1 Credit Aggregates: Maximum and Average 6m Trailing Volatility
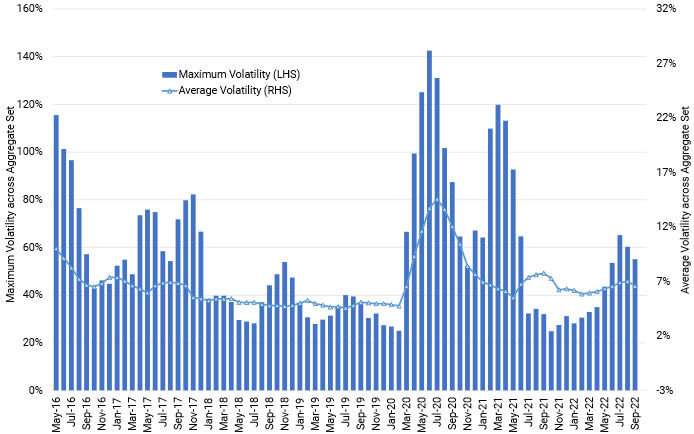
The average and maximum trailing volatility is increasing, although it is nowhere near the peaks seen at the during the main pandemic waves. But it implies more frequent credit transitions; and if increasing volatility is biased to higher risk estimates, it suggests that downgrades and defaults will also rise in coming months. This will be a critical metric in 2023.
Figure 1.2 shows a list of consensus-based aggregates chosen according to three risk factors:
(1) proportion of constituents in credit categories b and c
(2) percent change in default risk in the past month
(3) percent change in the 6m trailing volatility of the aggregate average PD.
These are normalised[1] and summed. The 50 aggregates with the highest score are shown in Figure 1.2.
Figure 1.2 Top 50 Aggregates Ranked by Combined Risk Indicator
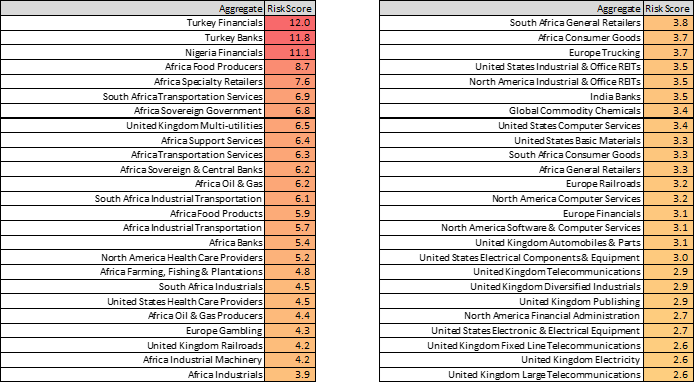
The list is headed by Turkish Financials, and the upper half is dominated by African aggregates, including the Sovereign / Central Bank aggregates.
UK, US and North American aggregates appear in the top half, including UK Utilities, North American Health Care, US Industrial & Office REITs.
Europe aggregates (which include UK) on the list include Gambling, Trucking and Railroads.
The UK features heavily in the lower half of the list, including Autos, Industrials, Publishing, Telecoms and Electricity.
The sectors on this list are the key ones to watch in coming months – these aggregates contain a high proportion of very high yield names, the aggregate is becoming more volatile, and the average risk level is rising.
[1] As z-scores i.e. (x(i) – mean(x))/stdev(x)

