
Tracking the Global Credit Cycle: Leaders, Laggards and Mavericks
Credit Benchmark’s consensus data history runs from 2016, spanning the China growth shock, pre-Covid monetary tightening, Covid and its aftermath, plus the recent rate hikes, inflation spikes and rising geopolitical risk.
These recent, dramatic economic cycles are reflected in major shifts in default risk estimates supplied to Credit Benchmark by major banks. These shifts can be tracked by the Deterioration-Improvement Net (“DIN”)[1] balance metric, a key driver of changes in transition matrices. The chart below shows this metric for a large number of credit consensus indices, split into deciles.
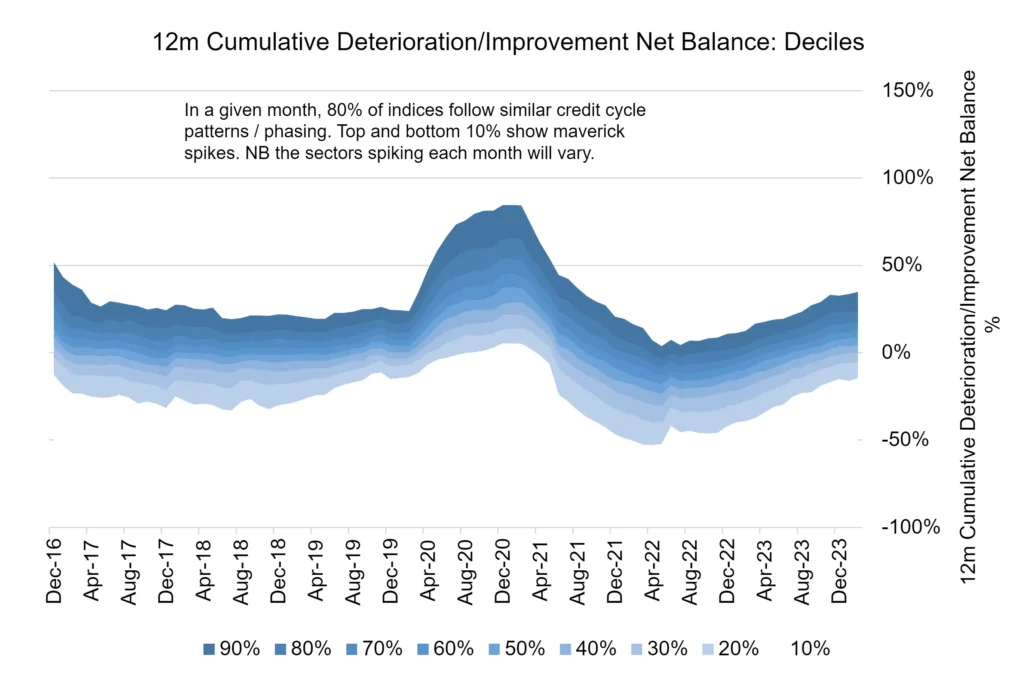
Across 1,200 credit indices[2], the chart shows the 10th to 90th percentiles of the 12-month cumulative rolling DIN for each month from end-2016.
In late 2019, for example, the deciles are tightly clustered, indicating that the pattern and scale of deteriorations and improvements across most sectors is very similar – in other words, the global credit cycle was highly synchronised and uniform.
The pandemic triggers a widening of the decile boundaries as they spike higher, with worst-hit sectors see waves of downgrades while others show limited impact.
Recovery from Covid in 2021 shows the decile bans dropping and tightening again, but rising rates and the Ukraine war have brought a fresh set of downgrades across most indices. Unlike the Covid phase, the percentiles do not show marked widening; so downgrades have been widespread, leaving few safe asset classes and sectors for credit portfolio managers.
Credit consensus default risk data shows a clear global credit factor. However, the timing and scale of individual sector responses to changes in the macro environment shows significant variation over time.
In each credit cycle phase, some sectors will lead or lag, but the majority will move as a group. No two cycles are identical, but Global sector data for the period 2016-2023 show some clear leaders, laggards and mavericks.
To identify sector lead/lag signatures, each Global industry and sector index is compared with the Global Corporate index. Correlations are calculated across the whole 2016-23 period, with three time shifts: (1) 6 month lead (2) no lead or lag (3) 6 months lag. The table below shows the industries and sectors with significant patterns:
| Leading sectors: Correlation with 6-month lead vs. Global Corporate Index is higher than no lead or lag. | Proxy sectors: Correlation with no lead or lag is higher than lag or lead correlation. | Lagging sectors: Correlation with 6-month lag vs. Global Corporate Index is higher than no lead or lag. |
| Building Materials & Fixtures Computer Hardware Drug Retailers Durable Household Products Electronic Office Equipment Farming, Fishing & Plantations Fixed Line Telecommunications Food & Drug Retailers Food Producers Food Products Forestry & Paper Furnishings Gold Mining Leisure Goods Pharmaceuticals Pharmaceuticals & Biotechnology Semiconductors Software Technology Hardware & Equipment Telecommunications Telecommunications Equipment Tobacco |
Computer Services Distillers & Vintners Electrical Components & Equipment Electronic & Electrical Equipment Financial Services Gas Distribution Gas, Water & Multi-utilities General Mining Health Care Health Care Equipment & Services Heavy Construction Hedge Fund Industrial Machinery Investment Services Marine Transportation Mining Mobile Telecommunications Multi-utilities Nondurable Household Products Nonlife Insurance Paper Real Estate Investment Trusts Software & Computer Services Systemically Important Banks Tires Venture Capital Fund |
Aerospace & Defense Airlines Beverages Brewers Clothing & Accessories Containers & Packaging Diversified Industrials General Industrials Hotels Industrial Suppliers Iron & Steel Platinum & Precious Metals Railroads Soft Drinks Travel & Leisure |
Leading sectors are typically the first to show a credit improvement when macro conditions turn positive – Building, Hardware, Consumer Durables and Furnishings, Food, Pharma, Software, Tech and Telecom. Proxy sectors include Utilities, Healthcare, Heavy Construction and Machinery, Mining, Transport, various Services. Lagging sectors are more discretionary spending focused – Airlines, Clothing, Hotels, Beverages, Railways.
Most of these are intuitive but credit consensus data can show the latest DIN behaviour for each of these sectors – so that credit portfolio managers can finesse the timing of exposure adjustments and have some warning of when the traditional pattern is changing.
Some detailed examples following:
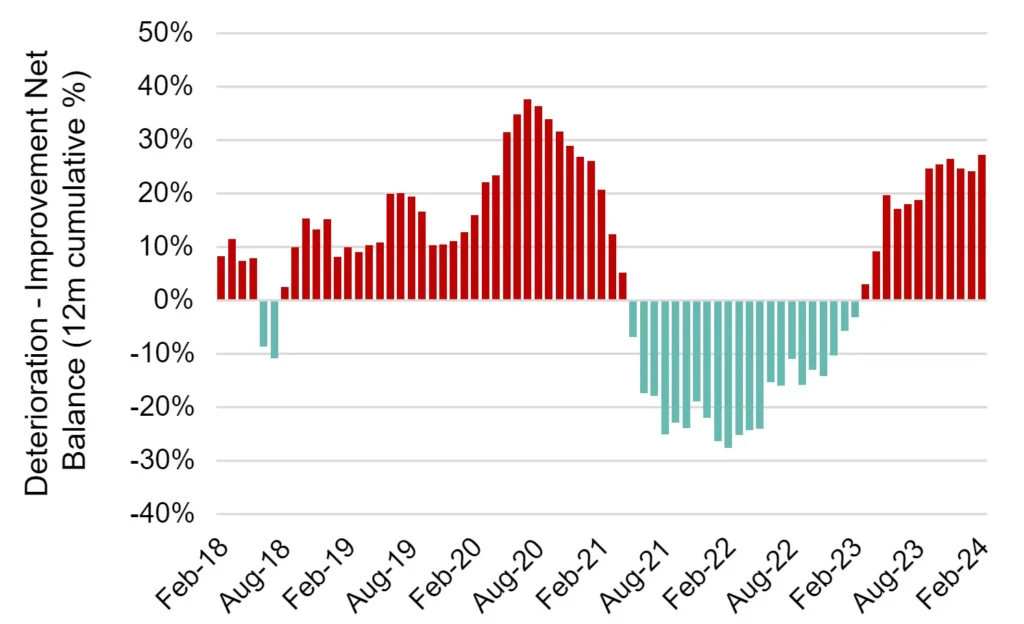
Lead: Global Farming, Fishing & Plantations
This sector was clearly in trouble in 2018 and 2019 as Deteriorations outweighed Improvements in nearly every month of that pre-Covid period. Covid pushed the 12m rolling DIN to a peak of close to 40%, but recovery was rapid as supply chains reformed in early 2021. War and tighter money began to bite in early 2023.
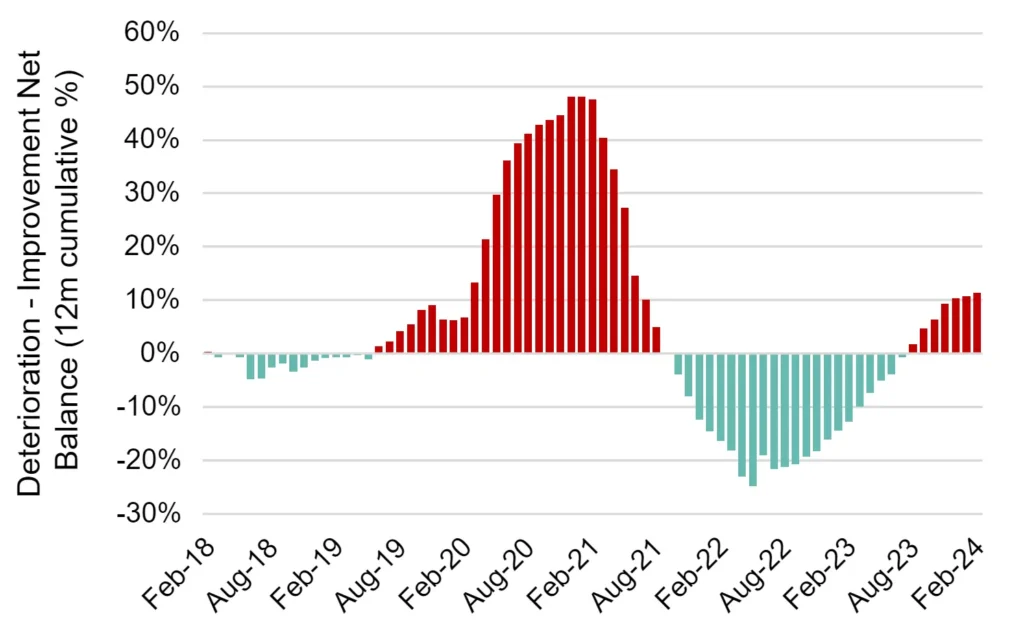
Main cycle: Global Corporates
The pattern is repeated for many of the proxy sectors. It is worth noting that deterioration began in early 2019, as Central Banks attempted to tighten monetary policy and normalise interest rates. The DIN reached 50% during Covid, and has only recovered about half of that during the recovery phase that began in mid 2021. The return to Deterioration set in during summer of 2023.
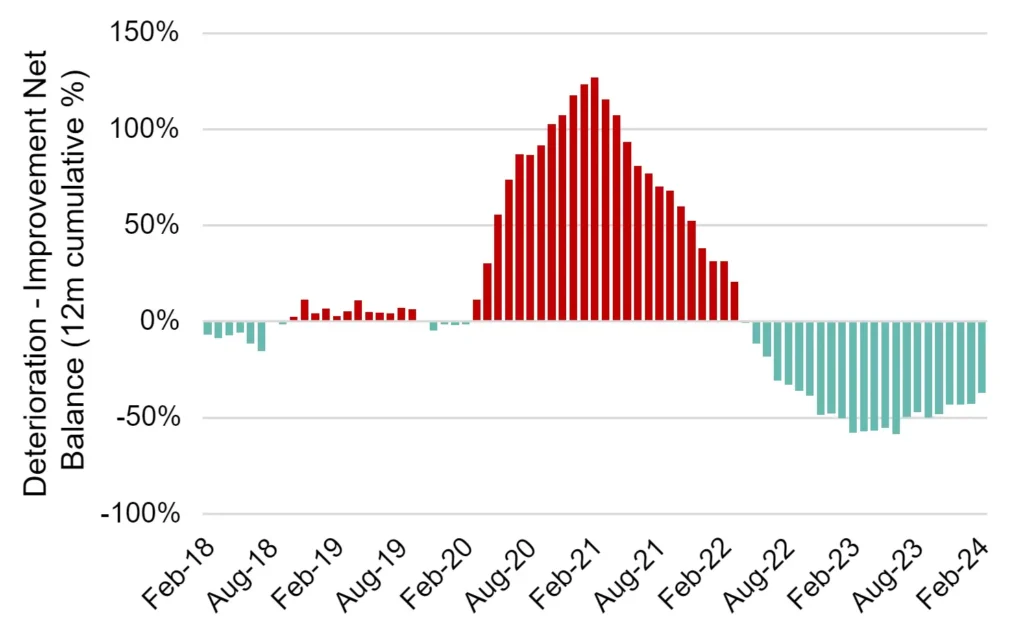
Lagging: Global Hotels
The sudden and catastrophic effect of Covid on this sector is clear, with the 12m DIN metric reaching more than 120%. Recovery also came late but was also large, reaching more than 50% balance towards Improvements. Unlike most sectors, the 12m DIN for Global Hotels is still in the net improvement zone; it looks unlikely to swing back to Deterioration for another 6 to 9 months.
Some other sectors (e.g. Mobile Telecoms and – reassuringly – Global Systemically Important Banks (GSIBs)) are mavericks, following their own internal credit dynamics. Some (e.g. Basic Materials) are leaders AND laggards, probably because their constituent companies range from early to late cycle suppliers.
These metrics are now being used to model transition matrix changes, with the credit cycle progressively shifting the balance of migrations from the upper right triangle (downgrades) to the lower left (upgrades). This gives credit portfolio managers detailed visibility of the likely future credit profile for each sector exposure.
Similar analyses are available for all 1,200 indices in the Credit Benchmark universe. Get in touch if you want to see this analysis for your sectors of interest or to discuss the wider implications for credit portfolio risk management.
Download
Please complete your details to download the PDF of this report:
[1] This captures ALL movements in default risk estimates, not just the credit category upgrades and downgrades. The net difference is normalised by the number of index constituents and can be updated intra-month.
[2] These cover various types, regions, countries, industries, sectors and subsectors.