
Equity markets used to ignore credit risk, but COVID has changed all that. There is a growing demand to understand corporate and financial credit risk at all levels, from single issuers and corporate families to sectors, industries and countries.
How far do equity market movements reflect credit developments during the COVID crisis?
Figure 1 shows S&P equity sector index changes since the pre-COVID peak in February, and the corresponding credit risk changes over the same period.
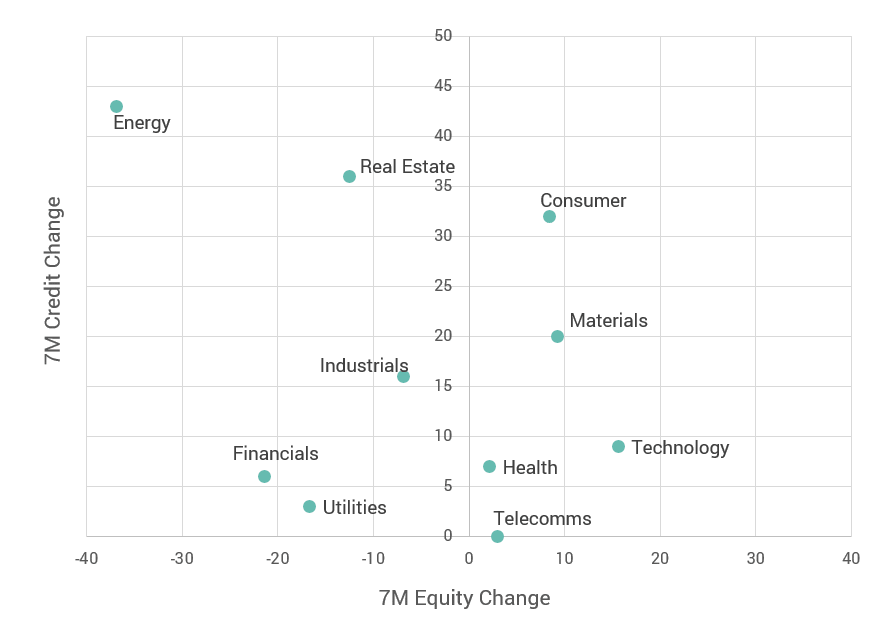
This shows a loose negative relationship between credit risk changes and equity performance, but this is largely driven by the Energy sector with a near 40% decline in value and a credit risk increase of a similar magnitude – which represents, on average, a full notch downgrade for the sector constituents.
Other date ranges during the COVID crisis show a very similar pattern – so the rankings of equity performances and credit risk changes over the period have both been remarkably stable.
In this simple scatterplot, credit changes only explains a small percentage of the equity sector performance differences. Clearly, equity performance is still mainly driven by the earnings or M&A outlook. But with the increasing importance of credit in the current environment, this chart highlights some potential anomalies:
Some of these sectors will be influenced by rumours of M&A activity, and individual firms may be receiving forms of temporary state support (through furlough and credit facilities). These factors will account for some of the anomalies discussed here, but the chart suggests scope for some dramatic equity value adjustments in the near future.

