
2023 has set multiple climate records. Polar ice and glacier thickness are at new lows, while droughts, wildfires, floods and landslides are at all-time highs.
Climate change effects are being felt in every country and every industry. Global trade is being disrupted, land use patterns are shifting, people are migrating and their habitat is changing. Technology offers a huge range of potential solutions, and spiking prices for food, viable real estate, and primary resources are beginning to attract the necessary capital. The challenge to address climate change is essentially a race against time.
In this report we look at various countries, industries and sectors that are positively or negatively affected by climate change. We review the distribution, dynamics and trends of default risk, and compare them with other stress (and success) indicators.
Greenhouse gases (GHGs) – especially carbon dioxide and methane – are the main drivers of climate change. While sunlight penetrates these gases to enter the atmosphere, the resulting heat is trapped by GHGs, triggering various chain reactions that manifest as extreme weather events. From among these, drought is possibly the most consequential: if current trends continue then the world could run out of fresh (i.e., not salty) water very soon. This is not a new phenomenon; it was raised over 100 years ago.
Possible solutions fall under the two broad headings of (1) reducing emissions and (2) capturing emissions and scrubbing GHGs from the atmosphere via greening and technology with tax/market incentives. On the supply side, emissions reductions involve shifting production to renewables via tax incentives and corporate ESG naming-and-shaming. On the demand side, reducing emissions requires scaling back consumption via market prices, carbon trading, tax incentives, altruism.1
Some of these solutions are already being implemented with varying levels of political and social support. The pace of implementation is likely to accelerate for the simple reason that current non-renewable sources will start to run out in about 50 years (except coal, which has over 100 years to go). But fresh water (only about 2.5% of the otherwise salty world total) is set to start running out in some areas in about 20 years, unless we collectively recycle waste water or find a cost-effective and sustainable method for mass desalinisation.
Panic about climate change has resulted in some significant misallocations: electric vehicles do not burn fossil fuels directly, but power needs to be generated somewhere and somehow. The greater weight of electric cars vs traditional fuel-guzzling cars damages roads and structures. Also, EV batteries are fire-risks, and battery production needs rare minerals, especially lithium. Renewables – like wind and wave power – can be unreliable. The trade-off is a more volatile but less environmentally unfriendly energy source. And extreme weather due to climate change effects may increase that volatility.
Russia’s invasion of Ukraine has revitalized the fossil fuel industry,2 and higher energy prices have transferred income to energy companies and fossil-fuel-rich nations. For Middle Eastern countries this is an opportunity to modernise and diversify their economies, but the resulting political realignments have opened some old and bitter wounds.
Heated debates on this topic revolve around responsibility: should large fossil fuel producers – countries and corporates – take bigger steps to diversify their energy sources? The E in ESG has focused on corporate activity, but should consumers with the largest GHG footprint scale back? It has been estimated that if every human lived like an average G7 citizen, the emissions impact would be equivalent to the world population growing from its current 8bn to an unsustainable 100bn. Without major technological advances, climate change means that development for all is no longer an option.
Adjustments will need to be seismic and market prices are already adjusting. All costs are rising because of wars, Covid, and de-globalisation. Climate change is also driving up prices for water, energy, home insurance, food prices, as well as for real estate in low-impact countries. A free market enthusiast might argue that these price adjustments will solve the problem; they will certainly bring windfall gains and losses. Free-market sceptics also see solutions, but they would need global taxation agreements to succeed.
Despite some ingenious technological proposals,3 most scientists involved in these real projects agree that there is no substitute for decarbonization – i.e., produce less and capture emissions.4
But the environment has become fully politicized. The debate has moved far beyond climate denial: it is now about advanced vs developing world reparations and mass migration. Conflicts that are flaring up around the world – Ukraine, Israel, Sub-Saharan Africa – are partly driven by increasing competition for scarce resources. The good news from the IEA is that the world shift to clean energy is now unstoppable. The timing is the issue.
An analysis by the World Economic Forum based on 135 countries suggests that climate change could cost 4% of global GDP by 2050. WEF estimate that over 60 countries could have their credit ratings cut by 2030 as a direct result.
WEF analysis by region (see chart below) shows that low-income countries stand to lose a greater proportion of their GDP due to climate change, especially as a result of physical events.

Source: World Economic Forum, S&P Global, World Bank
South Asia is most exposed, followed at some distance by Central Asia, the Middle East (where the current energy price windfall gain may help) and most of Africa.
The growing number of immigrants from the global south heading for north western Europe may partly be a symptom of the social and political instability caused by climate-related famine and disease – indeed, in the past two years there have been multiple military coups in sub-Saharan Africa.
Top producers of carbon dioxide and methane emissions are China, US, India and Russia. Russia and the US are proportionally much heavier polluters before allowing for any GHG offsets, although the US is not far behind the EU in the rate of its emission reduction.
Country Per Capita Fossil CO2 Emissions

Source: Statista
If carbon capture is a key part of the solution then the existing carbon trading market could show exponential growth – which would benefit financial institutions and exchanges.
Pre-COP28 meetings have exposed deep divisions between rich and poor countries. While COP27 in 2022 had some successes, many of the most adversely affected nations need far more financial help than has been promised and the pledged “loss and damage” funding may be at risk.
Adverse climate change hits economic growth in multiple ways: for example, the Panama canal will halve the number of permitted sailings this winter due to drought-induced low water levels. Such widespread impacts on global trade bring fiscal strain, increasing political instability and net emigration from the worst-hit countries.
The charts below show recent sovereign default risk trends.
% Balances Between Improving and Deteriorating Companies

Credit Trend: Sovereign & Central Banks

Across all sovereigns, the bias is currently towards improvement, although the majority have experienced some negative trends over the past 12 months.
Africa in particular has suffered, with a 15% increase in average default risk over the past year. Africa suffers disproportionately from climate change: it is responsible for less than 10% percent of global greenhouse gas emissions, and is least able to cope with the negative impacts of climate change.
Credit Trend: Corporates

Positive and negative impacts extend beyond sovereigns. The chart on the left shows that recent energy price spikes have been good for corporates in the Middle East, but corporates in Africa are mirroring the deterioration in sovereign default risk.
Climate change has made food more scarce and more expensive, but food consumption patterns and production practices are part of the problem. There are major regional variations: the US is one of the world’s largest beef producers, but modern farming techniques mean that beef from the US contributes significantly less to carbon emissions than, for example, South East Asia.
Erratic weather, temperature shifts and rising sea levels are a growing threat to global food production, with food security exacerbated by more frequent armed conflicts and supply chain challenges. Prices for some food types have more than doubled in the past few years. Some companies in the food chain have recorded higher profits as a result, but most have struggled in the face of rising costs.

The chart on the left covers a universe of 32 food producer credit indices, tracking the proportion with net credit upgrades.
This proportion has been declining in recent months and currently sits well below the neutral 50% line – and it has been below this line for most of 2023.
The next set of charts show geographic trends among food producers for 2023. The deterioration was particularly evident in Canada, UK/Europe and Africa.
Credit Trend: Global, US, Canada, Latin America, UK, Europe, Asia and Africa Food Producers


With climate change reducing arable acreage, there is increasing focus on higher food yields. Modern fertilizers are dependent on phosphorus, which is likely to run out in about 40 years. Alternative sources include seaweed, bonemeal and animal waste – each with their own carbon emissions footprint and cost profile.
But as with fossil fuels, the Ukraine war has brought a spike in phosphorus-based fertilizer prices, boosting profits and credit.
The following chart shows the trends in credit rating upgrades and downgrades as well as the aggregated probability of default (PD) for 13 fertilizer companies, including household names such as Mosaic Co, Nutrien Ltd, CF Industries and more.

The chart shows a sustained improvement in creditworthiness from early 2022, although the second half of 2023 shows a deterioration and plateauing in the improving trend. Farmers have made some adjustments to reduce their dependence on Ukraine, but the negative effects have been significant (see Africa trends in the Sovereign and Macro Corporates section above – fertilizer and food issues are one of the main drivers).
NB: The Fertilizer index plotted here is an example of portfolio metrics that Credit Benchmark can provide for bespoke company lists. Contact us for a Default Risk report on your own portfolio.
An ideal COP28 outcome would be for all countries to commit to net-zero and to implement it quickly. But transition is fraught with challenges, ranging from materials shortages for sustainable energy technology (such as lithium for car batteries, copper for various applications) and efficiency issues (such as with heat pumps). And in the meantime, populations still need to heat their homes and travel to work. Fossil fuel supplies are reliable, flexible and easily available; while renewables like solar, wind, hydro and even bio are at the mercy of the ever-changing weather. Even when renewables are cheaper, the volatility discount is a major obstacle to full transition.
The Ukraine war has put a premium on energy security, which is now just as important as sustainability for many countries. Diversity in energy sources is increasingly important – not just to navigate the security-sustainability trade-off, but also to handle variations in yields from alternative energy sources. Research into superconductivity offers the prospect of a costless transfer of energy allowing those with a surplus to immediately supply those with a deficit.
Despite the recent adverse trends, the current credit distribution (below left) shows that renewables companies are on average better credit risks than traditional oil & gas companies.
Credit Distribution:

Credit Trend:

Renewables companies are clustered in the centre of the scale, with most firms in the bbb credit category. Oil & gas companies are more evenly split between bbb and bb. However, the renewables sector has a higher proportion of its entities in the risky c category.
The chart on the right shows the Ukraine impact: while renewables benefit from better credit quality, recent credit trends have been pulling them in the opposite direction.
Over the past two years, renewable credit risk has deteriorated by close to 20%, whilst traditional energy has improved by nearly 40% – creating a large gap between these two opposing groups of energy providers.
“Is your journey really necessary?” Probably not, but we all love to travel and so many economies are now dependent on tourism. The travel sector is facing a head-on collision between consumer-led demand and climate-constrained supply.
Covid encouraged staycations and working-from-home reduced the global commute, and neither of these has fully reversed. But air passenger numbers are still growing, doubling in 2023 to 80% of their pre-Covid level.
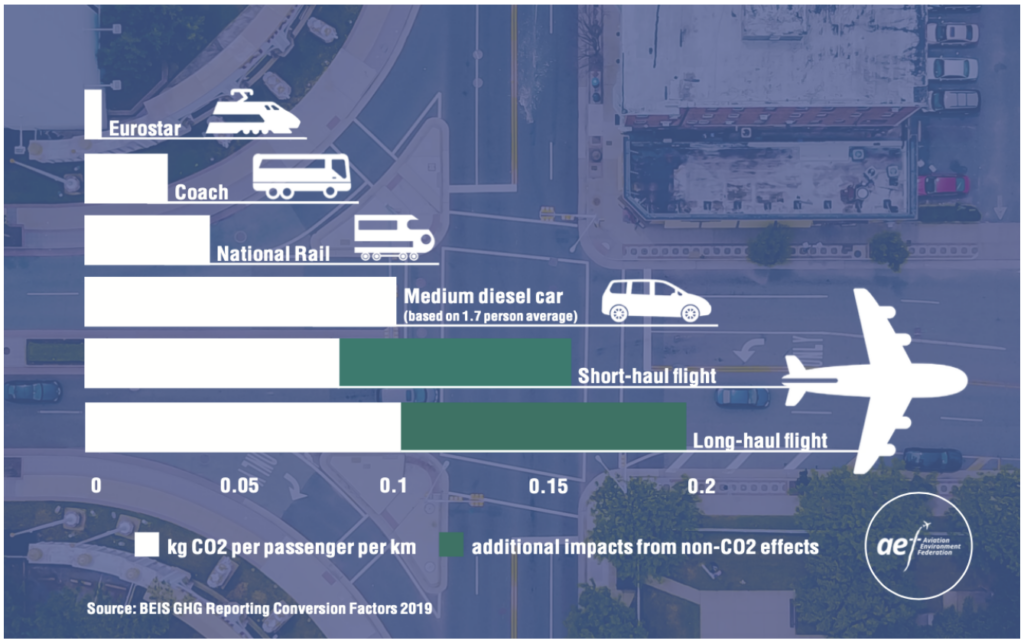
Source: BEIS GHG Reporting Conversion Factors 2019, Aviation Environment Federation Ltd
As the chart on the left shows, aviation is the most carbon-intensive travel mode.
If unmitigated, aviation emissions could more than double by 2050. Airlines are exploring sustainable aviation fuel, but this will push up costs. The era of high volumes and low ticket prices may be ending – with knock-on effects for aerospace and airport sectors.
More broadly, the anti-tourism backlash is growing. NYC has banned AirBnB, more cities are imposing “tourist taxes”, while protests target second home owners and private jet users. Blogs describing the impact that cruise ships have on ocean pollution and GHG levels are accompanied by advertisements…for cruises.
Improvements & Deteriorations: Travel, Hotels & Airlines, etc.

The chart on the left shows that default risk in the airlines and hotels sector is decreasing, and they are the main driver of the broader improvement in the global travel and leisure sector.
Growing awareness of climate change led to an early boom in ESG-driven investment. However, this trend has slowed with concerns about financial risks, green-washing, disappointing recent investment returns (fossil fuels outperformed in recent years) as well as various limits to the scope for profit-driven private corporates to solve climate change without major shifts in consumer demand patterns.
But bank regulators are addressing the more practical issue of physical transition risk – namely, how does climate change affect bank balance sheets? And if banks factor climate change into their lending decisions, commercial and retail credit availability could shrink dramatically in some sectors. Side effects may include the red-lining of mortgage availability in flood plains, businesses that cannot afford to relocate, and lender reluctance to make long-term loans. There is also a risk of a climate-related term premium, with long-dated finance potentially becoming more scarce as climate uncertainty grows.
Credit Trend: Banks

Consensus data on banks has been mixed, improving during Covid. But the chart on the left shows recent deterioration – especially in North America, albeit largely due to the SVB collapse.
Climate change risks have so far not affected global bank credit. Over the past few decades, banks have proven to be highly innovative and may yet benefit from trading in financial mitigants to climate change.
Carbon trading with certified physical implementation, climate change options, water trading – anything that can be hedged or brokered is potentially part of a solution.
According to the World Bank, 23% of the world’s emissions are now covered by carbon credits, up from 5% in 2010. This is good progress, especially since a growing list of countries are adopting this approach.
Insurance companies also face a growing climate challenge. Household and business claims for fire and flood damage and insurance rates are rising.

The table above shows recent default risk changes for selected insurance credit indices across various geographies. (Positive % change in PD means increasing default risk.)
Recent months show some modest credit deterioration in the life insurance sector, probably due to rising interest rates.
NB: This is an example of a Credit Indices Dashboard, which can be tailored to bespoke indices. Contact Credit Benchmark for more details.
Commercial real estate has not recovered from the pandemic, and hybrid working looks like a permanent feature. Repurposing office blocks as residences or vertical farms is costly, and hollowed-out cities mean a lower municipal tax base.
Warehouses are proliferating and growing in size as home deliveries eclipse bricks and mortar retail, while residential building will benefit from the 15-minute town concept. Land prices are likely to shift – with areas that are less affected by climate change likely to increase in value. This will produce windfall gains for some.
Credit Trend: Real Estate Investment Trusts (REITs)

*83% of Global REITs are US
US REITs are under increasing pressure from stakeholders to invest in green properties, which are broadly defined as energy-efficient buildings that minimize the impact on the environment and human health.
However, warning signs continue to flash in the US CRE market, with rising rent arrears and defaults.
The office sector is worst affected by the persistence of hybrid working.
The impact is concentrated in cities like tech-hub San Francisco, or more generally among older properties in cities like Washington DC and New York. However, it is these old offices that are the least eco-friendly, requiring the most water, fossil fuels, and other natural resources to support their daily operation.

The chart on the left compares the PD (Bps) of Sep-21 vs. Sep-23 across US REITs credit indices.
Over those two years, all US REITs credit indices show credit improvement, apart from industrial and office REITs and diversified REITs. US industrial and office REITs PD has deteriorated by a staggering 45%.
Credit Distribution: Real Estate Investment Trusts (REITs)

The current consensus credit distribution chart on the left shows that the majority of US REITs are investment grade, with over two-thirds in the a and bbb categories.
US industrial and office REITs has a higher portion of entities in a and bbb than the main index, contributing to its current lower PD (Bps).
Technology is not clean. Discarded plastic, rare earth mining, lithium land grabs (e.g., Nevada), and the generation of energy to run the internet as well as billions of devices – all take their toll. The energy required to mint now orphaned NFTs is equivalent to 2000 homes or 3500 cars.
But technology is likely to be critical in the race to solve climate change. AI is already being used to measure changes in biodiversity and is likely to play a major part in tracking the detailed impacts of climate change.
With other use cases appearing exponentially, AI has triggered an investment frenzy. And despite concerns that it will consume the energy equivalent of a small European country, AI may more than pay for itself via better climate modelling, supply chain efficiency, pandemic management, maximising GHG capture, carbon and methane offset trading, and optimal renewable design.
Credit Trend: AI vs. Technology

Credit trends suggest that AI’s contribution will outweigh any costs.
Indeed, since 2022 a significant gap has opened up with global AI firms showing a steady default risk improvement compared with broader technology companies.
Please complete your details to download the full COP28: Climate Change Winners and Losers in the Default Risk Landscape whitepaper:

