Significant Risk Transfer volumes continue to grow, and are dominated by synthetic transactions where the bank retains ownership of the underlying assets.
Financial markets are most successful when there is transparency over risk and pricing, but full disclosure is not always possible for an SRT trade. This does not prevent deals, but it requires both sides of the transaction to balance risk and return across a range of dimensions. These include the geography, industry and credit category of the underlying borrowers, plus lower limits on the number of independent loans in the reference pool.
Consensus default risk data is useful for most types of transactions to finesse risk and optimise returns. The diagram below is just one of the most common structures.

Example: Using Consensus Default Risk estimates to optimise SRT transactions for both sides.
Offered Asset Classes: North American, European and Asian Medium to Large Corporates (including some REITs), plus 10% in Latin American Corporates. Underlying borrowers undisclosed.
The table below shows recent correlations between these asset classes, based on monthly % changes in default risks.
Volatilities and Correlations Between Monthly Default Risk Changes, Past 18 Months

Based on these estimates, the investor concludes that while the US Real Estate Funds appear to offer strong diversification (most of the correlations are negative) they have also been very volatile (2.4% per month, even higher than Latin American default risk volatility). If the investor also has a negative outlook for Real Estate Fund credit over the duration of the trade, they may reject this exposure or they may negotiate for specific LTV criteria and sub-sector exposures.
Since credit consensus data supports more than 1,200 indices, this type of transaction can be further analysed; for example the North American portfolio can be analysed by country and industry / sector and the historic analysis period can be altered to suit the transaction duration and the expected credit environment.
Even if borrower names are undisclosed, the large credit consensus coverage of more than 100,000 single names gives the investor an indication of the credit distribution across the sector as well as the range of default risk estimates making up each consensus estimate.
For example, the chart below shows the credit distribution for US Telecoms:
Credit Level: US Telecoms

While some borrowers in the US Telecom sector are still in the a category, the majority are non-Investment Grade and the single largest group is the b category; while more than 5% are in the c category. This chart alone might prompt an investor to seek further finessing in the trade.
In disclosed portfolio transactions, Credit Consensus Ratings (“CCRs”) for single borrowers provide investors with an unbiased view of the inbound portfolio and allows for monitoring of the collected portfolio. In particular, investors can compare the credit distribution (see below) of current and proposed portfolios, in their own credit scales as well as the classic 21-category format for comparison with external quotes. The chart below shows a detailed comparison based on individual CCRs. (Red dotted lines show differences of more than one notch).
Client vs CB Rating Comparison

Banks can leverage similar analysis based on detailed CCRs, but without the need to divulge individual entity ratings. Comparative credit distribution analysis allow them to demonstrate the efficacy of their underwriting standards.
For undisclosed transactions, banks can demonstrate how internal pool ratings compare with the market, again without divulging either entity specific detail or ratings linked to specific entities, providing a clear and tangible quantification of the efficacy of bank underwriting standards.
Like-for-Like Comparison: Whole Portfolio
Notch Differences: High Yield Portion


The rich consensus dataset also supports ongoing portfolio monitoring, servicing and substitutions. Detailed CCRs allow investors to assess marginal changes to risk through additional transactions.
For banks who provide ongoing portfolio / trade reporting, consensus data is an independent and regularly updated reference point covering the portfolio lifecycle from trade inception onwards.
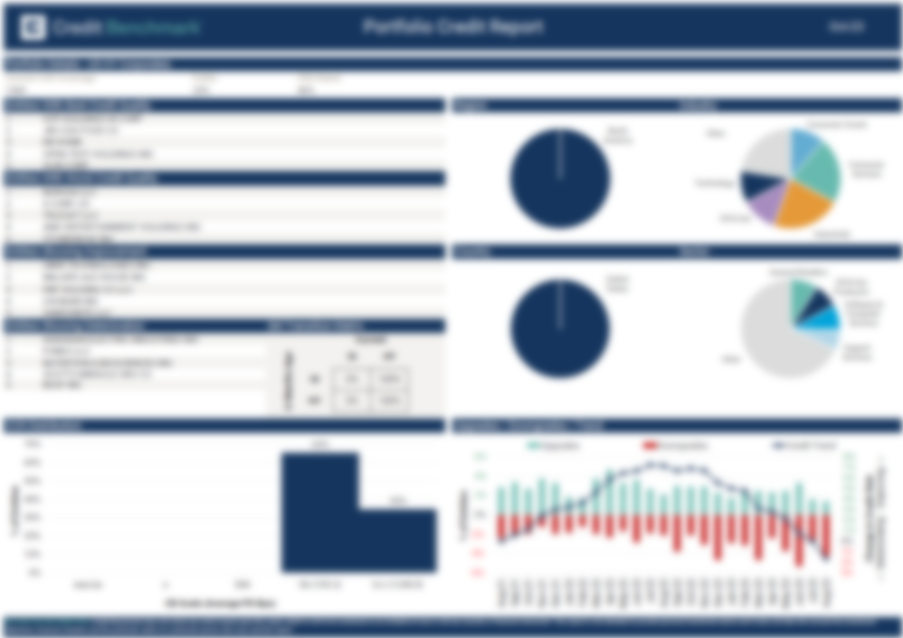
Credit Benchmark can produce bespoke and confidential portfolio credit reports on request. To download this full research note, including appendix with sample portfolio credit report on United States High Yield Corporates, please complete your details below: