
The Business Development Company sector in the US has grown steadily over the past 20 years, and there are currently more than 40 quoted funds with combined assets of more than $30bn. While BDCs allow retail investors to gain liquid exposure to portfolios of private companies, their historically high returns have been dented recently by some steep falls in valuations and – in some cases – discounts to net asset values.
The sample of BDCs covered by consensus credit data includes several otherwise unrated firms. This note shows some variation in credit quality (driven by differences in sector focus and 1st lien status) across the sample, but recent credit trends have so far been benign. This data can be used to track monthly changes in BDC companies and alert investors to any turning points.
Figure 1 shows the credit distribution for a sample 15 BDCs, of which Credit Benchmark has had a Credit Consensus Rating (CCR) for the last year, 6-months ago compared to current estimates.
Detailed consensus credit data is available on Bloomberg or via the CB Web App, covering many otherwise unrated companies. To arrange a demo of all single name and aggregate data detailed in this report, please request this by sending us an email.
Figure 1: Credit Distribution, BDCs; 6M Ago vs. Current

The credit distribution for this sample of BDCs has improved over the last 6-months; 7% of companies are now rated a credit category rating.
This improvement of BDCs is mirrored in Figure 2.
Figure 2: Proportion of BDCs With IG Credit Category Rating; Sep-21 to Sep-22

Figure 2 shows that the percentage of BDCs with IG credit category rating has substantially increased from 67% in Sep-21 to 80% in Sep-22.
Figure 3 shows the credit trend for BDCs.
Figure 3: Credit Trend, BDCs; Sep-21 to Sep-22

This shows that BDCs experienced a decline in average credit risk – measured by default probability (axis inverted) – in late 2021. In 2022, the credit risk has been more stable.
Figures 4-6 show detailed credit trends for various individual BDCs, some of which have limited CRA coverage.
Figure 4: FS KKR Capital Corp – a publicly traded business development company (BDC) focused on providing customized credit solutions to private middle market U.S. companies.
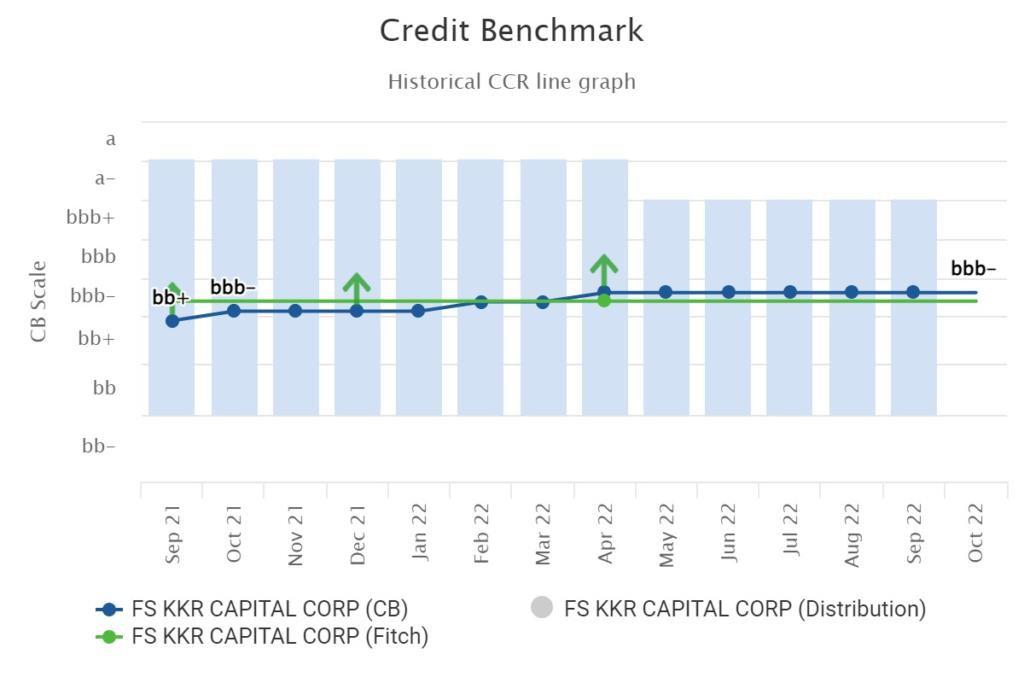
Figure 5: Midcap Financial Investment Corp – an externally managed, publicly traded, Business Development Company, focused on providing senior debt solutions to middle market companies.
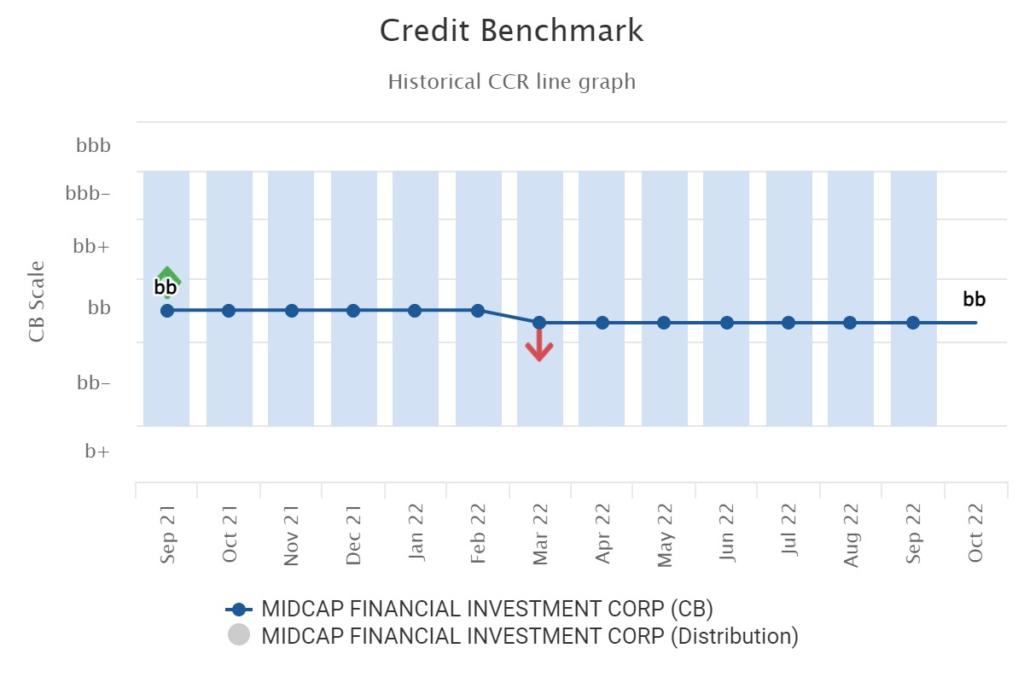
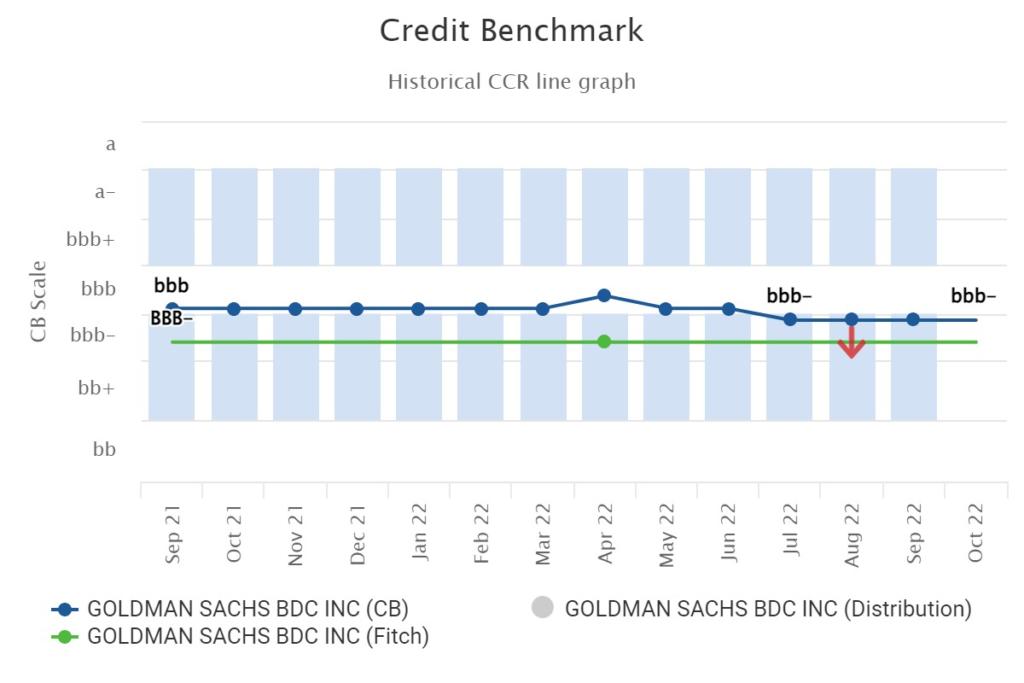
Figure 6: Goldman Sachs BDC Inc – is a specialty finance company focused on lending to middle-market companies, primarily in the US
A full Universe Analytics based on this sample of BDCs is available. Please contact [email protected] for more information.
Enjoyed this report? If you’d like to see more consensus-based credit ratings, mid-point probabilities of default and detailed analytics on 60,000+ public and private global entities, please complete your details to start a trial or to request a coverage check:

