
Whitepaper // No.8
February 2017
Airline Industry Trends
›Crowd-sourced credit estimates from IRB banks cover 54 airline companies and subsidiaries globally.
›These companies have an average credit category of b+.
›Of these, 34 do not have a Long Term S&P rating.
›Credit risk is positively correlated with Net Debt, and slightly negatively correlated with Product and Safety Ratings.
›European Low Cost carriers are viewed as lower credit risk than Full Service carriers.
›Sovereign backing directly affects the credit risk of individual carriers.
›Risk profiles for individual obligors migrate over time and may be independent of the corporate parent.
›Extreme credit views are correlated with extreme equity price changes, but the sign depends on the risk regime.
Download the PDF “Global Airlines Sector: Credit Trends“
The global airlines sector made record profits last year. Long term global population growth and short to medium term oil trends continue to be favourable. Monthly data shows that credit views of individual airlines have changed rapidly over the past year, and overall credit risk is improving. Credit data shows some correlation with factors such as product and safety record, equity price changes, and balance sheet strength but it also cuts across all of these dimensions to provide an independent factor for sector analysts.
Using the global airlines sector as an example, this paper shows that monthly crowd-sourced credit data is now available for 54 legal entities across the sector. Of these, 34 do not have a Long Term rating from S&P.
This dataset provides transparency for global, regional, corporate hierarchy and individual legal entity factors. It can also be used to estimate a range of metrics which track monthly changes in the position and shape of the distribution of bank credit risk estimates.
The dataset provides an independent dimension for sector credit analysis as well as for detailed comparisons with macro- and micro- factors, including debt levels, product and safety ratings and equity price performance.
| Credit Benchmark: Collective Intelligence for Global Finance | |
| Working with key global banks, Credit Benchmark (CB) have developed an anonymous and secure pool of internal bank credit risk estimates, to create consensus Probabilities of Default (“PD”) and senior unsecured Loss Given Default (“LGD”) metrics. The Credit Benchmark service offers monthly updated consensus PDs and LGDs on thousands of obligors at the individual legal entity level, extending from Sovereigns and banks to public and private corporates and funds. Credit Benchmark also offers data on tens of thousands of obligors for use at portfolio level. Quorate consensus PDs are simple, unweighted averages of at least three independent PD or LGD contributions for an identical legal entity over an equivalent estimation period. Participation in the service is open to any banks that use the IRB method for calculating regulatory capital. Credit Benchmark warmly invites interested institutions to become contributors. |
Airlines have just had the most lucrative year in their history. 1 According to the IATA 2 , demand for air travel is increasing at the apparently modest rate of 3.5% pa, but this implies a near doubling in passenger numbers over the next 20 years from 3.8bn to more than 7bn pa. This compound growth is due mainly to a steadily growing global middle class.
Airlines have traditionally been high-risk investments, due to high operational leverage, subsidized national flag carriers, oil price volatility and environmental constraints on growth. But Low Cost carriers have changed the dynamics of the airlines sector – some of the newer entrants have the strongest balance sheets and the best credit ratings in the sector.
This paper uses crowd-sourced credit data to show how these and other dynamics are affecting the sector players, including those that are not quoted on stock markets or rated by traditional agencies. It reviews recent sector trends and compares crowd-sourced credit data to a number of other sector metrics, to give a better understanding of the underlying credit risk for each entity.
Credit Benchmark aggregates and anonymizes 1-year forward looking through-the-cycle probabilities of default at the individual obligor level from global internal ratings based banks. Exhibit 2.1 shows the current coverage.
Exhibit 2.1.1 Global Coverage
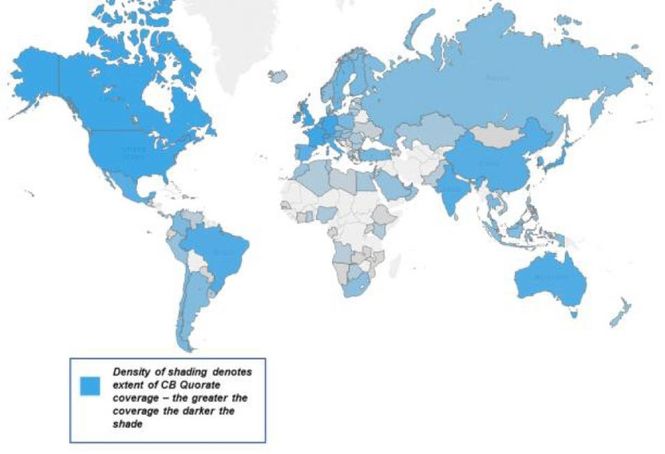
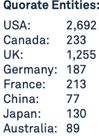
Exhibit 2.1.2 Dataset Growth
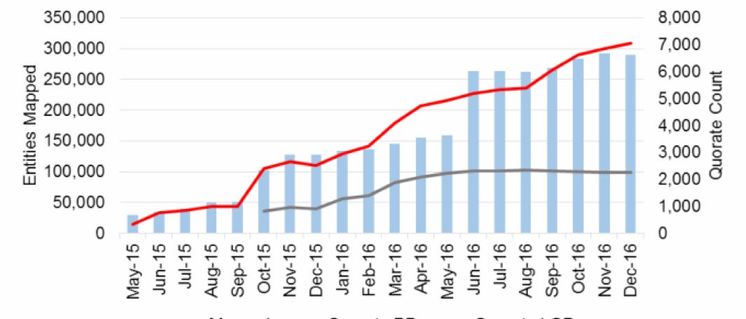
As of December 2016, the dataset provides consensus quorate 3 estimates on more than 7,000 obligors including Sovereigns, corporates, banks and non-bank financial entities. The coverage spans multiple geographies and entity sizes, from large multinational companies to small to medium sized enterprises (“SMEs”). The dataset also includes close to 300,000 additional mapped entities that can be leveraged to produce top-down portfolio views, indices and transition matrices.
The risk estimates for the quorate single names represent the collective, consensus views of expert credit risk departments in global banks expressed as Probabilities of Default (“PD”). This approach leverages the so-called “Wisdom of Crowds”, 4 where single PD estimates are aggregated and mapped to a credit category scale called the Credit Benchmark Consensus (“CBC”). 5 The dataset is updated and published monthly, providing a new and unprecedented level of granularity for risk managers and analysts.
Globally, the airlines sector recorded profits of nearly $40bn in 2016, driven by a combination of cheaper oil and greater capacity utilisation. 6 With global GDP growth projected to reach 3.4% in 2017, 7 the eight year uptrend in aggregate sector profits 8 is expected to continue. If airlines can maintain their recent strong control over costs and operating metrics then margins should be maintained alongside healthy volume growth.
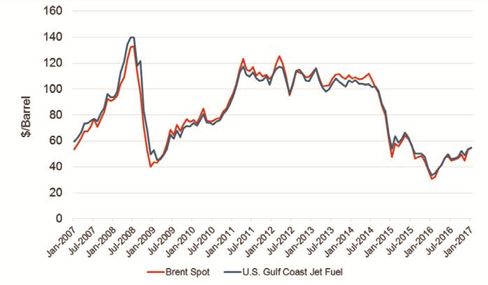
The main threats to sector profitability are volatile oil prices and increasing operational risk, partly due to global political uncertainty. Exhibit 3.1 shows that jet fuel prices are above their recent lows. If this uptrend continues, it would be negative for profit margins in 2017. Political risks include potential government intervention; specifically in Europe, where the European Union could intervene to protect EU Full Service carriers. 9
The generally positive outlook for the sector depends on the strength of the global economy, and the continued financial discipline of the global carriers, who have been reinvesting in newer planes and other efficiency improvements to reduce overall breakeven load factors. 10
The Credit Benchmark dataset includes coverage for 54 individual legal entities in the airlines sector. Exhibit 4.1 shows the credit distribution of the airlines sector for the 54 companies covered by Credit Benchmark.
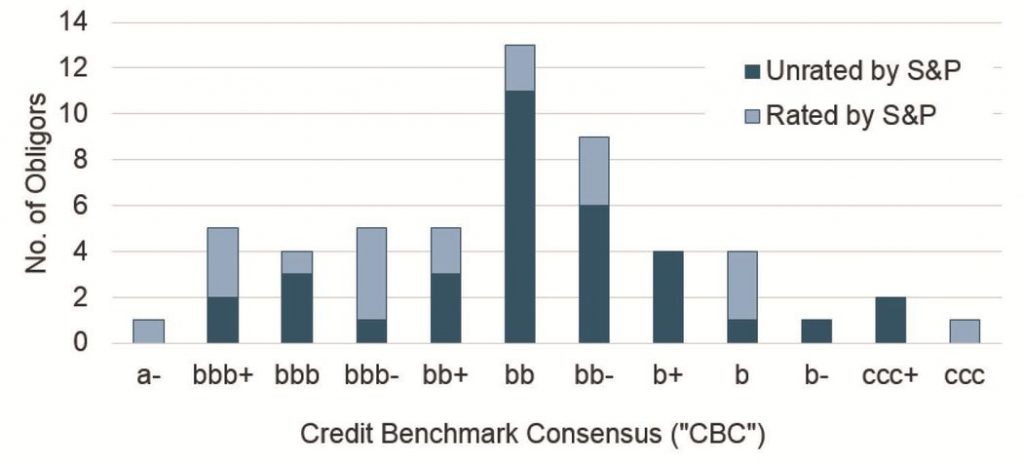
This shows that 34 of the 54 airline companies do not have ratings from S&P, although they may have ratings from other agencies. The coverage also includes 20 of the 26 constituents of the Bloomberg World Airlines Index (BWAI) 11 and represents around 90% of the total market capitalisation of the index. The 34 remaining entities outside of the BWAI represent entities that are a mixture of parents and operating subsidiaries.
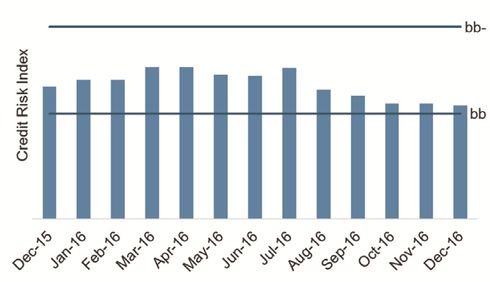
Exhibit 4.2 compares the BWAI equity index with the average CBCs for the constituents (where available) since April 2016.
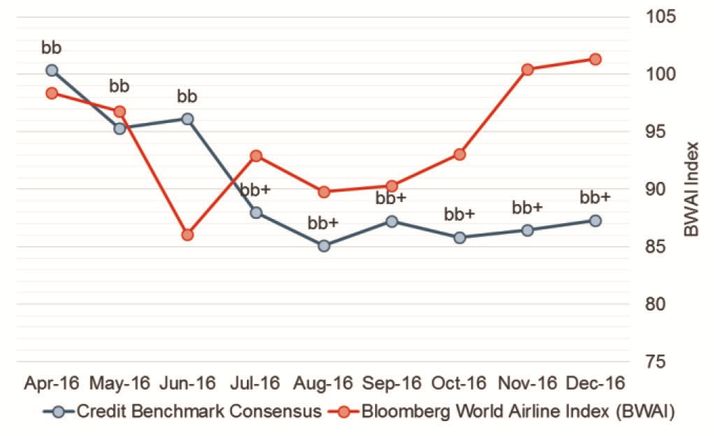
This chart shows that the BWAI equity index has risen more than 15% since its low in June; over the same period there has been a trend improvement in the credit standing of the 20 BWAI constituents that are included in the Credit Benchmark dataset. The average CBC moved from bb to bb+ in July and has been stable in the latter half of the year.
› Source: BWAI Source: Bloomberg Finance L.P.
One of the key advantages of the crowd-sourced dataset is that it provides a very large set of Ex Ante PDs. Traditionally, researchers who wanted to understand the relationship between financial fundamentals and default risk have had to rely on Ex Post default history or market data.
With very granular, monthly PD estimates across a large range of obligors, the Credit Benchmark dataset can be used to test correlations between PDs and a range of macro- (systematic) and micro- (company specific) factors.
Exhibit 5.1 shows two examples. Exhibit 5.1.1 shows the recent relationship between GDP growth (as a proxy for air travel demand) 12 and the average CBCs (for the BWAI constituents). Over the past 9 months, the improving average CBC for the BWAI-quorate entities has coincided with a period of improving real GDP. 13
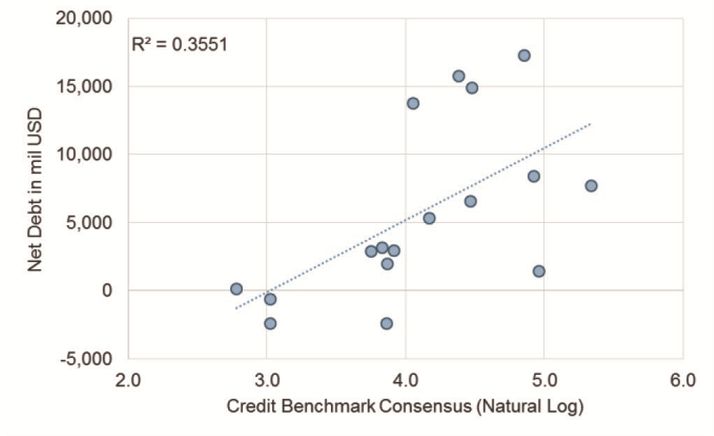
Exhibit 5.1.2 shows the relationship between Net Debt levels and individual CBCs for the BWAI-quorate entities.
Net Debt has been a focus for both European and North American carriers who have reduced the average ratio of Adjusted Net Debt to EBITDA to below 4.5x. By comparison, Asia-Pacific and Latin American carriers had an average ratio of more than 5.5x .14 Net Debt is generally a good proxy for the overall operating and fiscal discipline of each carrier, and this chart shows a strong correlation between Net Debt levels and CBCs.
Exhibit 5.1.1 Real GDP Growth* vs. CBC
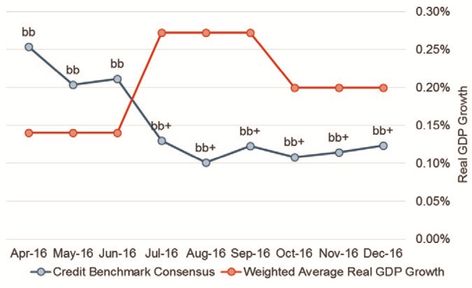
Exhibit 5.1.2 Net Debt** vs. CBC
With single name data and a monthly publish frequency, the crowd-sourced dataset is ideally suited to this type of macro- and micro- factor analysis and can be used to highlight various sector dynamics. The next section extends this approach to regional differences.
This section discusses two regional case studies, with different risk drivers:
15 of the region, North America vs. Europe.›North America and Europe are two of the largest airline markets in the world, and this is reflected in the crowdsourced dataset coverage, with 57.4% of the total coverage of 54 entities. Although Europe and America are both Developed Economies, their airline sectors are subject to very different dynamics. European carriers face an uncertain regulatory environment, labour disputes, and intense competition in a fragmented market. The top three Full Service carriers in the European Union control just 29% of the market, compared to 52% for the US equivalents. 16 This fragmented European market has allowed Low Cost carriers to steadily build market share.
Exhibit 6.1 uses the crowd-sourced data to highlight the clear distinction in risk profiles between Low Cost and Full Service carriers in Europe.
* 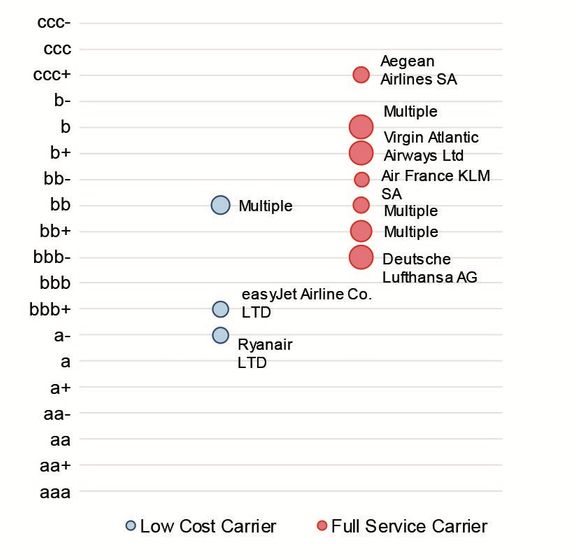
This chart shows that the Low Cost Carriers all show similar levels of uncertainty about the correct PD estimate
– the blue bubbles represent the dispersion in estimates and they are all similar in size.
The Full Service Carriers show a larger range of dispersion estimates. Unusually, the consensus for each of the highest risk airlines is similar to, or smaller than, that of the lower risk airlines. This may indicate uncertainty about the direction of the future trend of credit risk estimates for some of the lower risk airlines.
The average CBC for European Low Cost carriers is bbb-; but as the chart shows, there are two distinct clusters of Investment Grade and Non-Investment Grade obligors. The European Full Service carriers show an average CBC of bb-, with a bias towards lower quality. The range within each group is similar: 6 notches for the Low Cost group; 8 notches for the Full Service group.
Exhibit 6.2 shows the risk profile for the US primary Full Service carriers (Delta, American and United) and their subsidiaries. This has been improving since mid-2016. The detailed PD estimates placed the US Full Service carriers midway between a CBC of bb- and bb in April 2016. In recent months these risk estimates have been declining, and further improvements would take the sector average into the bb+ category. These trends coincide with ongoing sector consolidation and cost-cutting programmes.
›The average CBC for Developed Economy carriers is bb- (December 2016) compared to b for Emerging/Frontier Economy carriers. Exhibit 6.3 shows the Emerging/Frontier Economy carriers in detail and compares them with the Sovereign credit risk for their country of domicile.
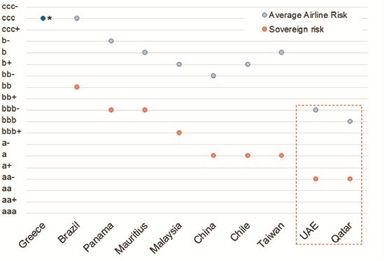
This chart shows a clear distinction between carriers in the Middle East and the rest of the group. These companies are classed as investment grade (bbb and bbb+) and the average gap between them and the equivalent Sovereign risk is 5.5 notches.
The rest of this group is Non-Investment Grade with an average CBC of b. The average gap with the equivalent Sovereign risk is 6 notches.
*Greece: The Sovereign and Average Airlines Rating for Greece is equal.
This also shows that there is a positive correlation between the credit risk for these carriers and the credit risk of the corresponding Sovereign.
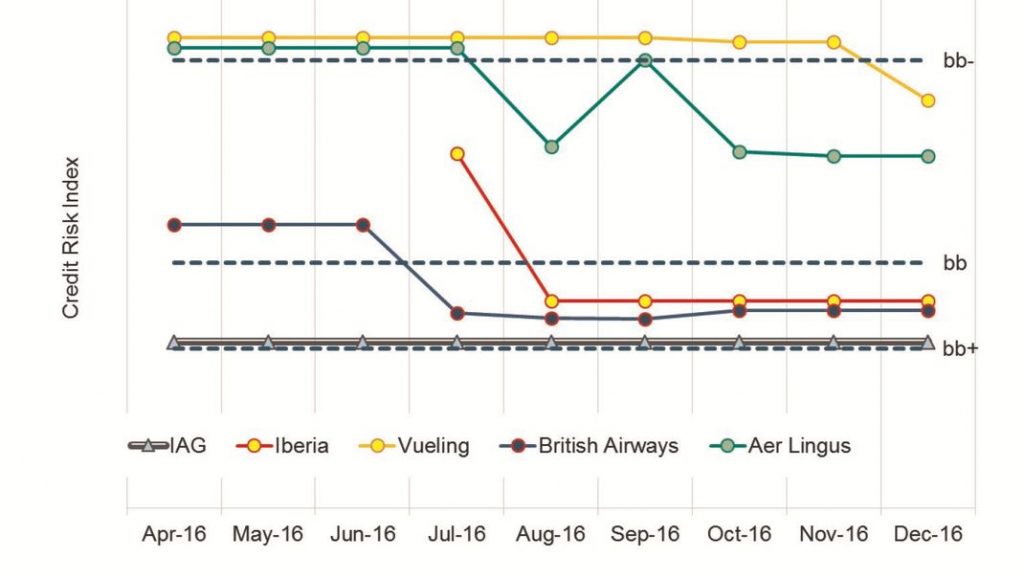
The Credit Benchmark dataset covers Parent and Operating Subsidiary legal entities for a large number of corporate families. This provides detailed credit views across corporate structures. Exhibit 7.1 plots the credit trends for the International Consolidated Airlines Group SA (IAG) and a number of its subsidiaries. These include Aer Lingus Ltd., British Airways PLC, Iberia Linesa Aereas de Espana SA and Vueling Airlines SA.
Exhibit 7.1 shows the PD trends for the IAG parent and each subsidiary against a CBC scale. This shows that the parent risk profile for IAG has been stable throughout 2016. The various operating subsidiaries have shown considerable fluctuations, indicating potential divergence in risk views within the family.
The crowd-sourced dataset also includes metrics on the position and shape of the distribution of contributed risk estimates. The dispersion and skew profile for the estimates that feed into each credit risk view can also provide insight into future trends. The next section examines this in more detail for one of the IAG operating subsidiaries.
For each quorate obligor, the CBC indicates the credit category corresponding to the consensus PD estimate, which is an average across a number of contributions. The position and shape of the distribution of the individual bank contributions is summarised in additional metrics covering the range or dispersion (standard deviation) and bias (skew).
Exhibit 8.1 shows these metrics as icons, using British Airways PLC (part of the IAG group) as an example.
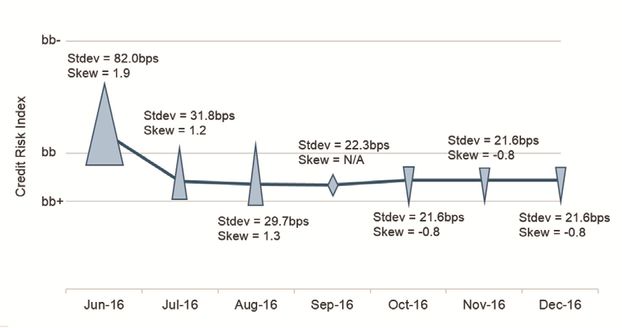
The quorate risk view for individual obligors is based on 3 or more PD estimates from IRB banks. Exhibit 8.1 shows how constituent estimates can change over time. Points are plotted as arrows and diamonds. The arrow width is proportional to the dispersion and the direction indicates the position of the outlier. An upward-pointing scale arrow (positive skew) means that one PD estimate is significantly higher than the rest. A downward arrow means the opposite. A diamond indicates that there are no significant outliers.
This shows that the consensus bank view of the credit risk of British Airways PLC has migrated over time. In June 2016, there was a wide dispersion in risk views and this was also positively skewed. This means that one PD estimate was significantly higher than the majority.
The CBC dispersion decreased until September, at which point the bank views showed no significant bias, with no skew in either direction. In October, the CBC dispersion tightened further, and now shows a negative skew. At the same time, there was a slight deterioration in the underlying PD. This indicates that at least one, and probably two or more banks have slightly increased their PD estimates by a similar magnitude, leaving those with a more positive view as outliers. This example shows how these simple metrics can provide highly nuanced insights into the changing assessments made by the contributing banks.
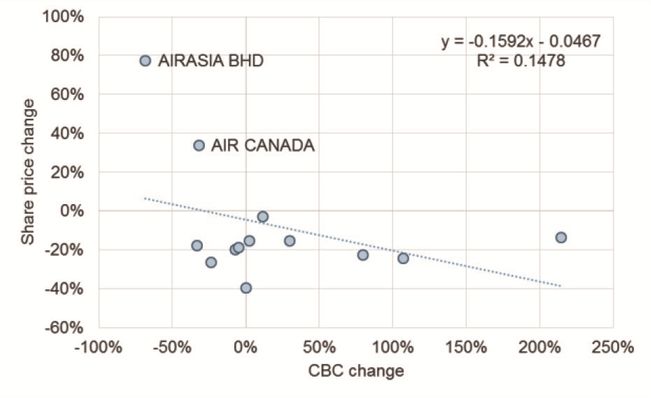
Within the Credit Benchmark airlines universe, 33 out of the 54 entities in the dataset have publicly traded equities in issue. 17 Exhibit 9.1 shows the relationship between equity price changes and CBC. Exhibit 9.1.1 compares the CBC level with the 1-year share price change. Exhibit 9.1.2 shows the relationship between the 1-year share price change and the change in the CBC over the same period.
Exhibit 9.1.1 shows that there is no obvious relationship between CBC level and price change over this period. Exhibit 9.1.2 also shows a very weak overall relationship between CBC change and price change. However, there are some significant outliers in the tails of both ends of the distribution. Companies with the largest increase in CBC (credit deterioration) also had the largest negative share price performance. Some of the companies with the largest decrease in CBC (credit improvement) had the largest positive share price performance.
Detailed time series data for AirAsia BHD and Air Canada in particular show that CBC changes are accompanied by a convergence in risk views (a drop in the dispersion of the PD estimates). As the British Airways example shows, the drop in standard deviation over time reflects the contributor banking community converging on a similar view of the entity risk profile of the entity.
Exhibit 9.1.1 Share Price Changes vs. CBC Level
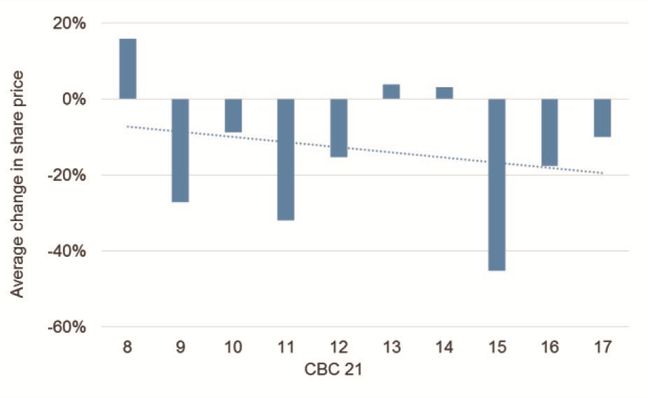
Exhibit 9.1.2 Share Price Changes vs. CBC Change
It is worth noting that the relationship between credit risk and equity price will depend on the prevailing risk appetite regime. During ‘Risk On’ phases, high risk assets will show the best performance; during ‘Risk Off’ phases, they will underperform. CBCs reflect a longer term view of credit risk over an entire credit cycle. They can provide a clear distinction between high- and low- beta stocks, provided that an investor has a clear view about the prevailing risk regime.
Since CBCs are also available for private companies, they provide some indication of the credit risk of companies which may be planning an IPO, either directly or by comparison with their peer group.
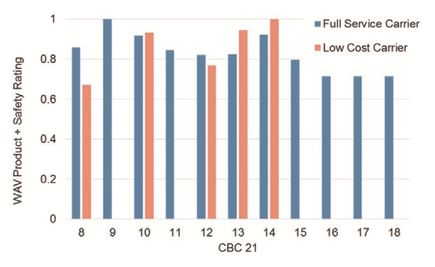
Exhibit 10.1 shows the CBC for the 36 quorate entities in the Credit Benchmark airlines universe for which product and safety data is available. Exhibit 10.1.1 shows that a higher product and safety rating is associated with a lower CBC (i.e. higher credit quality).
Exhibit 10.1.2 shows the CBC plotted against a weighted combination of Product and Safety Ratings 18 . Traditional Full Service carriers, who compete on amenities, show a positive relationship between the Product/Safety Ratings and credit quality (lower CBC implies higher Product and Safety Rating). However, Low Cost carriers, who compete on price, show no strong relationship. Exhibit 10.1.2 uses the crowd- sourced credit data to highlight an apparent distinction between these two business models.
Exhibit 10.1.1 Avg. Safety vs. CBC (Ex-Low Cost Carriers)
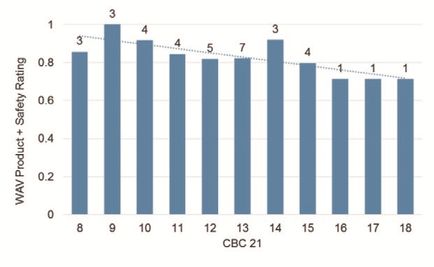
Exhibit 10.1.2 Product & Safety Rating vs. CBC
This suggests that the credit review process in banks is linked, directly or indirectly, to product and safety records in the Airlines sector.
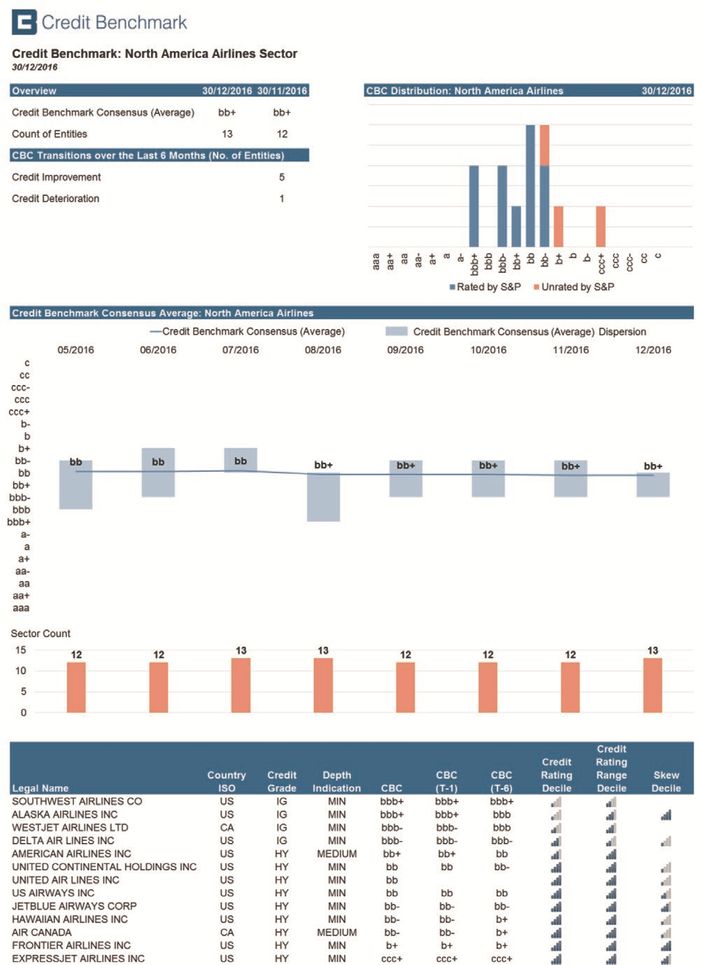
Exhibit 11.1 shows a typical sector tear sheet, constructed using the Credit Benchmark Excel API. This and other templates are available to download by clients; they can be used directly or can be modified by clients to allow combinations of their own data with the crowd-sourced data set.
Credit Benchmark Product Specialists can also construct bespoke spreadsheets to suit individual client workflow requirements.
Taking the airlines sector as an example, this paper has shown that monthly crowd-sourced credit data is now available for 54 legal entities across the sector. Of these, 34 do not have a Long Term S&P rating.
The Credit Benchmark dataset provides transparency into global, regional, corporate hierarchy and individual legal entity factors. It can also be used to drive a range of metrics that track monthly changes in the position and shape of the distribution of bank credit risk estimates.
The dataset provides an independent dimension for sector credit analysis as well as for detailed comparisons with macro- and micro- factors, including debt levels, product and safety ratings and equity price performance.
Download the article “Global Airlines Sector: Credit Trends” on PDF.
We aggregate the views of thousands of institutional credit analysts to create new, unique consensus data and analytics. Our clients use the unique entity- and aggregate-level data and analytics to understand and manage their risks effectively. The data helps clients focus their attention on where and when it matters most, whether in their risk management, investment process, or regulatory compliance. Learn more.
Barbora Makova
John Michael Fryback
David Carruthers
*Bubble size represents dispersion (relative standard deviation) of the PD estimates for each carrier.
1 https://www.theguardian.com/business/2016/jun/02/airline-industry-profits-expected-to-increase-2016-iata
2 International Air Transport Association
3 Based on Probability of Default estimates from 3 or more contributing banks.
4 The ‘Wisdom of Crowds’ was initially observed by Francis Galton and is the basis for the value in crowd-sourced datasets. It is the popular version of the Diversity Prediction Theorem which can be stated as: “The squared error of the collective prediction equals the average squared error minus the predictive diversity” – implying that if the diversity in a group is large, the error of the crowd is small.
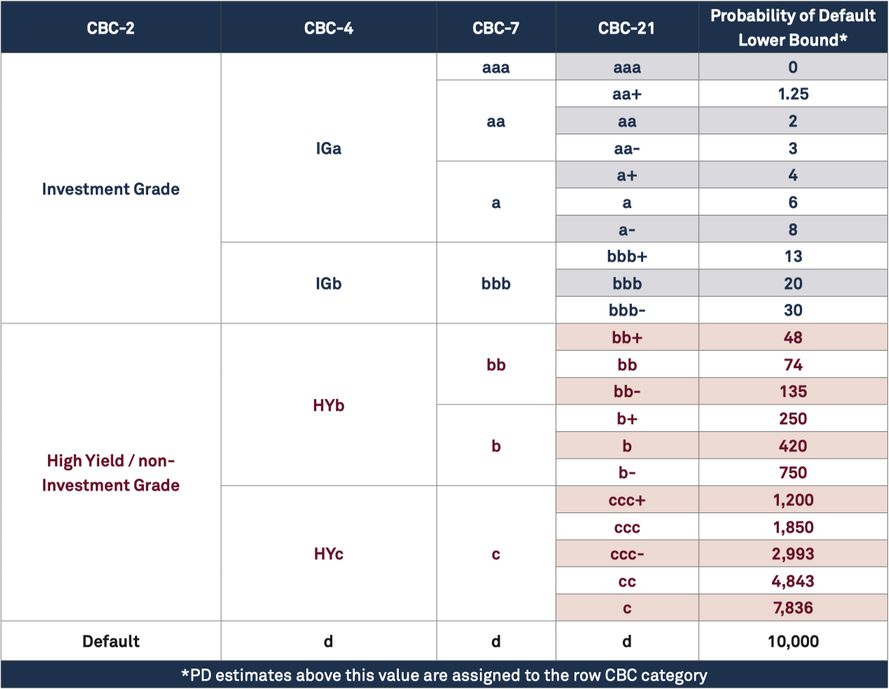
5 The Credit Benchmark Consensus (“CBC”) is a 21-category scale explicitly linked to probability of default estimates sourced from major banks. A CBC of bbb+ is broadly comparable with BBB+ from S&P and Fitch or Baa1 from Moody’s.
6 https://www.theguardian.com/business/2016/jun/02/airline-industry-profits-expected-to-increase-2016-iata
7 http://www.imf.org/external/pubs/ft/weo/2016/02/
8 http://www.iata.org/pressroom/pr/Pages/2016-12-08-01.aspx
9 Bank of America European Airlines Overview 2017.
10 http://www.iata.org/whatwedo/Documents/economics/Economic-Performance-of-the-Airline-Industry-end-year-2016-forecast-slides.pdf
11 The Index includes 30 constituents of which 4 Asian Airlines are included twice due to listings on both the Shanghai and Hong Kong stock exchanges.
12 Air travel demand has shown a history of being closely tied to GDP growth. According to the Bank of America European Airline s Overview 2017, air travel demand has historically expanded at a rate of 1.2x-1.6x global GDP growth.
13 Real GDP growth is calculated using a weighted average of the 20 entities included in the Bloomberg World Airline Index and covered by Credit Benchmark. The sample is skewed towards the US.
14 As of financial YE 2015. http://www.iata.org/whatwedo/Documents/economics/Economic-Performance-of-the-Airline-Industry-end-year-2016-forecast-slides.pdf
15 Competitiveness means the level of concentration vs. fragmentation. The Herfindahl Index is the most commonly used measure.
16 Competitiveness means the level of concentration vs. fragmentation. The Herfindahl Index is the most commonly used measure. Bloomberg Businessweek 12 December, 2016.
17 The 33 entities included in this sample reflect a mixture of those that have been present for the full period and those that were added over the course of the year
18 http://www.airlineratings.com/
Credit Benchmark is an entirely new source of data in credit risk. We pool PD and LGD estimates from IRB banks, allowing them to unlock the value of internal ratings efforts and view their own estimates in the context of a robust and incentive-aligned industry consensus. The resultant data supports banks’ credit risk management activities at portfolio and individual entity level, as well as informing model validation and calibration. The Credit Benchmark model offers full coverage of the entities that matter to banks, extending beyond Sovereigns, banks and corporates into funds, Emerging markets and SMEs.
We have prepared this document solely for informational purposes. You should not definitely rely upon it or use it to form the basis for any decision, contract, commitment or action whatsoever, with respect to any proposed transaction or otherwise. You and your directors, officers, employees, agents and affiliates must hold this document and any oral information provided in connection with this document in strict confidence and may not communicate, reproduce, distribute or disclose it to any other person, or refer to it publicly, in whole or in part at any time except with our prior consent. If you are not the recipient of this document, please delete and destroy all copies immediately.
Neither we nor our affiliates, or our or their respective officers, employees or agents, make any representation or warranty, express or implied, in relation to the accuracy or completeness of the information contained in this document or any oral information provided in connection herewith, or any data it generates and accept no responsibility, obligation or liability (whether direct or indirect, in contract, tort or otherwise) in relation to any of such information. We and our affiliates and our and their respective officers, employees and agents expressly disclaim any and all liability which may be based on this document and any errors therein or omissions therefrom. Neither we nor any of our affiliates, or our or their respective officers, employees or agents, make any representation or warranty, express or implied, that any transaction has been or may be effected on the terms or in the manner stated in this document, or as to the achievement or reasonableness of future projections, management targets, estimates, prospects or returns, if any. Any views or terms contained herein are preliminary only, and are based on financial, economic, market and other conditions prevailing as of the date of this document and are therefore subject to change. We undertake no obligation to update any of the information contained in this document.
Credit Benchmark does not solicit any action based upon this report, which is not to be construed as an invitation to buy or sell any security or financial instrument. This report is not intended to provide personal investment advice and it does not take into account the investment objectives, financial situation and the particular needs of a particular person who may read this report.

