With rising infection rates and concerns about the looming virus season, the COVID crisis is clearly far from over. But with the first wave behind us, it is possible to see the past six months of market volatility in its broader context.
The S&P500 is now higher than it was in February 2020, having at one stage lost one third of its value. The VIX spiked from a mid-February level of 14% to a mid-March high of 85%, and currently trades at 33%. The Global BBB spread[1] tripled from 1.5% to 4.5% and currently sits at 1.7%. It is worth noting that while the equity distress measures topped out in March, credit spreads took another month to reach their peak. Credit rating agencies were also quick to react with unprecedented levels of multi-notch downgrades.
Markets were saved by Government policies – cheaper money for corporates and financials, “helicopter” money for furloughed workers; state bailouts and massive fiscal expansion. The market meltdown must have been a major driving factor in these Government responses, but – with hindsight – many financial commentators see signs of over-reaction.
The economic future is obviously highly uncertain and a spike in corporate downgrades and defaults is inevitable, along with a wave of mergers and acquisitions. But in a world that Joseph Schumpeter would recognize, the COVID winners are already beginning to emerge. It is not all bad news.
Consensus credit data shows a more measured response to the crisis. Figure 1 shows a comparison between changes in the global bond spread and in the global corporate credit risk over the past year.
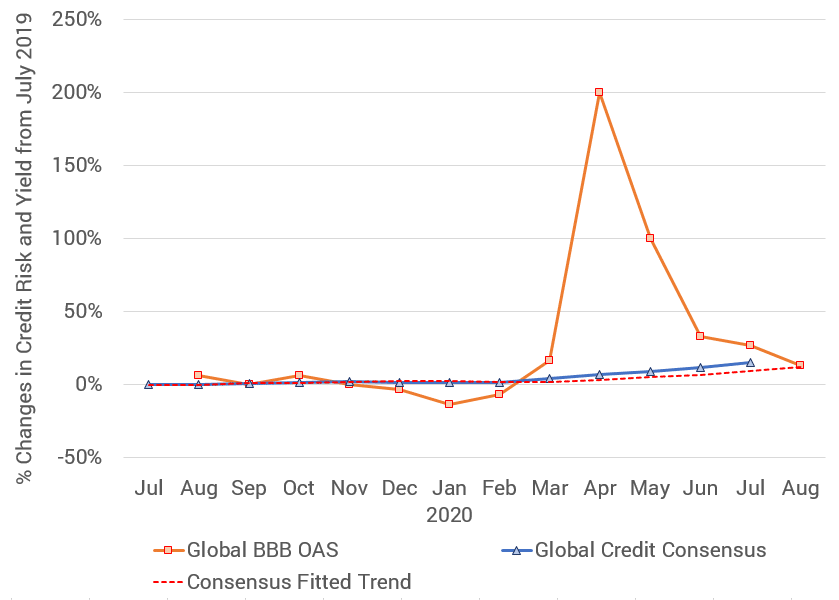
The spread shows a rapid and huge spike followed by a sharp drop, settling at a cumulative 26% higher at the end of July – an increase of 40 Bps in yield terms – but only up 13% at the end of August. Consensus credit data shows a similar cumulative increase (15%) over the same period, but along a much smoother path. The dashed line shows a one month ahead projection derived from the fitted trend[2]. Since credit risk rose steadily over the period, the projected trend lags the actual values, but is projected to increase by a cumulative 12% by the end of August. The Credit Benchmark flash report (due soon) will reveal how accurate that is.
So after six months of extraordinary market volatility, changes in the “real world” consensus tortoise and “market implied” spread hare have more or less coincided. This suggests that the consensus may provide a smoother and calmer indication of where the credit market is eventually going, and investors with strong nerves may be able to use this as an extra input to their buy/sell indicators.
[1] BofAML / ICE BBB Option Adjusted Spread
[2] For each month, the time trend is fitted to the current and previous consensus sample; the dotted line

