
Credit portfolio managers face spiking interest rates and rising defaults, and contagion from one sector to another is a major concern. Consensus credit aggregates show how credit risk correlations between sectors are changing.
Figure 1 shows correlations between month-on-month PD changes for a small subset of US Corporate sectors from early 2018 to the start of the pandemic in 2020, and from the start of the pandemic in 2020 to the middle of 2022.
Figure 1: Correlations between monthly PD Changes, US Sectors, 2018 to 2020 and 2020 to 2022
2018 – 2020
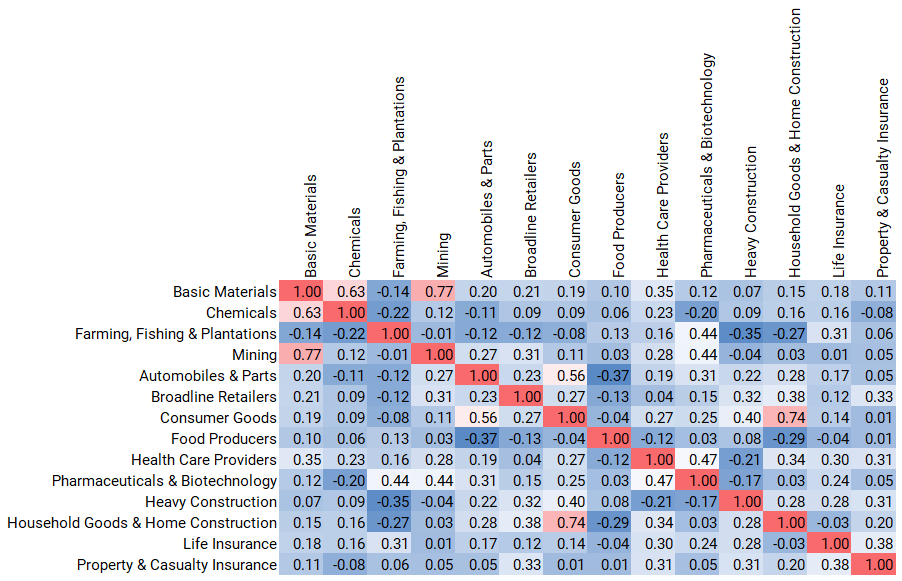
2020 – 2022
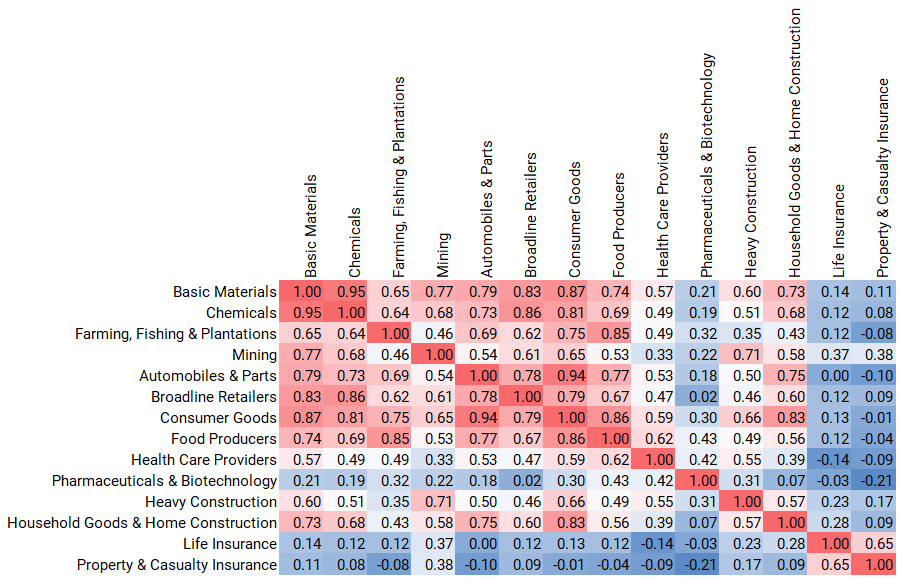
In the two years before the pandemic, correlations[1] between sector average default risks were typically low. There are exceptions: correlations between Basic Materials and its subsectors Mining and Chemicals are understandably high and positive (+0.77 and +0.63); in a similar vein the correlation between Consumer Goods and the Household Goods/Home Construction sector is also high at +0.74. For most sectors, however, the correlations are not just low, some are negative – implying that rising risk in one sector is often associated with falling risk elsewhere.
But in the past two years, even for this small sample of sectors, the picture has changed dramatically. Basic Materials are very highly and positively correlated with a diverse range of sectors – Farming, Autos, Retail and Food. Lower correlations are confined to Pharma & Biotech and two Insurance sectors; there are very few negative correlations.
These high correlations are a symptom of a major increase in global credit risk – leaving the credit portfolio manager with limited scope for diversification over the pandemic period.
Figure 2 shows correlations for the same sample of sectors, for the past year. Note that this includes part of the period covered by the 2020-2022 matrix.
Figure 2: Correlations between monthly PD Changes, US Sectors, 2021 to 2022
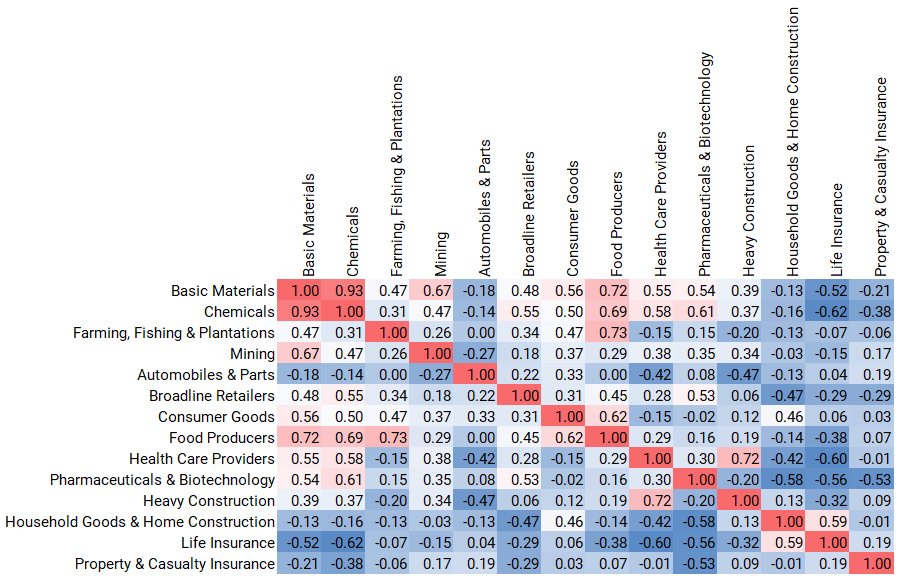
This shows a growing number of lower positive or moderately negative correlations, especially in Household Goods/Home Construction, Heavy Construction, Autos and Insurance sectors. Correlations remain high and positive between Basic Materials, Chemicals and Mining as well as Food Producers. Current sources of economic instability – Ukraine war, climate change, rate hikes – is uncovering new credit fault lines, so these correlations are likely to shift rapidly in coming months.
Compared with market data (such as CDS or Bond indices) consensus data covers a large and mainly unrated universe (more than 30,000 corporates and financials). The risk estimates are “real world” – unaffected by market risk premiums, and correlations between sectors change over time as risk estimates are revised – unlike market sector indices which are usually highly correlated during risk on and risk off phases.
The list of aggregates with a full monthly history starting in early 2016 includes more than 850 geographic and industry/sector combinations. Correlation matrices (CMs) are available on request for combinations of these aggregates; an Excel tool is also available which can be used to generate various matrices for different historical periods.
Credit Consensus Ratings (CCRs), Analytics and Aggregates are based on risk views from 40+ of the world’s leading financial institutions collected monthly by Credit Benchmark, with twice-monthly flash updates.
[1] Correlations here are measured as the unweighted linear correlation coefficient between one-month changes in one-year Probability of Default estimates; the latter estimates are in turn the unweighted arithmetic average of the default risk estimates for the individual firms that make up the constituents of each aggregate.

