
Download PDF: US Default Risk Outlook
About this report
Credit Benchmark’s inaugural Default Risk Outlook draws on an extensive database of over 100,000 unique Credit Consensus Ratings (CCRs). These CCRs represent the internal risk views of expert analysts at the world’s leading banks – a previously untapped source of risk intelligence. 90% of the entities with CCRs are not rated by a major credit rating agency, meaning these projections offer a new and significant capacity for analysing default risk.
Although this report focuses on US Industries, the methodology can be applied to the broad and highly representative dataset of 100,000+ CCRs. The default projections can be customized for our clients to match their own classification schemas and align more accurately with their portfolios and exposures.
Vigilant risk management is vital when navigating an unpredictable economic climate. With broader, deeper, and more frequent analytics than previously available, Credit Benchmark is now able to offer the market a comprehensive and differentiated view on default risks.
If you would like a free and fully confidential analysis of the default risk projections of your own portfolio, we encourage you to get in touch here.
2024 US Default Risk Landscape
Default risks to peak by mid-2024 across most industries, with credit recovery possible if rate cuts go ahead
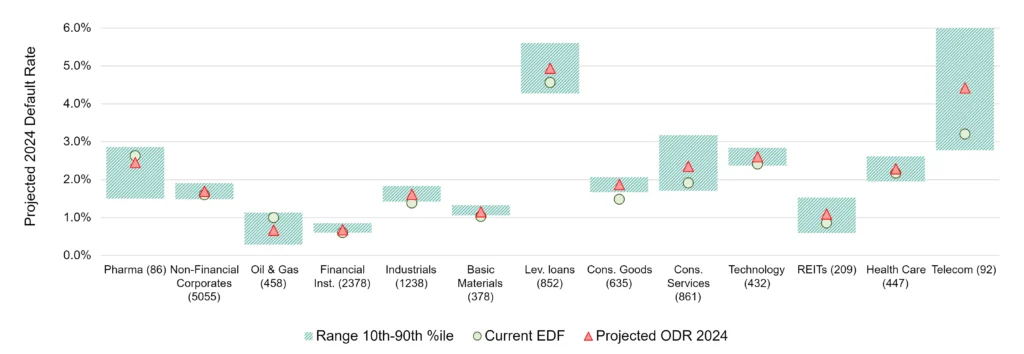
Credit Benchmark’s projected default rate for 2024
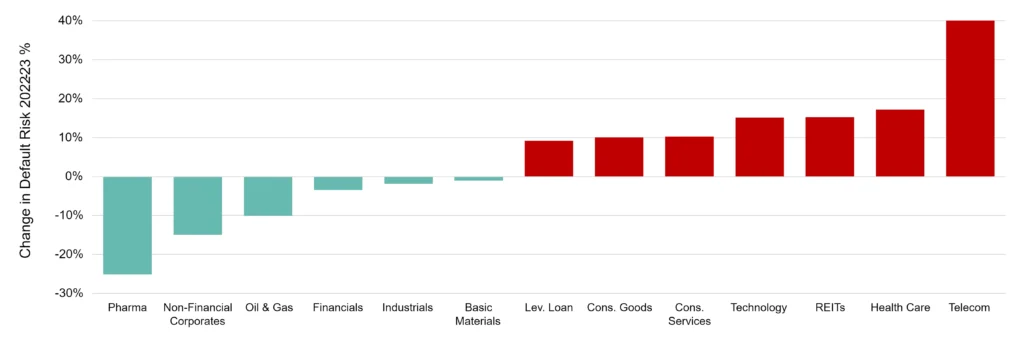
Change (%) in the probability of default (PD) during 2023
Key Takeaways
We predict that default^ risks will continue to rise and peak by mid-2024 across most sectors, except for technology and telecoms which will likely peak in late H2. Credit quality should generally recover in H2 2024 if rate cuts go ahead and barring further escalation of geopolitical risks.
- The oil & gas industry benefits from the most benign outlook for 2024, followed by the pharma industry.
- Risks are likely to rise modestly for consumer goods, industrials, basic materials, financial institutions.
- The largest projected increase in risk is likely for telecoms, consumer services, leveraged loans.
- Financial institutions and non-financial corporates show little change in default risk in 2024.
- Our Sectors to Watch section compares the shifting probabilities of default across peer sub-sectors.
^ Default Risk is defined as a weighted average of S&P long-term observed default rates in each rating category, using the monthly sector credit breakdown as weights derived from contributed bank data.
Outlook for US Non-Financial Corporates*
Default risks to rise slightly, peak by mid-2024 and ease thereafter
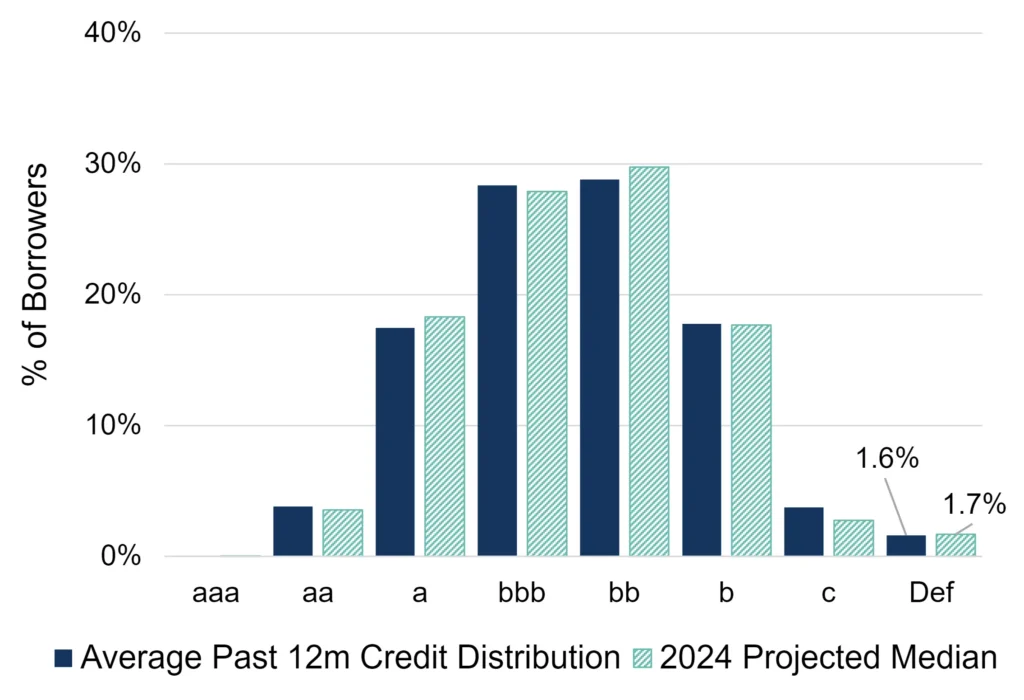
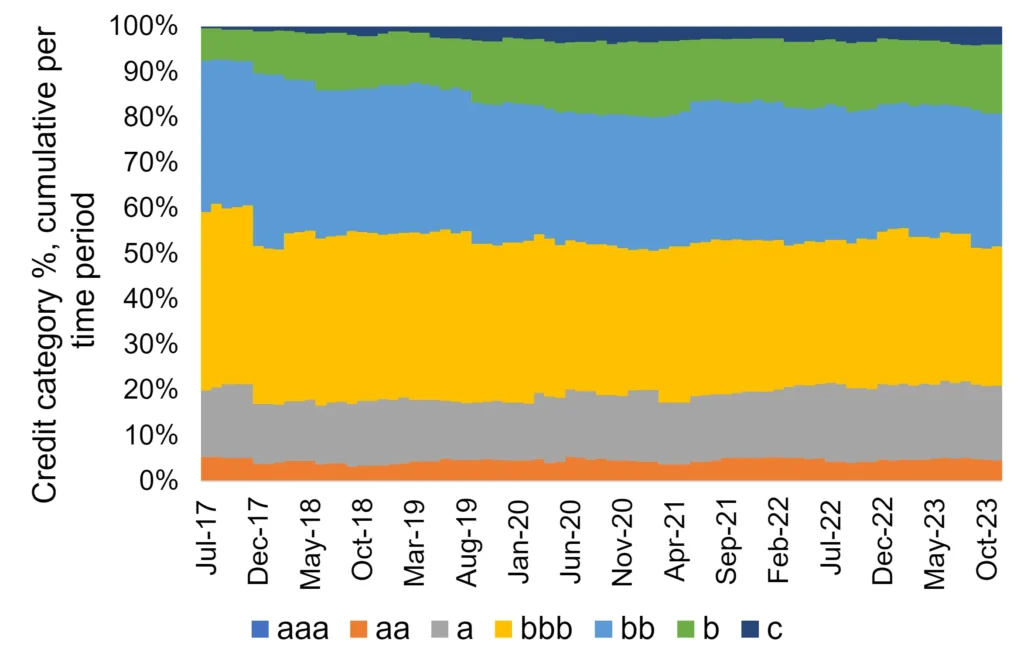
Credit distribution by ratings category
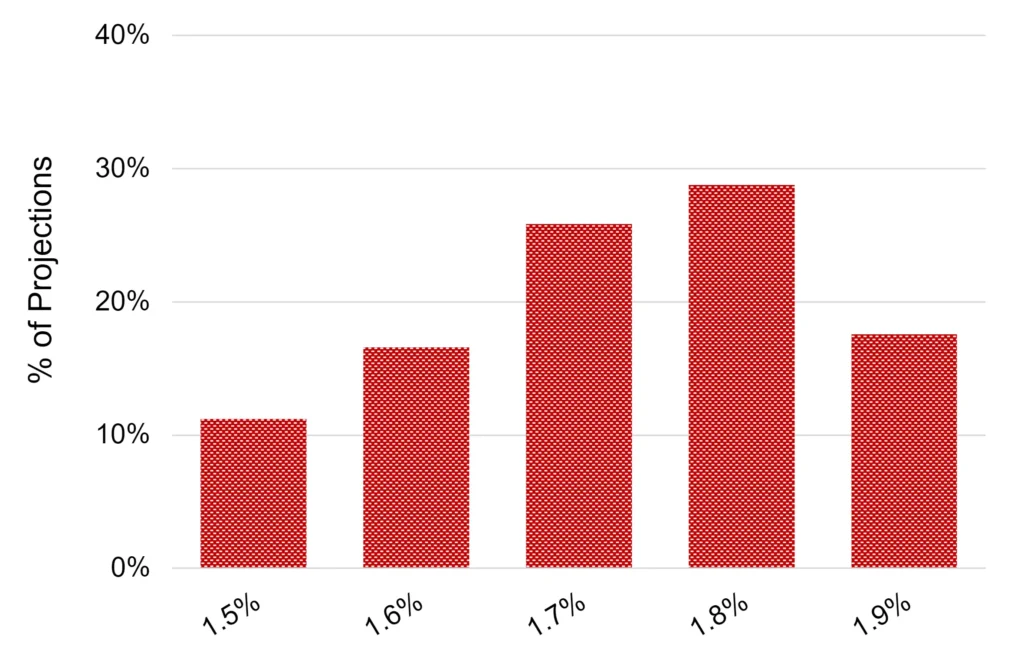
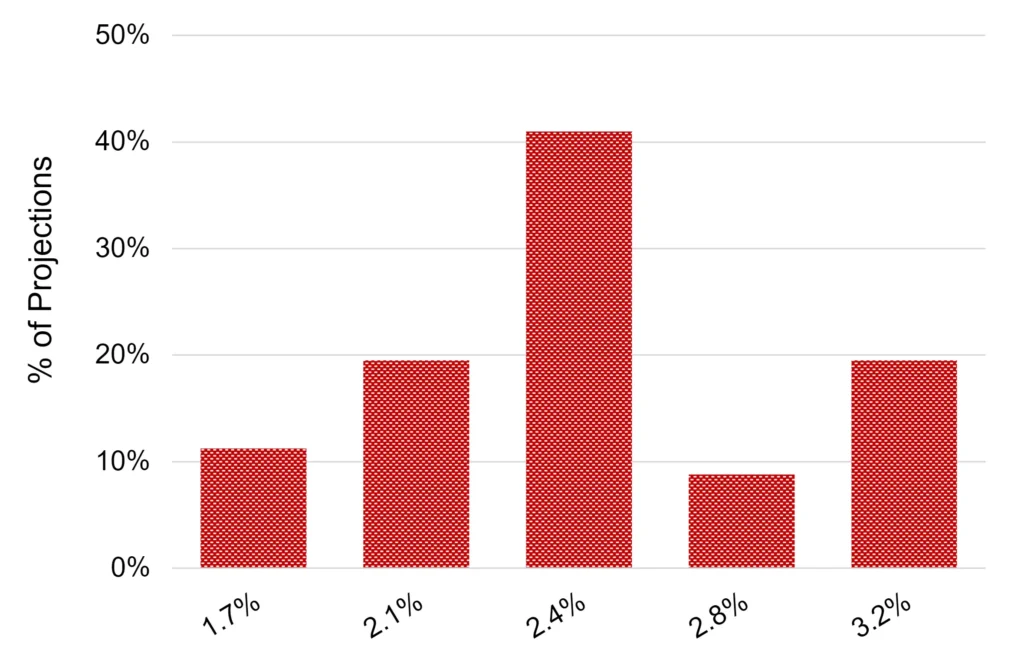
Projected 2024 default rate
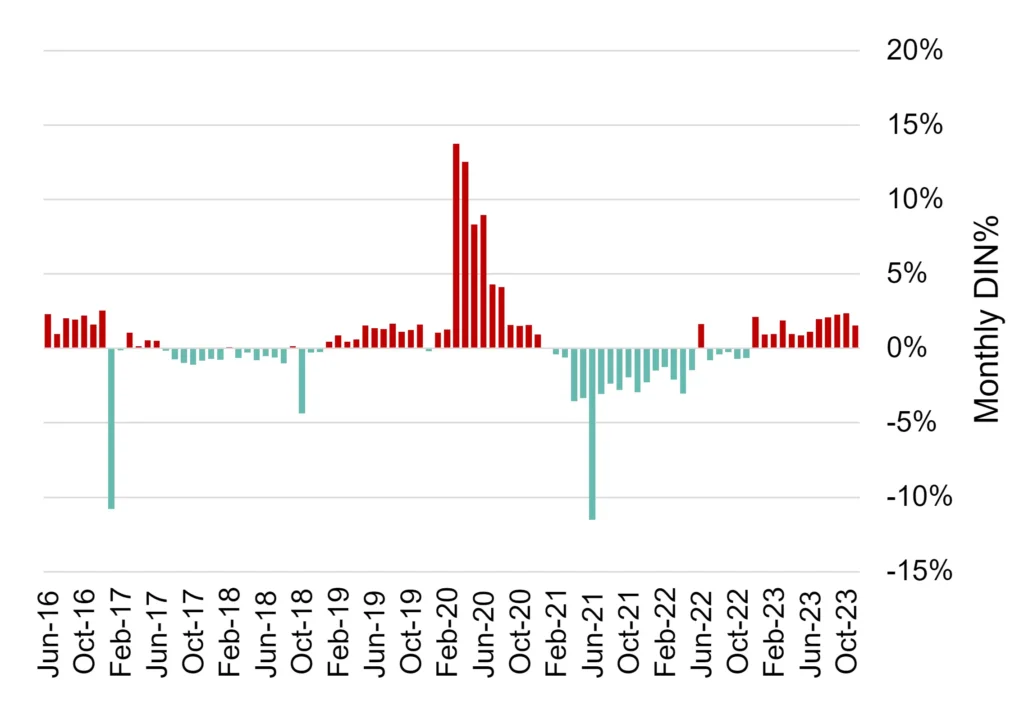
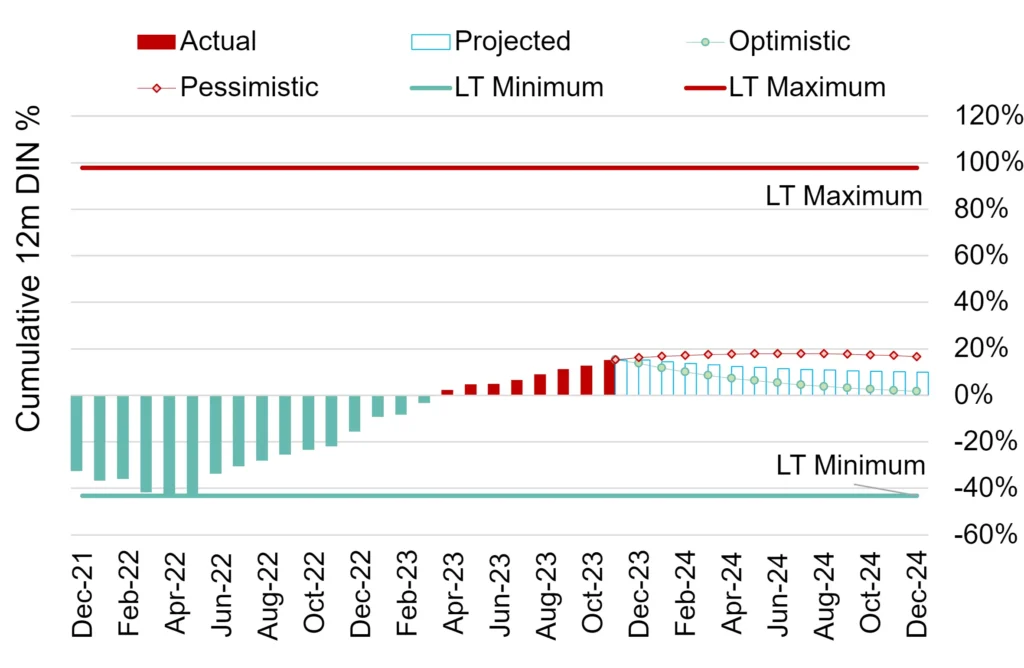
Monthly balance of deteriorations vs improvements / number of entities
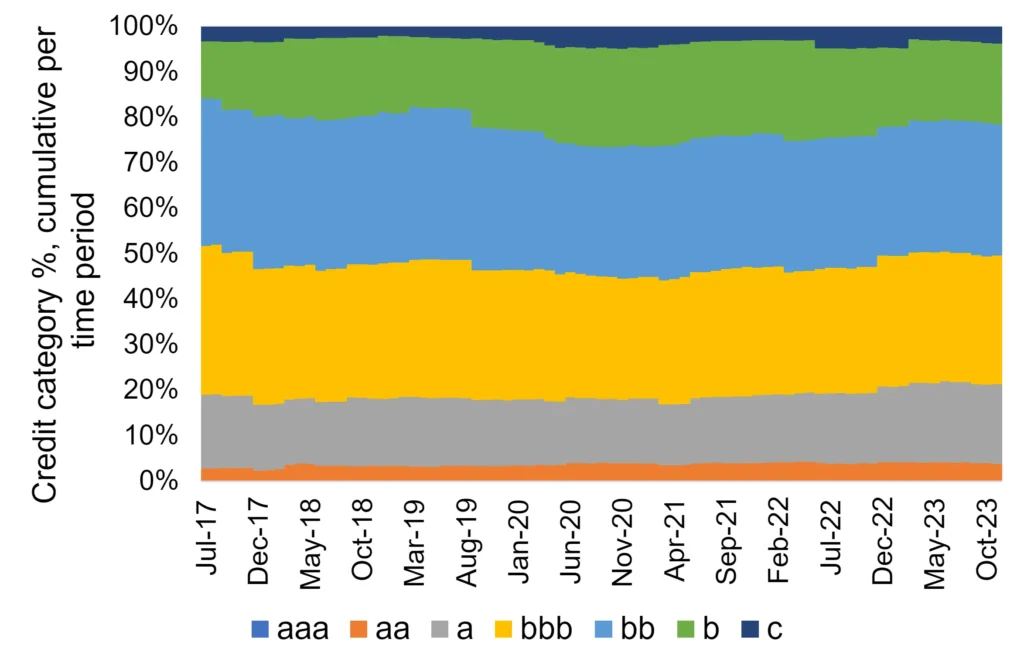
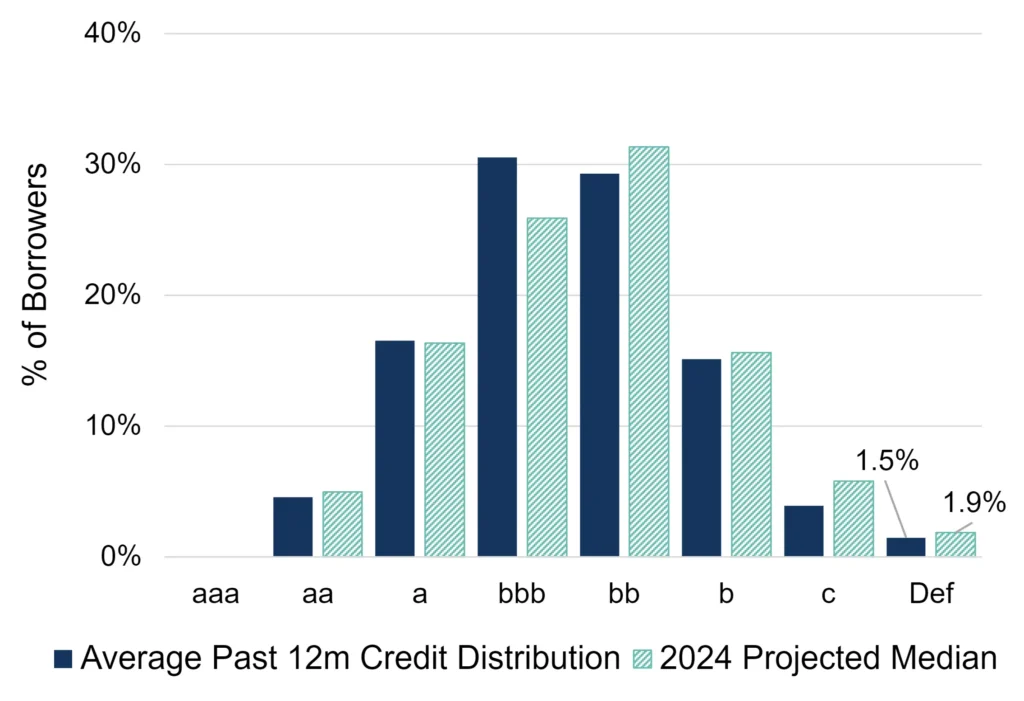
Distribution of entities across rating categories (%)
Key Takeaways
- We predict that default^ risks for US corporates will rise minimally in 2024 and peak mid-year. Our range of projections indicate that a default level of 1.7% – 1.8%, up from 1.6% currently (as of 1/1/2024), is the most likely.
- A recovery for US corporates is possible in H2 2024 given that the current credit deterioration (as of 1/1/2024) is likely to dissipate after default risks have peaked. We expect fewer Fallen Angels¹ and improvements in creditworthiness signalled by buoyant stock prices and recovering profits.
- The proportion of borrowers in the “c” rating category will trend lower in 2024. This category has ballooned since mid-2022, suggesting that more defaults are likely in H1 2024 – followed by improvements in H2.
- Our aggregated consensus ratings cover 5,055 US non-financial corporates, 71% of which are not rated by a credit rating agency.
* Covering all corporate sectors, including those discussed in this report, but excluding financial institutions.
^ Default Risk is defined as a weighted average of S&P long-term observed default rates in each rating category, using the monthly sector credit breakdown as weights derived from contributed bank data.
¹ Fallen angels are credits that have fallen from investment grade into the high-yield or speculative-grade category.
Outlook for US Financial Institutions
Post-Covid improving trend to stall on lower interest income, higher debt provisions
12-month balance of deteriorations vs improvements / number of entities
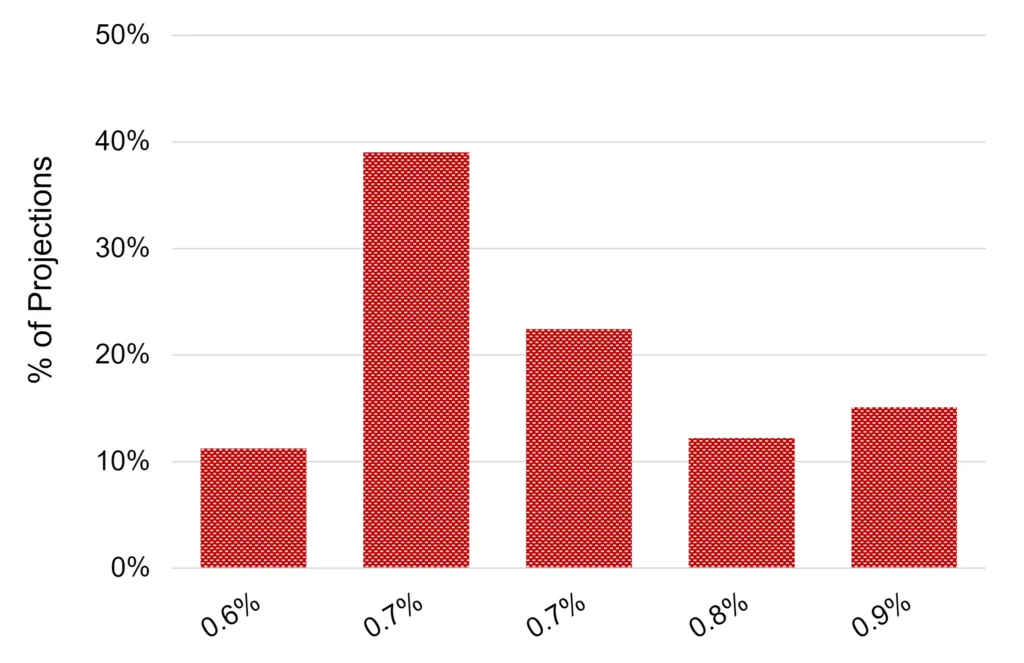
Projected 2024 default rate
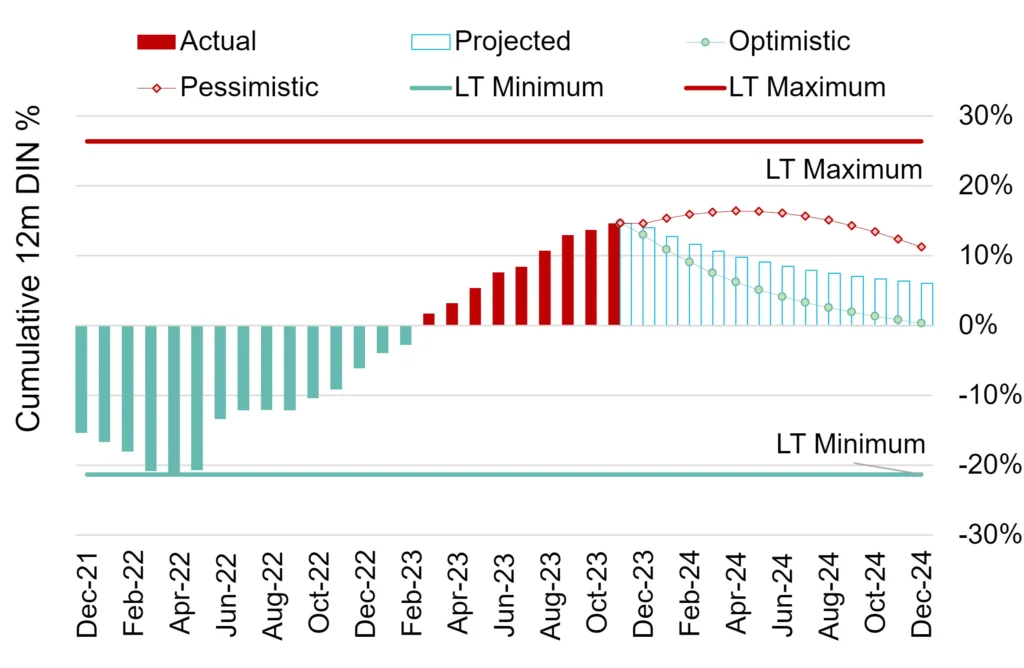
Long-term projected observed default rate (ODR)
Credit distribution by ratings category
Key Takeaways
- We predict that the post-Covid improving trend among FIs will plateau in H1 2024 as interest income drops and loan-loss provisions increase. The outlook has been deteriorating since the SVB collapse last year, but we expect this to have dissipated by the end of 2024.
- This sector’s current low default^ rate is likely to increase slightly during 2024. The proportion of firms in the “c” rating category remains very low, but projections imply a small increase in the “b” category.
- Our range of projections shows no scope for a fall in the default rate. There is a small likelihood (10%) of a spike to 0.9%, but a default rate of 0.7% is the most likely in 2024.
- Our aggregated consensus ratings cover 2,378 financial institutions in the US, 79% of which are not rated by a credit rating agency.
^ Default Risk is defined as a weighted average of S&P long-term observed default rates in each rating category, using the monthly sector credit breakdown as weights derived from contributed bank data.
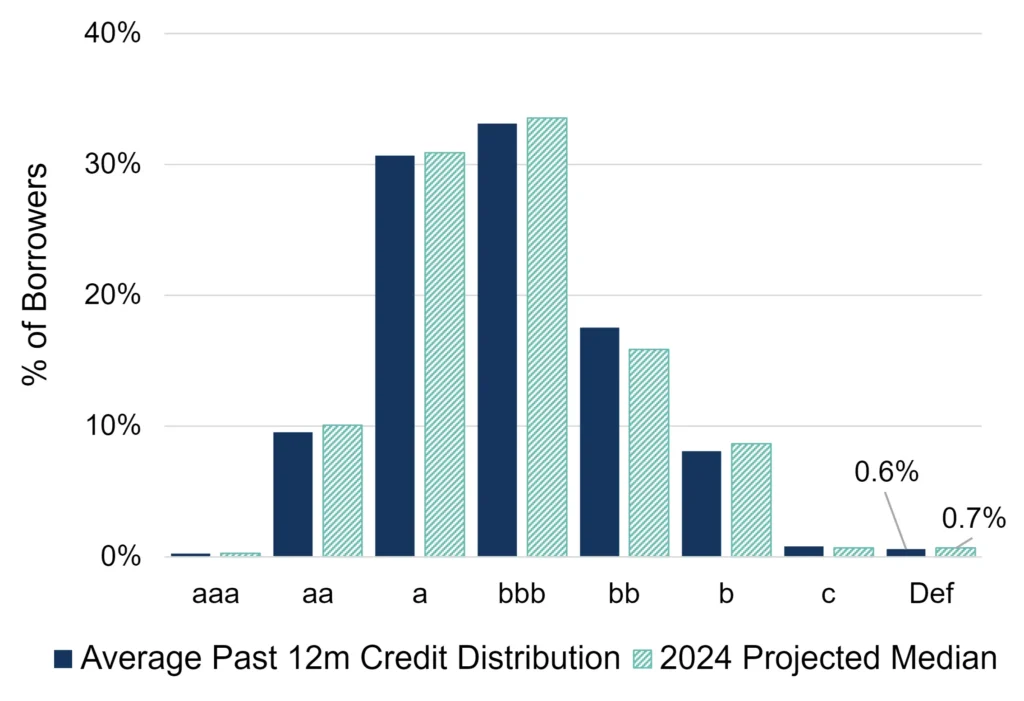
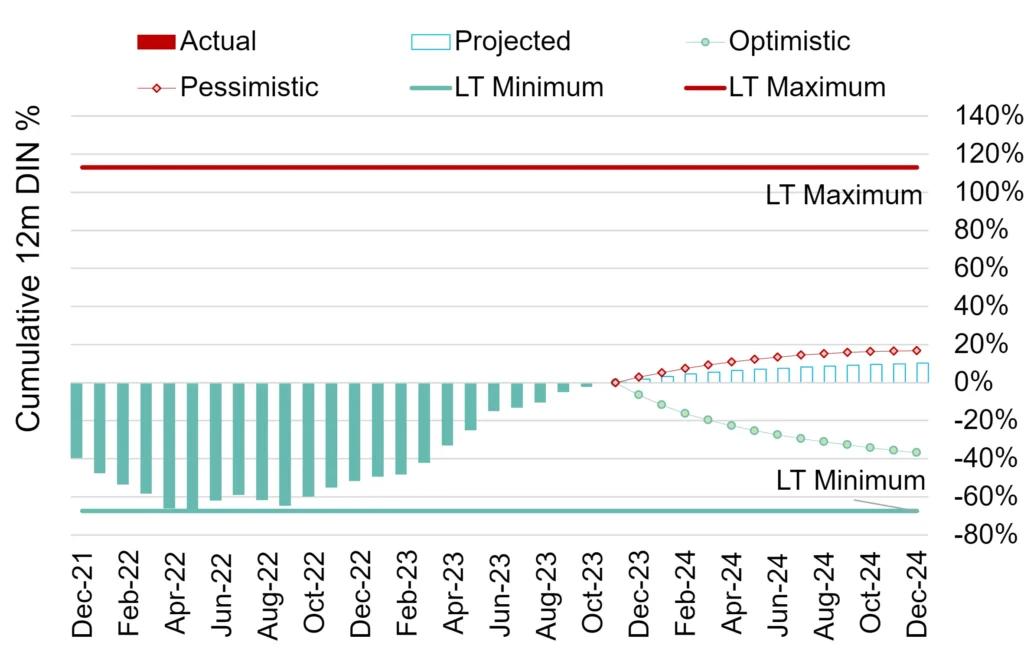
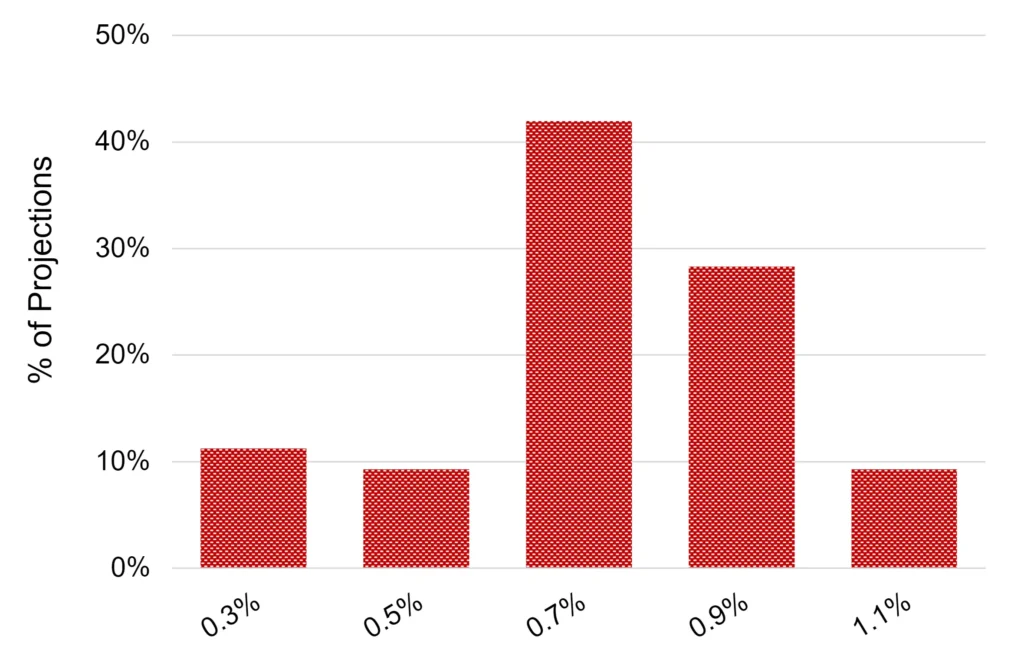
Outlook for US Oil & Gas
Creditworthiness to improve slightly in 2024, with further drop in default rate
12-month balance of deteriorations vs improvements / number of entities
Projected 2024 default rate
Long-term projected observed default rate (ODR)
Credit distribution by ratings category
Key Takeaways
- The already low default^ rate among US oil & gas companies is likely to drop further in 2024 – a positive outlier among US industries. Our long-term projections show that a drop from the current 1% default rate (as of 1/1/2024) to 0.7% is the most likely scenario (40%+). There is only a small likelihood (10%) of an increase in defaults to 1.1%.
- We also predict that more US oil & gas firms will move into investment-grade territory in 2024, swelling the ranks of the “a” and “bbb” rating categories. This trend has been driven by the war in Ukraine, although producers may ramp up output in 2024.
- The benign outlook for US oil & gas will persist regardless of the outcome of the US election – but Middle East instability could affect credit trends.
- Our aggregated consensus ratings cover 458 oil & gas companies in the US, 67% of which are not rated by a credit rating agency.
^ Default Risk is defined as a weighted average of S&P long-term observed default rates in each rating category, using the monthly sector credit breakdown as weights derived from contributed bank data.
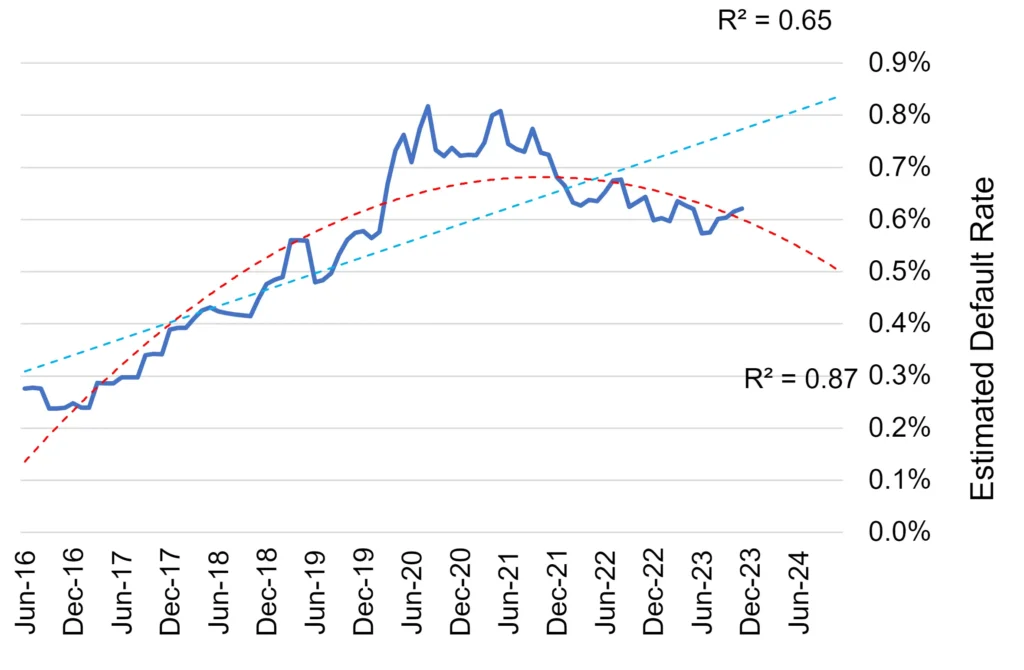
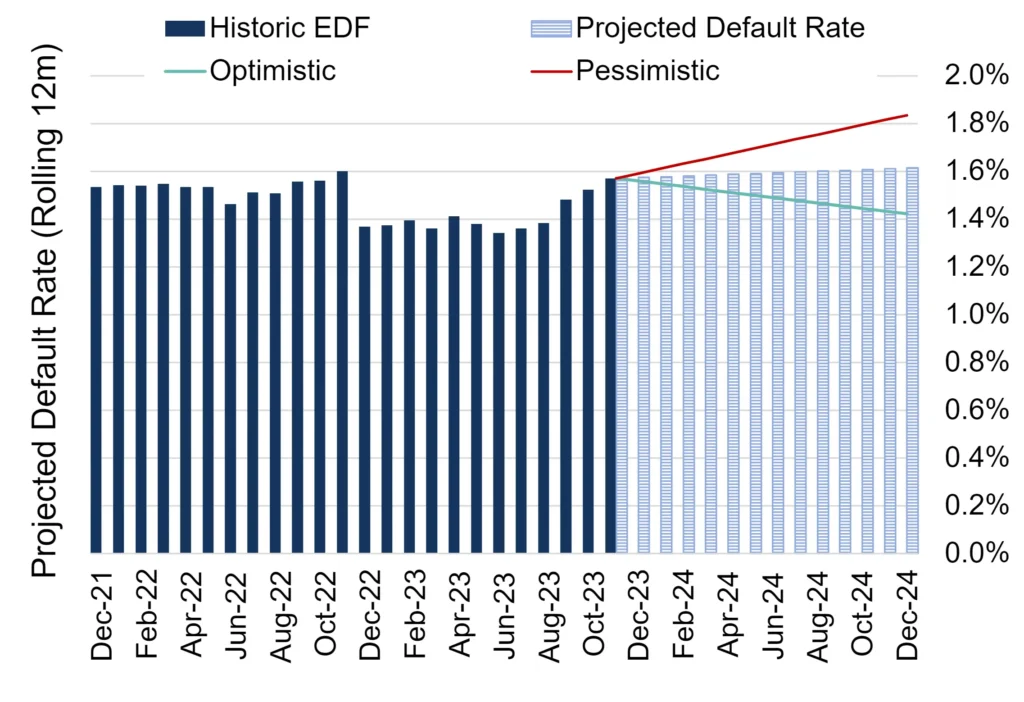
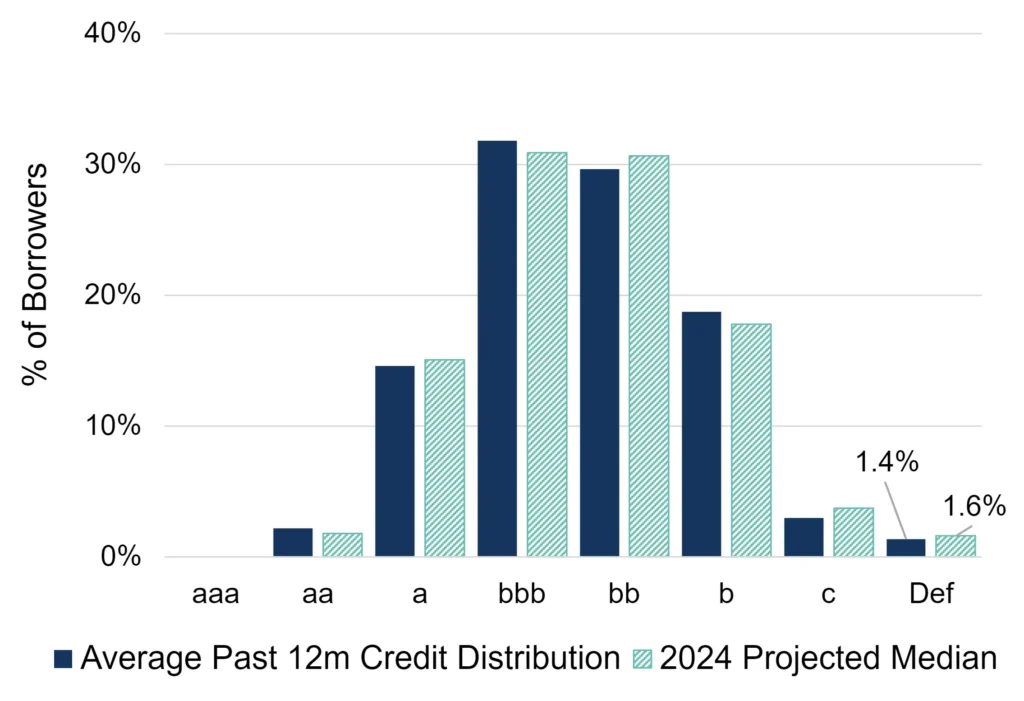
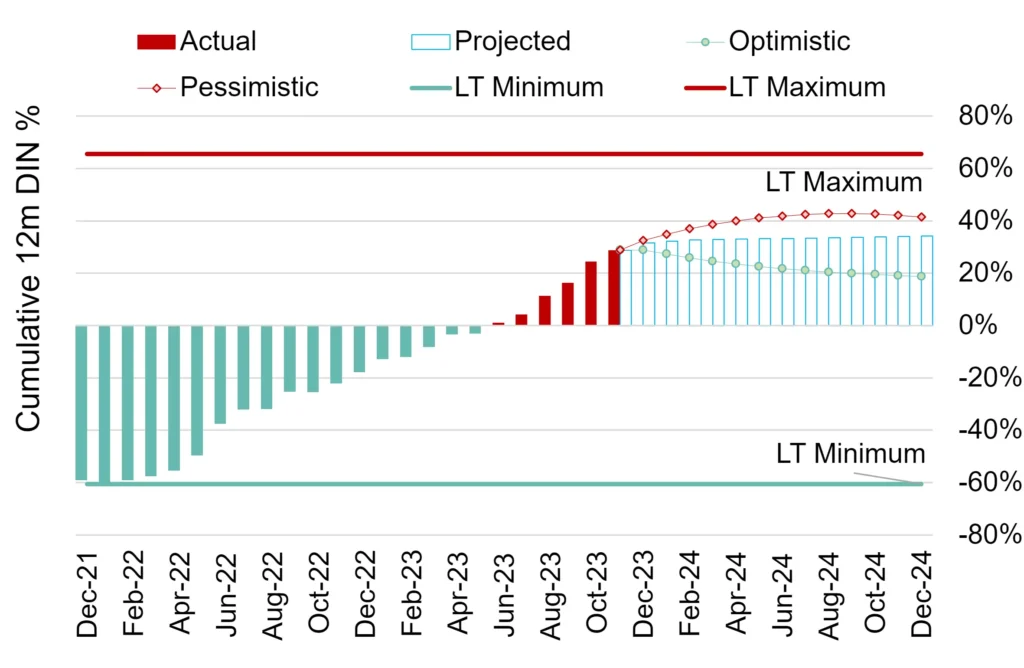
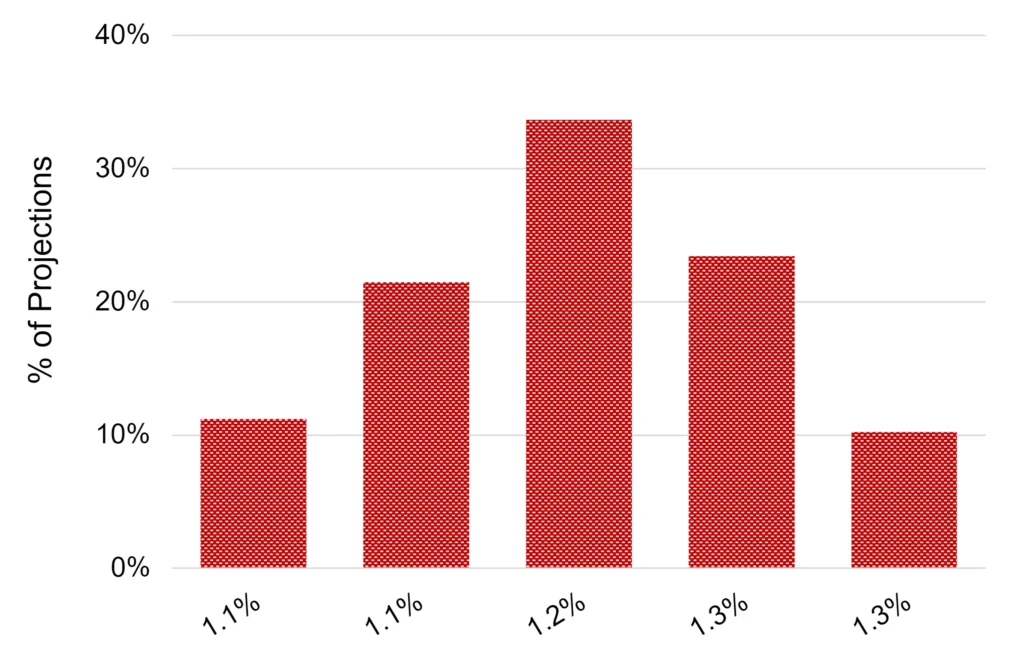
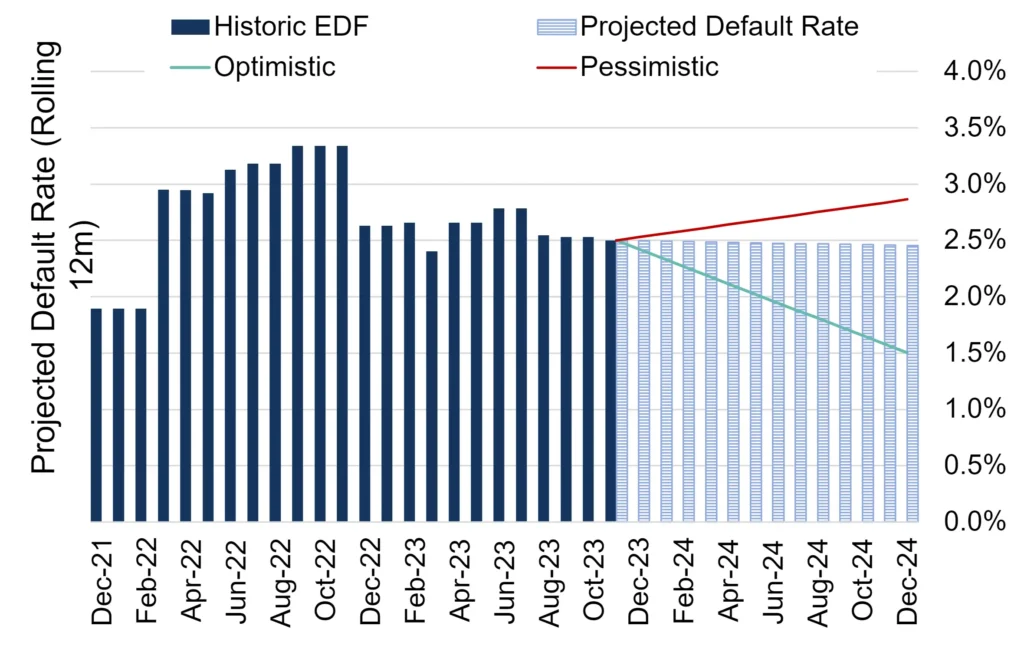
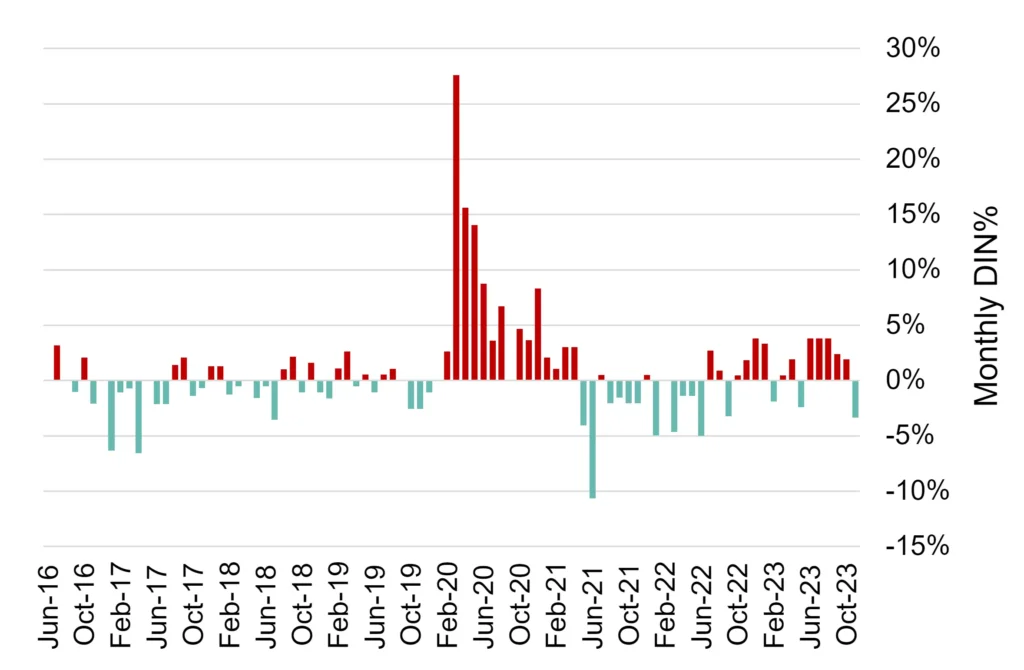
Outlook for US Industrials*
Deterioration bias easing in 2024 but modest rise in default risk amid slower growth
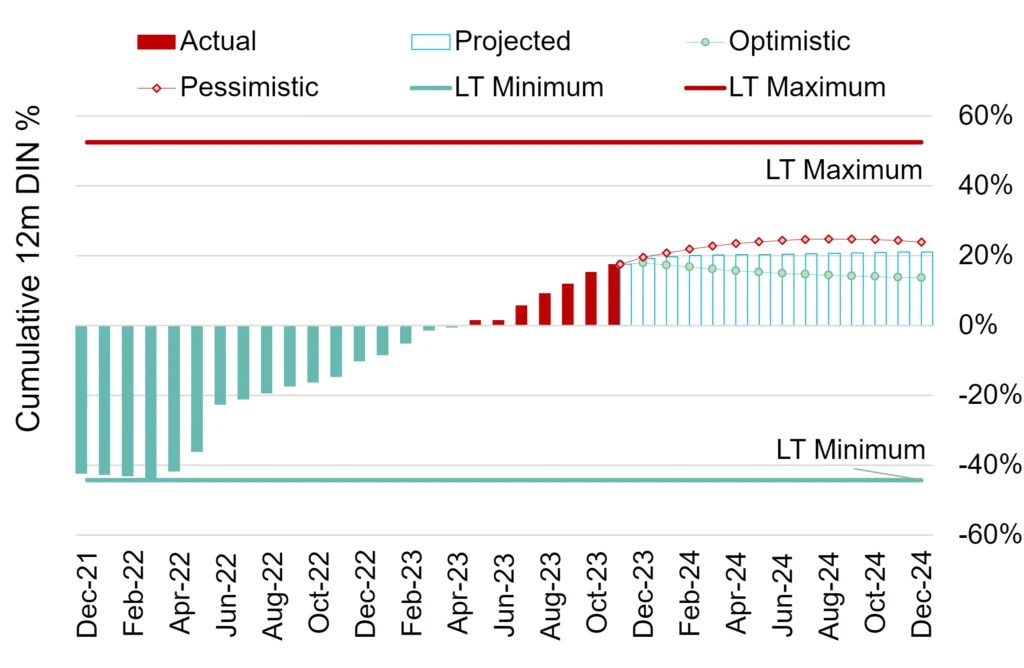
12-month balance of deteriorations vs improvements / number of entities
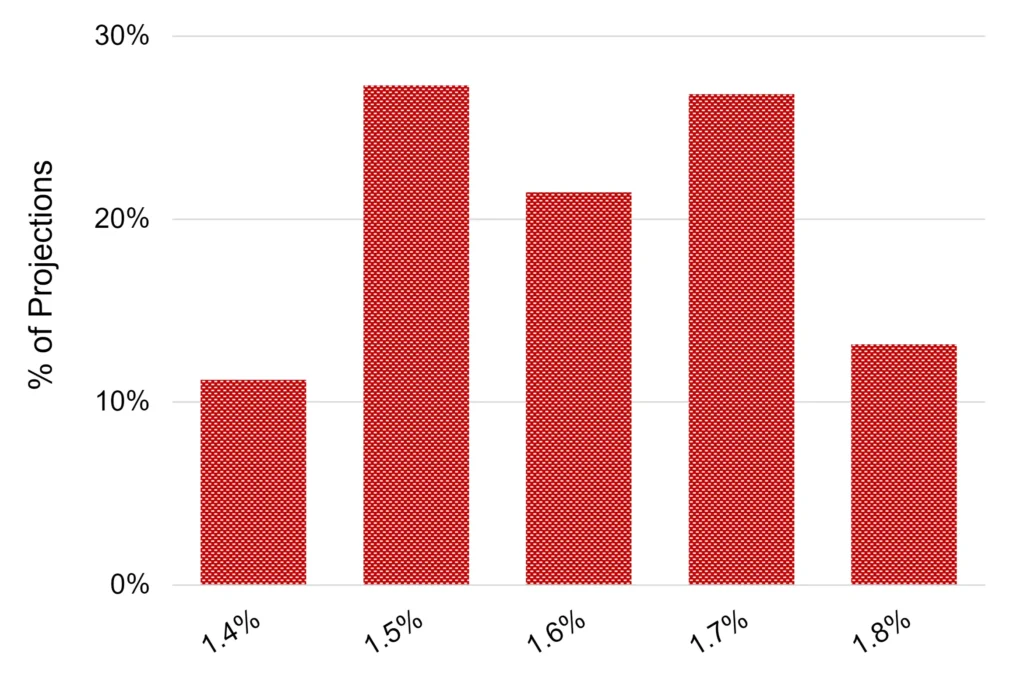
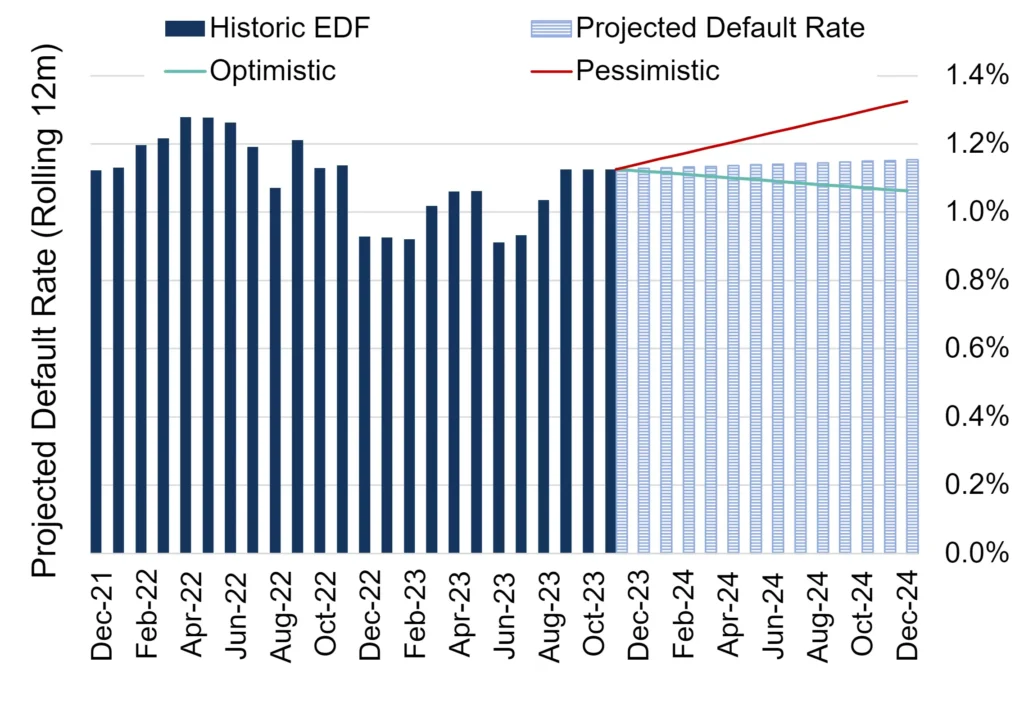
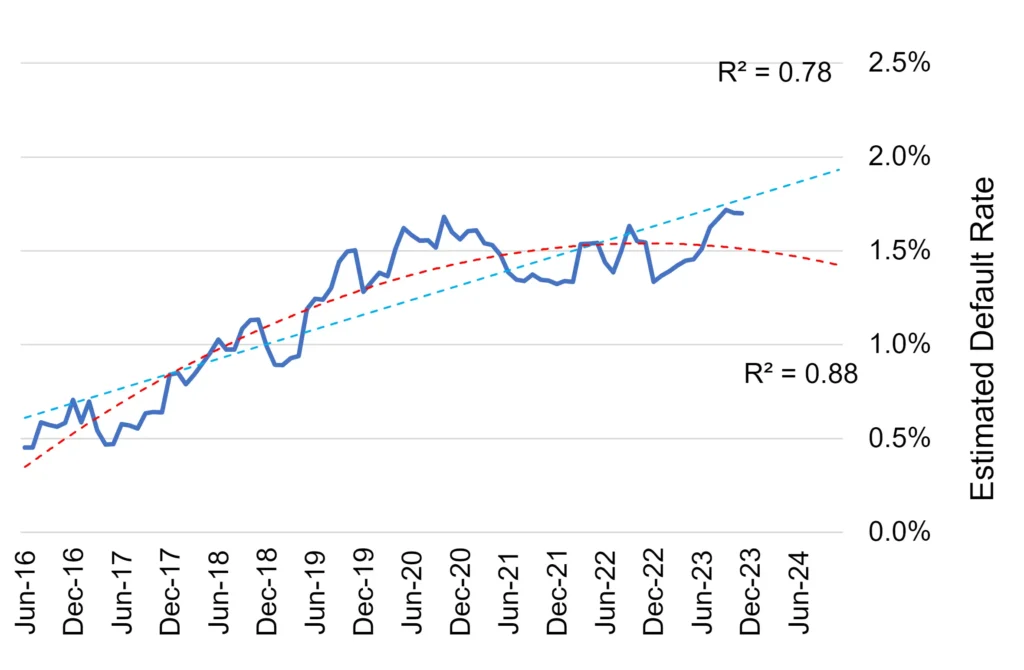
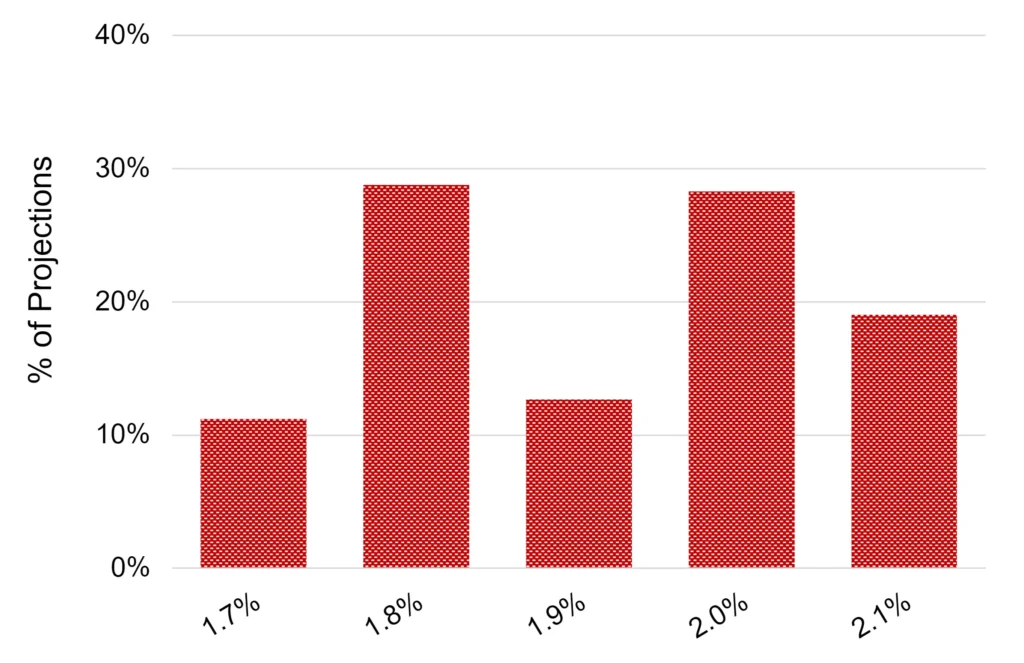
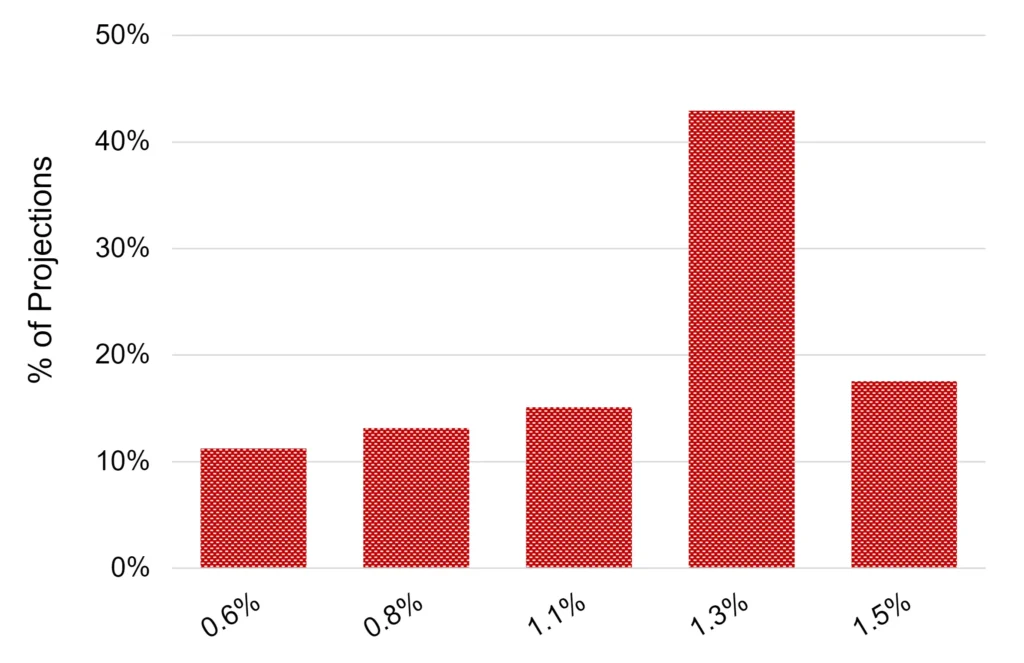
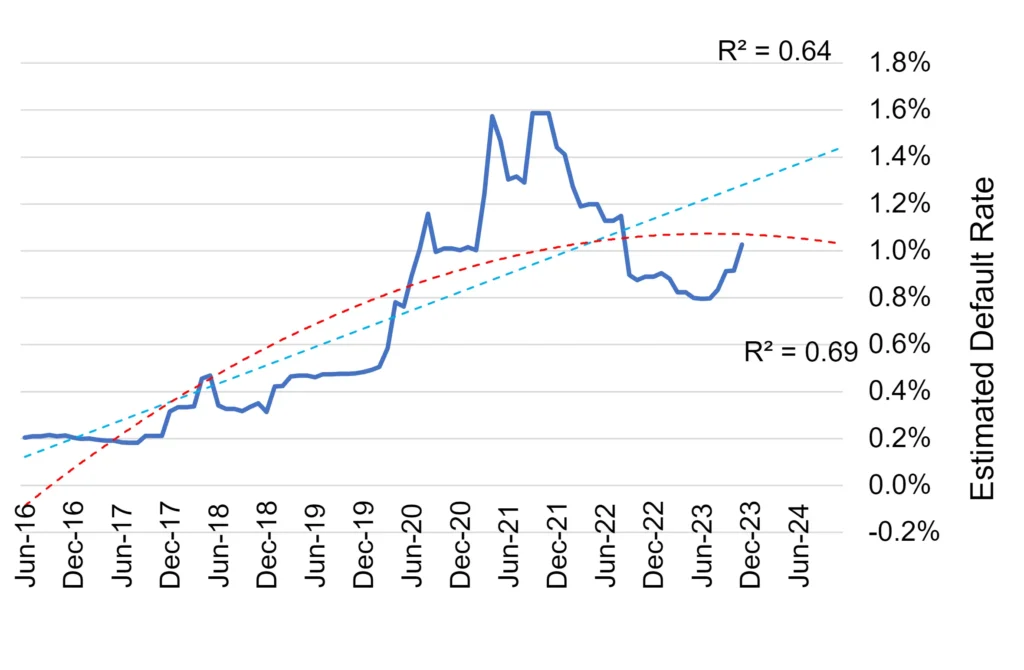
Projected 2024 default rate
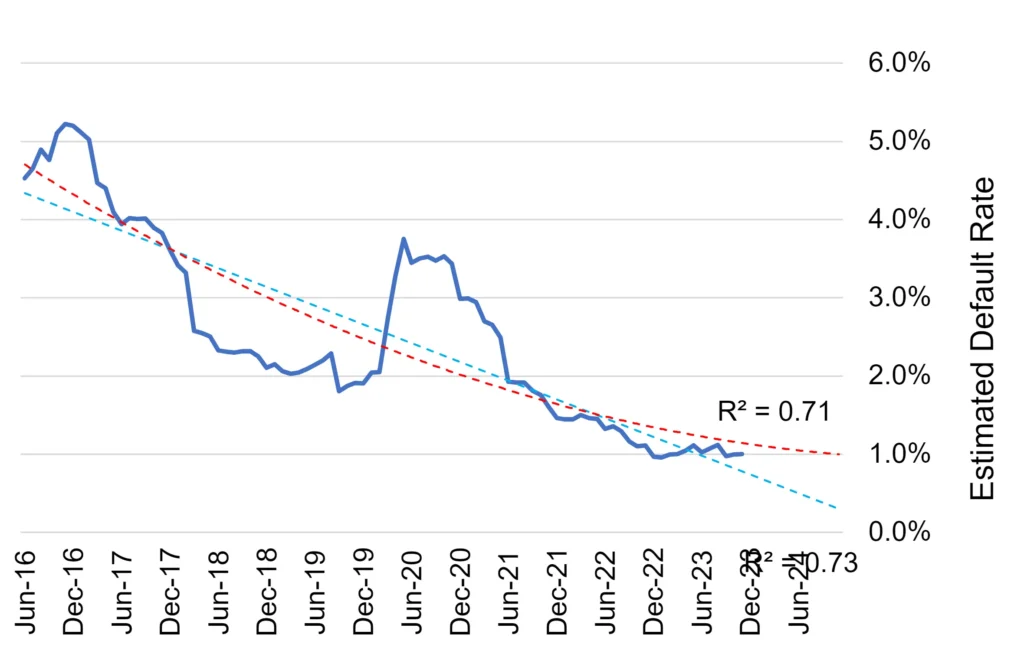
Projected default rate, rolling 12 months
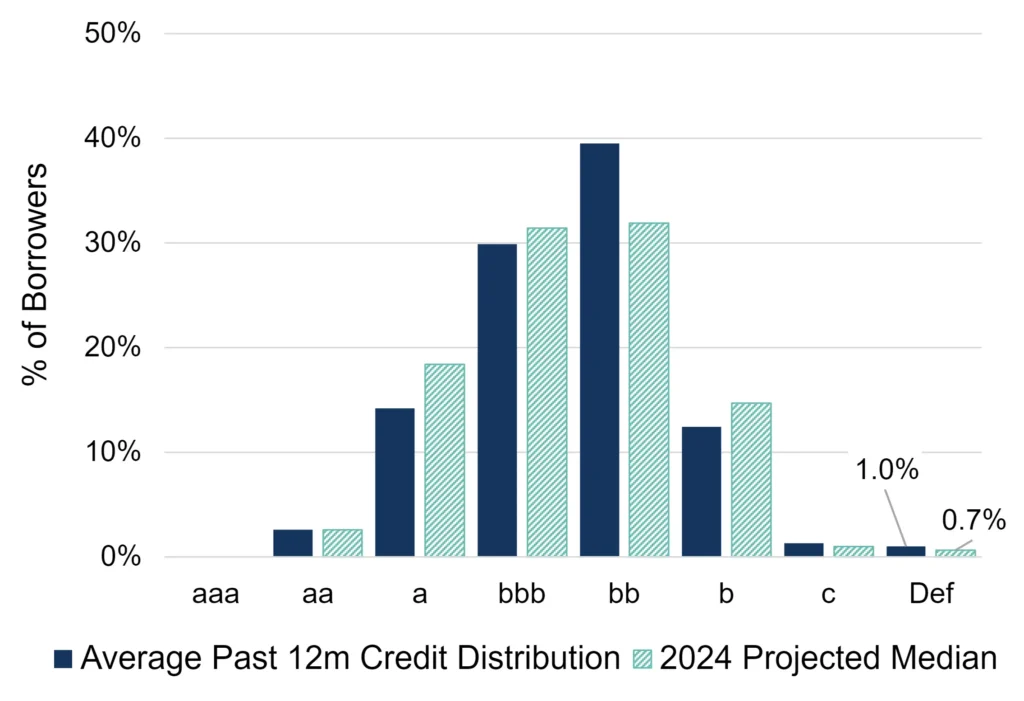
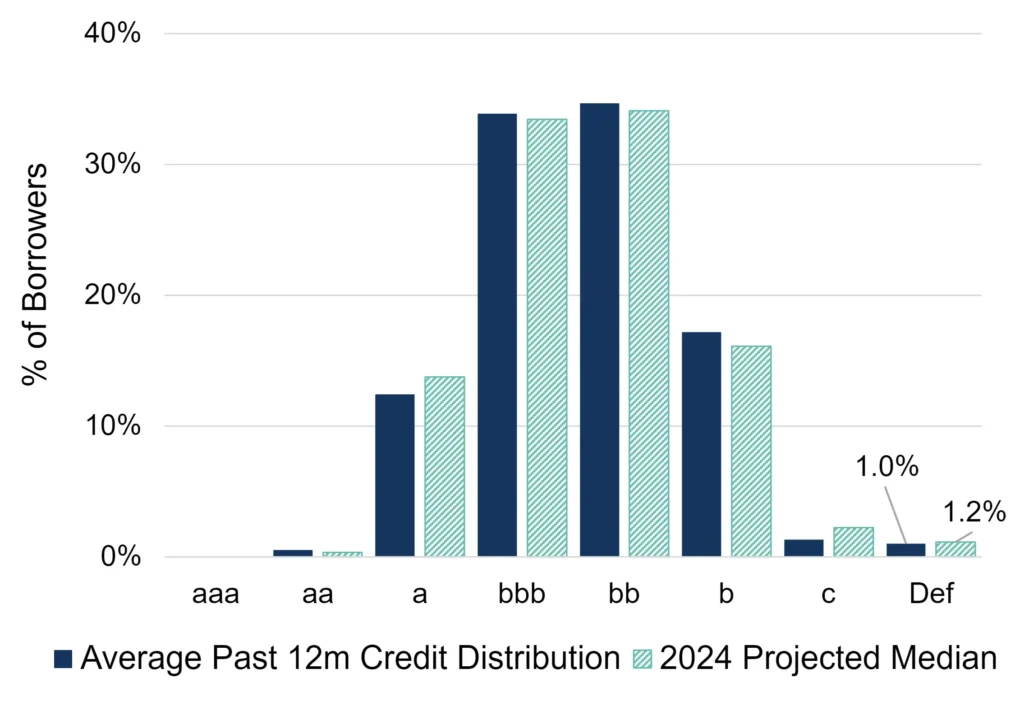
Credit distribution by ratings category
Key Takeaways
- Our central credit scenario is for the bellwether US industrial sector to stabilize in 2024 after a mixed 2023 during which deteriorations outnumbered improvements. However, our pessimistic scenario points to a possible continuation of the weakening trend until mid-2024.
- Our default^ risk projections point to a modest increase in 2024, with our central scenario positing an increase from 1.4% to 1.6%. Our pessimistic scenario projects a default rate of 1.8%+. Our range of projections imply no scope for a drop in risk in 2024 among US industrial companies.
- Our aggregated consensus ratings cover 1,238 industrial companies in the US, 77% of which are not rated by a credit rating agency.
* Covering the manufacture of industrial goods and services, e.g., constructions materials, aerospace, electronic equipment and components, defense equipment, railroads, marine transportation, industrial machinery, commercial vehicles and trucks, etc.
^ Default Risk is defined as a weighted average of S&P long-term observed default rates in each rating category, using the monthly sector credit breakdown as weights derived from contributed bank data.
Outlook for US Basic Materials*
Modest rise in default risk in 2024 despite strong demand in some sub-sectors
12-month balance of deteriorations vs improvements / number of entities
Projected 2024 default rate
Projected default rate, rolling 12 months
Credit distribution by ratings category
Key Takeaways
- We predict a modest increase in default^ risk among the basic materials industry in the US in 2024. Our central scenario points to a rise in default risk from the current level of 1% (as of 1/1/2024) to 1.2%.
- The range of our projections is narrow at 1.1% to 1.3%, with our central scenario for risk positioned very close to our optimistic scenario. However, the 12-month rolling balance of deteriorations vs improvements could be close to the long-term maximum – ahead of the positive effect of alternative energy drivers (lithium and uranium).
- Our aggregated consensus ratings cover 378 basic materials companies in the US, 74% of which are not rated by a credit rating agency.
* Covering the mining industries for aluminum, iron, steel, coal, gold platinum and precious metals, non-ferrous metals, as well as forestry and paper products.
^ Default Risk is defined as a weighted average of S&P long-term observed default rates in each rating category, using the monthly sector credit breakdown as weights derived from contributed bank data.
Outlook for US Consumer Goods
Default risk to climb in 2024, with rise in proportion of high-yield borrowers
Long-term projected observed default rate (ODR)
Projected 2024 default rate
Distribution of entities across rating categories (%)
Credit distribution by ratings category
Key Takeaways
- We predict a rise in default^ risk for the US consumer goods sector in 2024, even though our long-term default risk projections for the US consumer goods sector are mixed. Our range of projections cover a lower bound of 1.7% above the current 1.5% level (as of 1/1/2024), with a pessimistic projection at 2.1%.
- Our forecasts point to a continued rise in the proportion of US consumer goods companies in the “c” rating category in 2024, indicating that a spike in defaults is likely as the cost-of-living crisis continues to bite.
- Our aggregated consensus ratings cover 635 consumer goods companies in the US, 67% of which are not rated by a credit rating agency.
^ Default Risk is defined as a weighted average of S&P long-term observed default rates in each rating category, using the monthly sector credit breakdown as weights derived from contributed bank data.
Outlook for US Consumer Services
Sharp increase in default risk likely in 2024 amid fall in discretionary spend
12-month balance of deteriorations vs improvements / number of entities
Projected 2024 default rate
Projected default rate, rolling 12-month
Credit distribution by ratings category
Key Takeaways
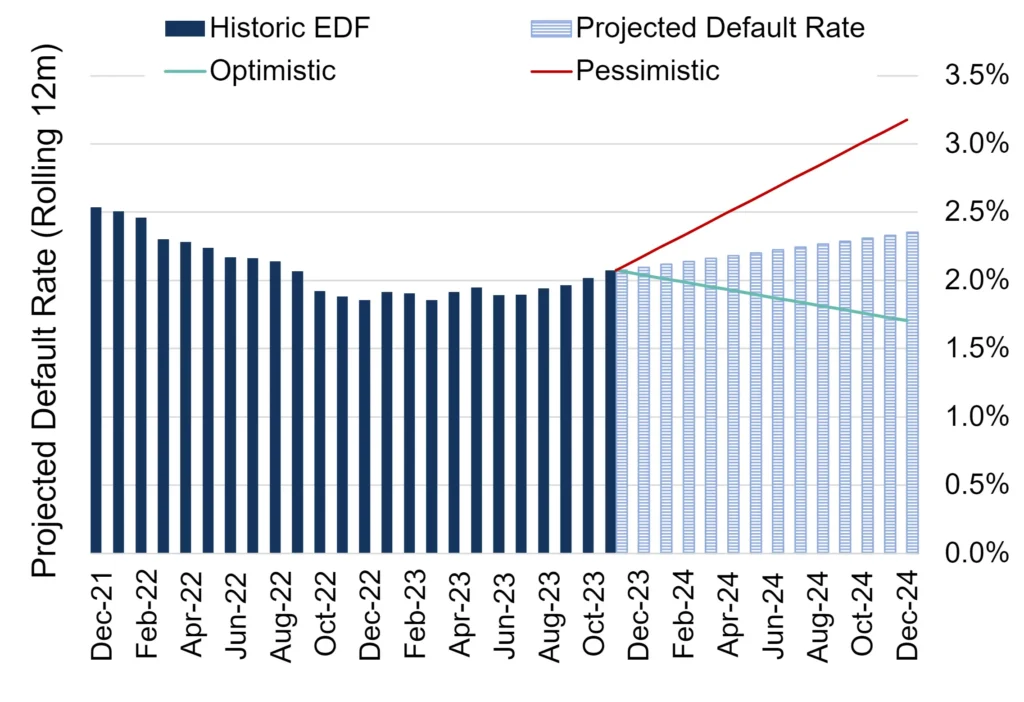
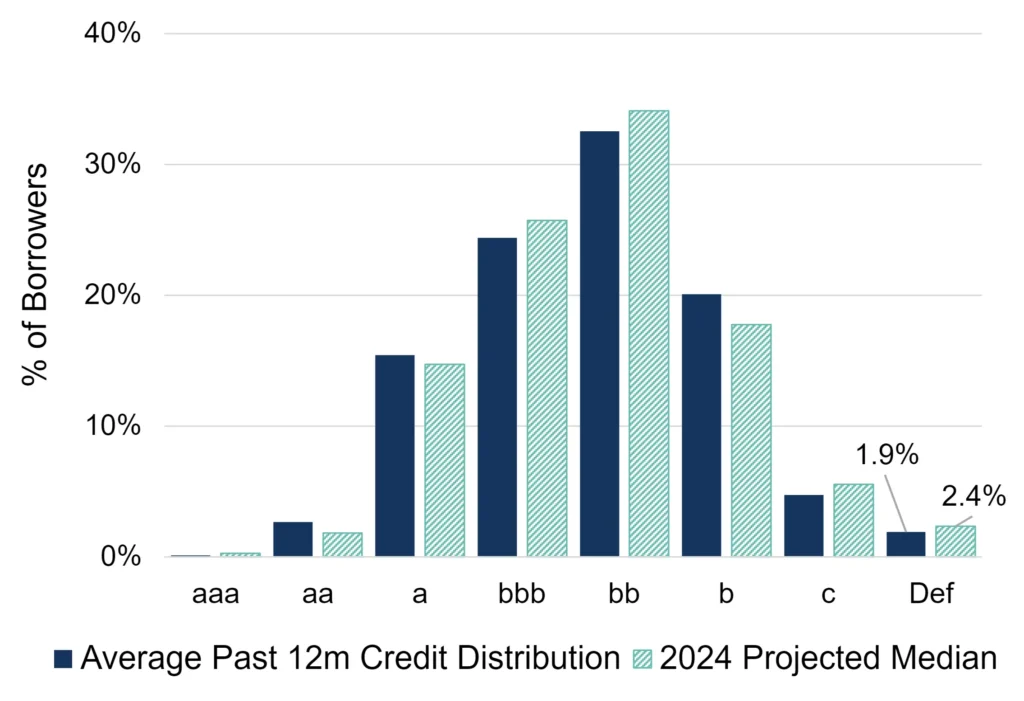
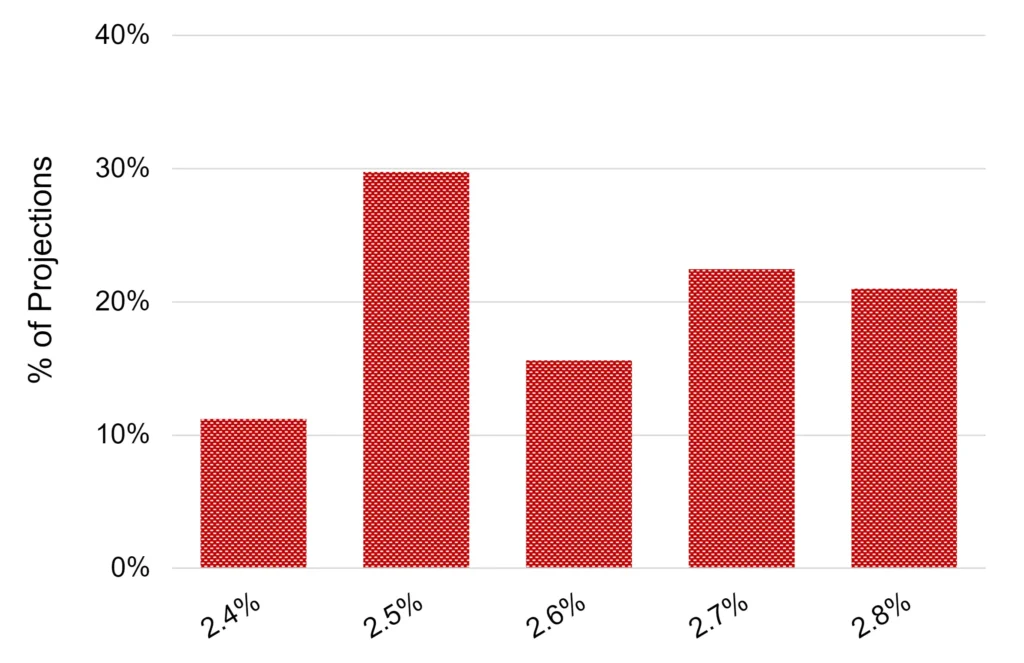
- Our central scenario for the US consumer services sector points to a significant increase in risk, with the current level of 1.9% (as of 1/1/2024) projected to rise to 2.4% during 2024. Our pessimistic scenario points to a possible rise in the default^ rate to above 3%.
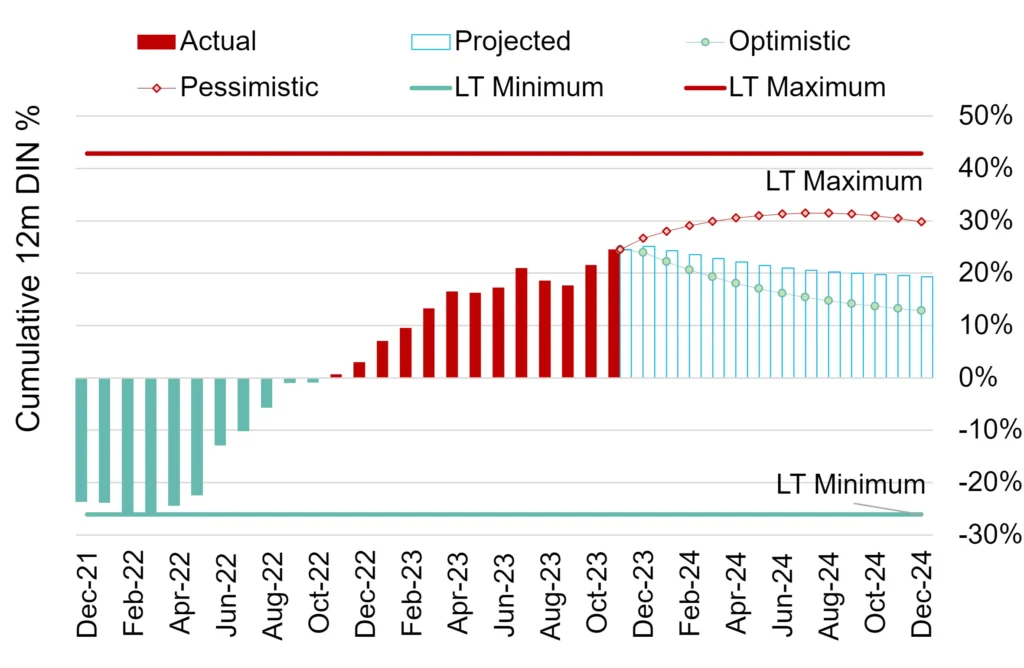
- The net balance of deteriorations in creditworthiness outnumbered improvements during 2023 but remains far below the long-term maximum. A further decline in discretionary spend could weigh on creditworthiness.
- Our aggregated consensus ratings cover 861 consumer services companies in the US, 70% of which are not rated by a credit rating agency.
^ Default Risk is defined as a weighted average of S&P long-term observed default rates in each rating category, using the monthly sector credit breakdown as weights derived from contributed bank data.
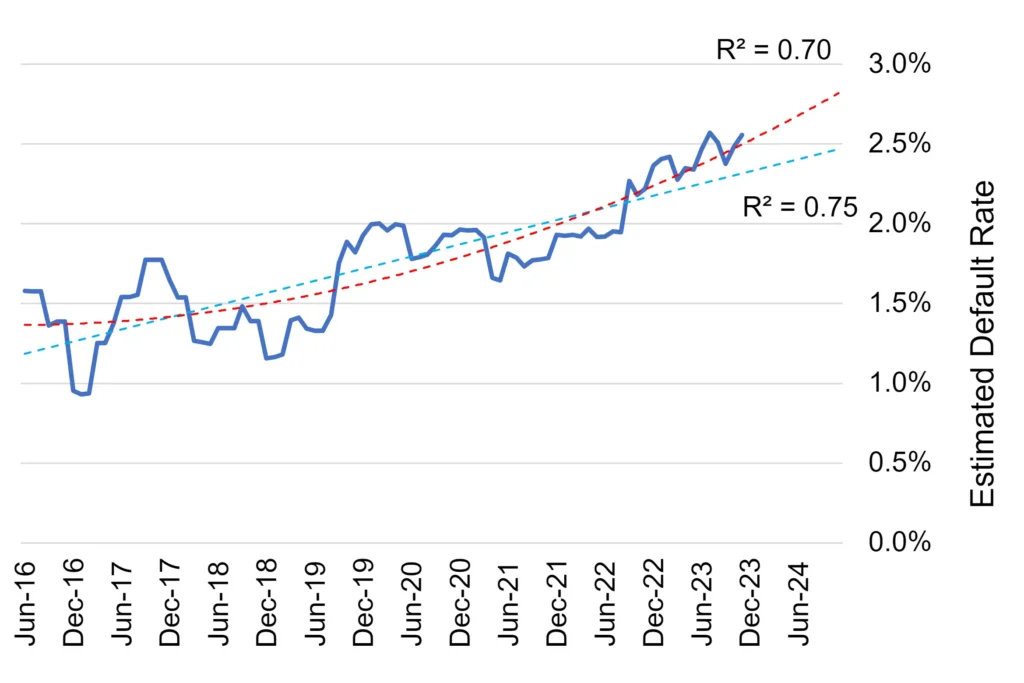
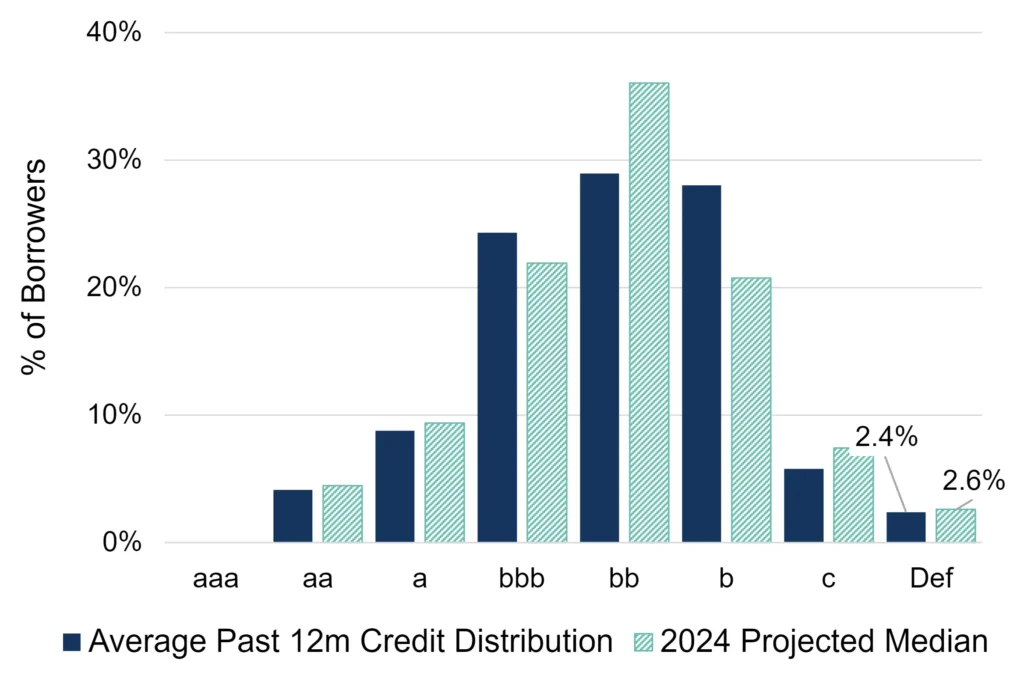
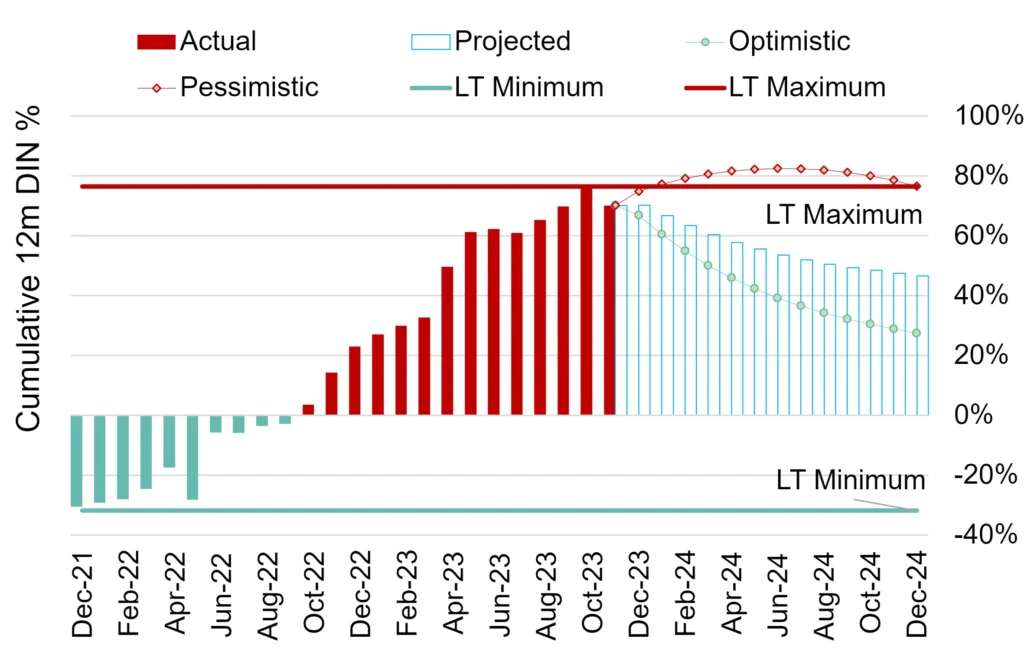
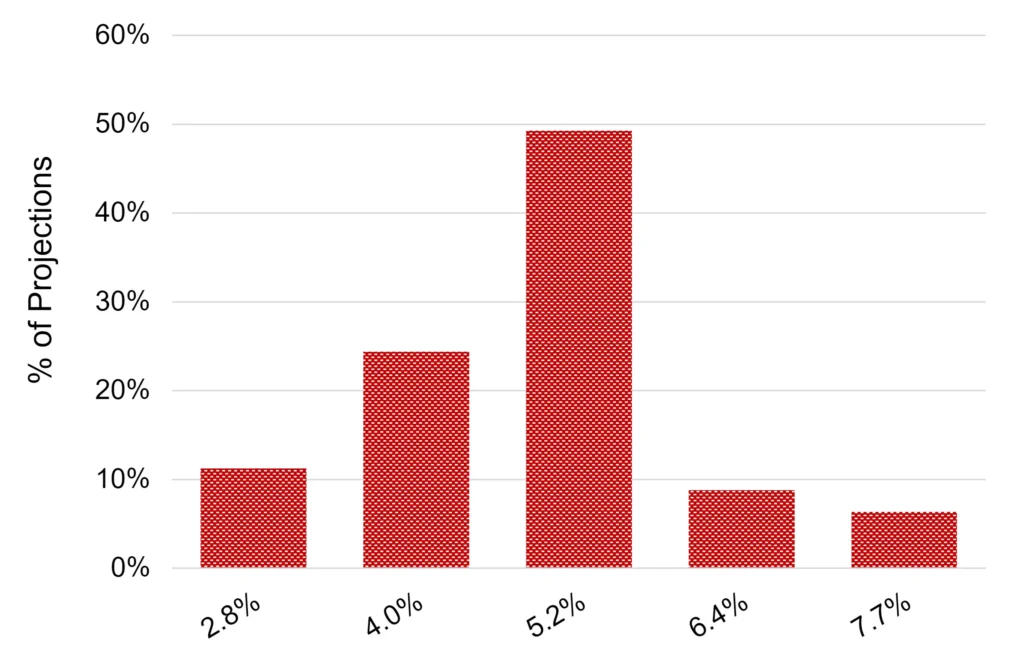
Outlook for US Technology
Default risk to rise modestly in 2024 amid slowing tech investment
12-month balance of deteriorations vs improvements / number of entities
Projected 2024 default rate
Long-term projected observed default rate (ODR)
Credit distribution by ratings category
Key Takeaways
- We predict that the US technology sector will record a modest increase in default^ risk in 2024. Our central scenario projects a rise from the current high level of risk of 2.4% (as of 1/1/2024) to 2.6% during 2024, with a 20% likelihood of risk hitting 2.8% under our pessimistic scenario.
- The balance of deteriorations vs. improvements has been rising rapidly in recent years. We predict that this ratio will peak in 2024 before reaching a long-term maximum, implying that further downgrades lie ahead. Over the long term, both linear and non-linear projections suggest continued new highs in default risks.
- Our aggregated consensus ratings cover 432 technology companies in the US, 67% of which are not rated by a credit rating agency.
^ Default Risk is defined as a weighted average of S&P long-term observed default rates in each rating category, using the monthly sector credit breakdown as weights derived from contributed bank data.
Outlook for US Telecoms
Significant increase in default risk given uncertainty over network battles and M&A
12-month balance of deteriorations vs improvements / number of entities
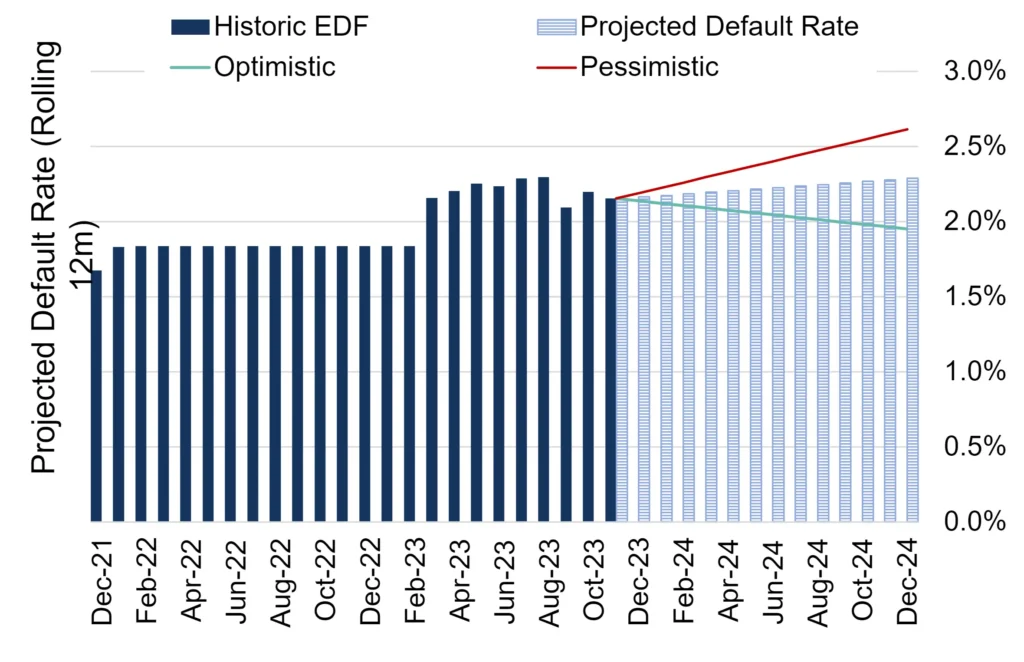
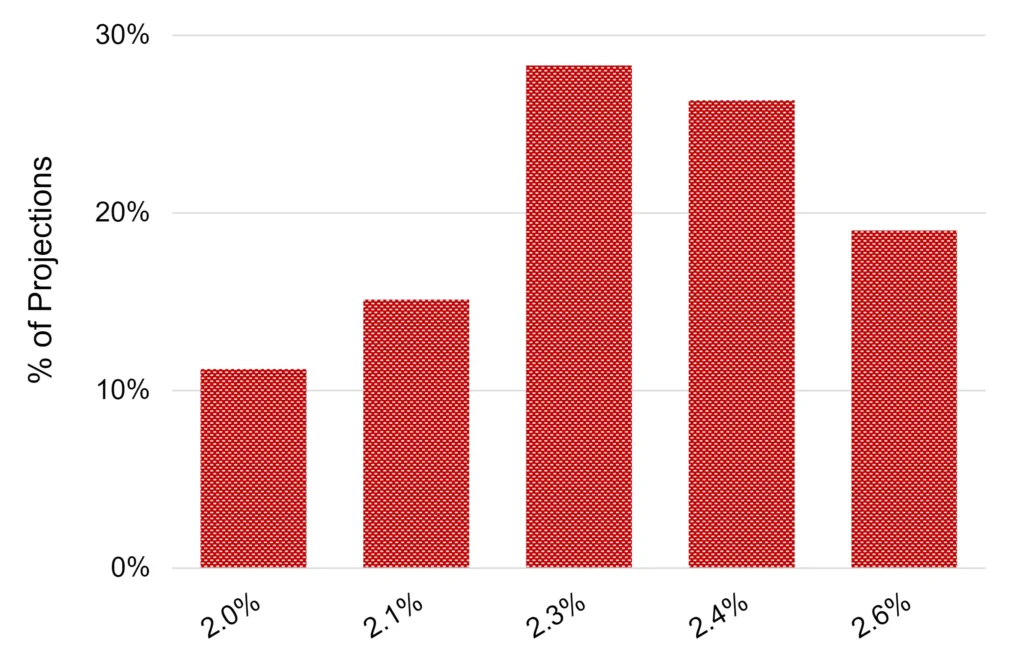
Projected 2024 default rate
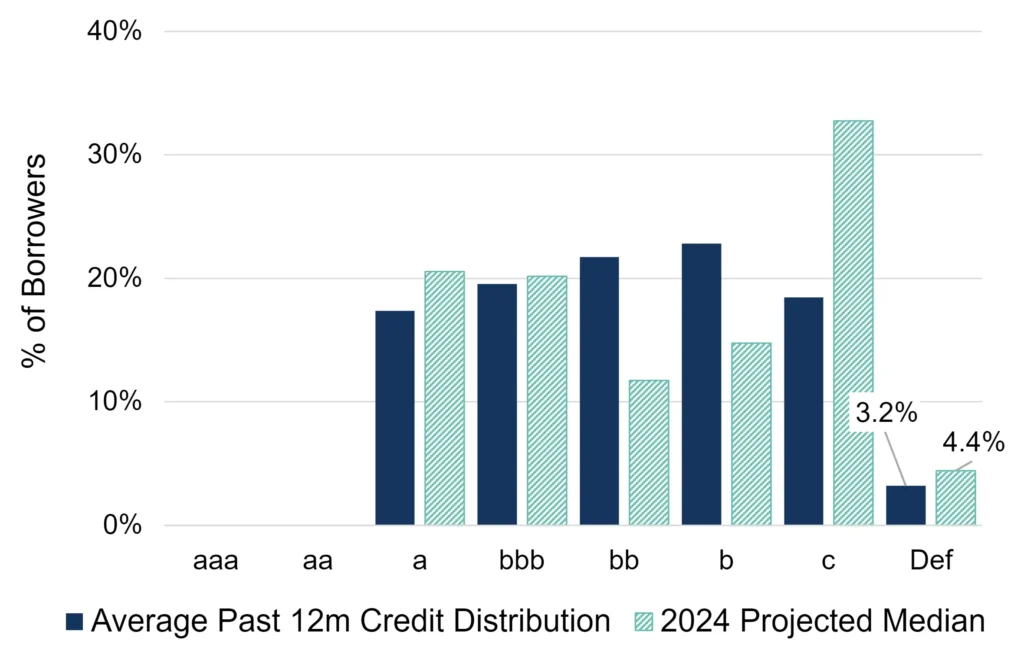
Distribution of entities across rating categories (%)

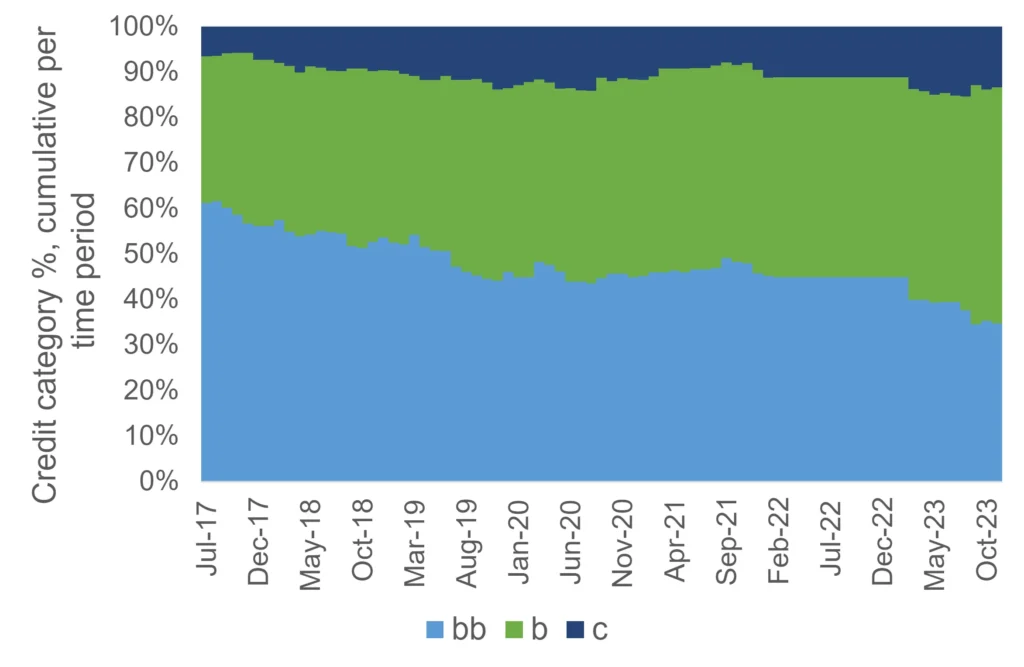
Credit distribution by ratings category
Key Takeaways
- We predict a significant increase in default^ risk for the US telecoms sector in 2024. Our central scenario posits a spike in the already very high current level of 3.2% (as of 1/1/2024) to median 4.4% this year. The range of our long-term projections is skewed towards higher risk, with a small (10%) likelihood that it reaches 6.4% or more.
- There is a clear divergence in this sector, with a sharp rise in the proportion of borrowers in both the “c” and “a” rating categories, suggesting clear winners and losers. But the central trend is downwards, suggesting that the shakeout in telecoms may run its course this year.
- Our aggregated consensus ratings cover 92 US telecoms companies, 66% of which are not rated by a credit rating agency.
^ Default Risk is defined as a weighted average of S&P long-term observed default rates in each rating category, using the monthly sector credit breakdown as weights derived from contributed bank data.
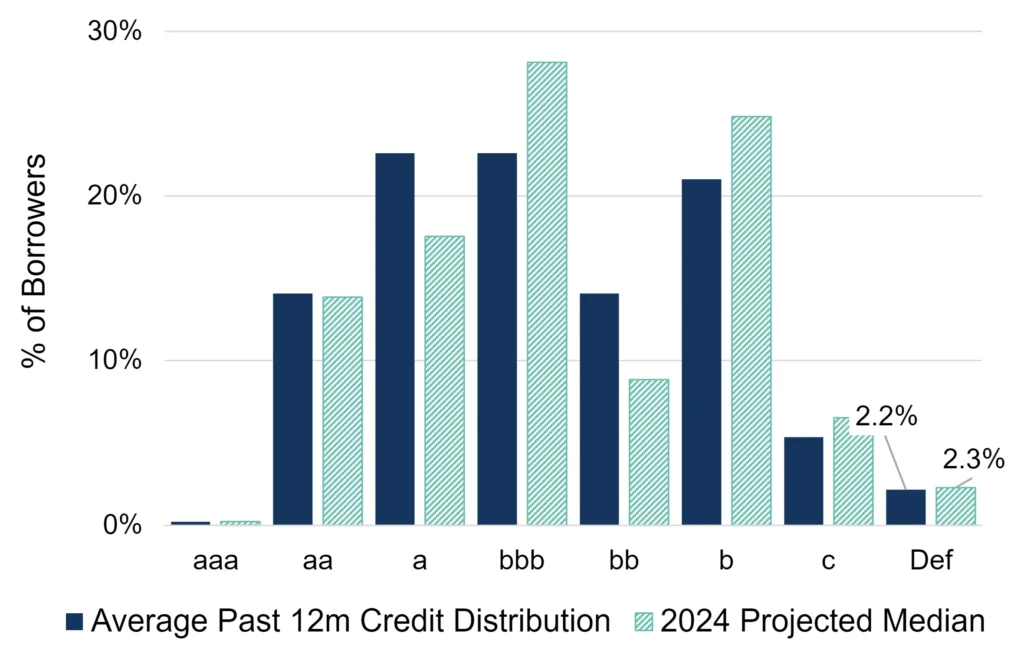
Outlook for US Health Care
Default risk to nudge up as sector’s share of GDP growth shrinks
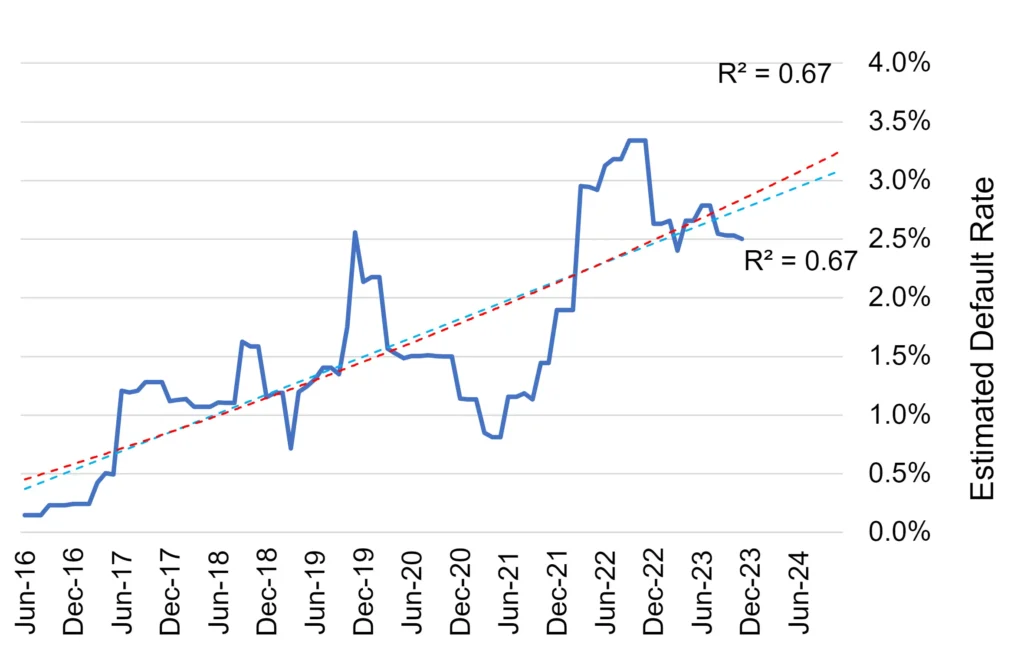
Projected default rate, rolling 12-month
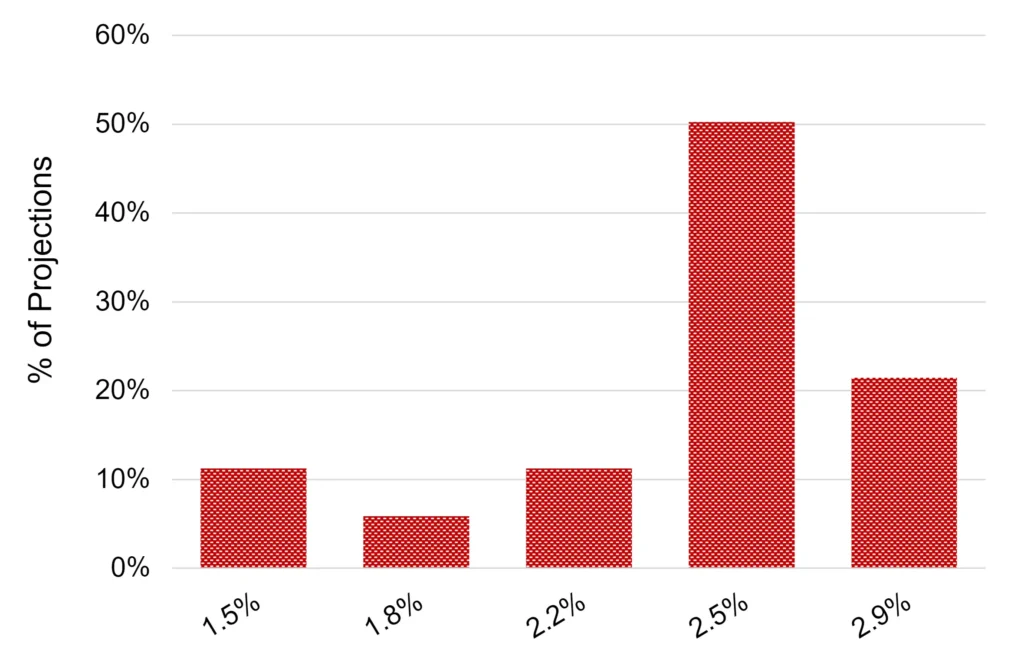
Projected 2024 default rate
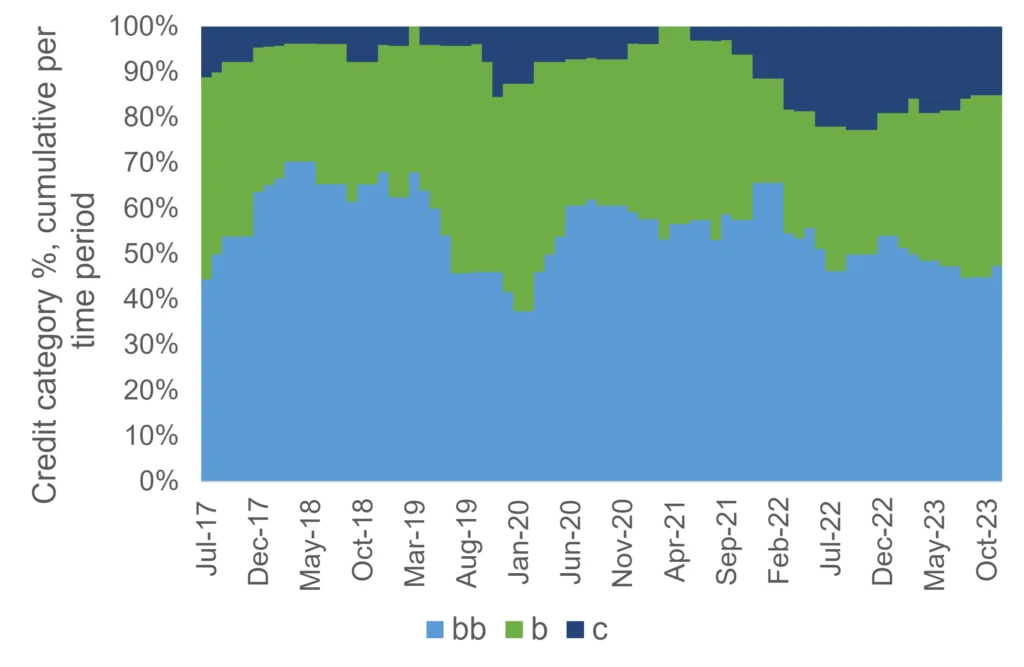
Distribution of entities across rating categories (%)
Credit distribution by ratings category
Key Takeaways
- We predict that the US healthcare sector will record a slight increase in default^ risk in 2024. According to our central scenario, the current high level of 2.2% (as of 1/1/2024) is projected to rise slightly to 2.3%.
- Overall, the range of our projections is skewed towards lower risk, with a level of 2.3%-2.4% most likely, and a small likelihood (10%) that risk levels may drop to 2%.
- The proportion of borrowers in the “bb” rating category has been falling in recent years, with a corresponding rise in the “b” category in particular.
- Our aggregated consensus ratings cover 447 US healthcare companies, 75% of which are not rated by a credit rating agency.
^ Default Risk is defined as a weighted average of S&P long-term observed default rates in each rating category, using the monthly sector credit breakdown as weights derived from contributed bank data.
Outlook for US Pharmaceuticals
Minimal change in default risk masks company-specific differences
Long-term projected observed default rate (ODR)
Projected 2024 default rate
Distribution of entities across rating categories (%)
Projected default rate, rolling 12 months
Key Takeaways
- Our outlook for default^ risks in the US pharma industry is stable, with our central scenario showing almost no change in risk between current levels (1/1/2024) and projections for 2024. Our long-term projections are skewed towards lower risk overall.
- Secular trends have had a mixed effect across the pharma industry. AI is shortening time to market for new drugs, but the beneficial effect of a wave of drugs coming off patent is fading. The positive effect of anti-obesity drugs is company-specific.
- The proportion of US pharma borrowers in the “c” rating category has been dropping, and the proportion in the “b” category has been trending up slightly.
- Our aggregated consensus ratings cover 86 US pharmaceutical companies, 71% of which are not rated by a credit rating agency.
^ Default Risk is defined as a weighted average of S&P long-term observed default rates in each rating category, using the monthly sector credit breakdown as weights derived from contributed bank data.
Outlook for US REITs
Stable outlook as sector recovers – but office/industrial segment still troubled
Monthly balance of deteriorations vs improvements / number of entities
Projected 2024 default rate
Long-term projected observed default rate (ODR)
Credit distribution by ratings category

Key Takeaways
- Our central scenario for US real estate investment trusts points to a small increase in default^ risk for 2024. The apparently stable outlook glosses over growing problems in some real estate subsectors.
- Our range of 2024 projections for this sector is skewed towards lower risk, with levels of 1.1%-1.3% most likely. But there is a likelihood of almost 20% that current levels of 0.9% (as of 1/1/2024) will increase to 1.5% or more in 2024.
- The net balance of deteriorations vs improvements shows recent patchy improvements, although the long-term linear default risk trend is still modestly higher.
- Our aggregated consensus ratings cover 209 US REITs, 58% of which are not rated by a credit rating agency.
^ Default Risk is defined as a weighted average of S&P long-term observed default rates in each rating category, using the monthly sector credit breakdown as weights derived from contributed bank data.
Outlook for US Leveraged Loans
Risk levels to continue rising given HY concentration – but lower interest rates will help
12-month balance of deteriorations vs improvements / number of entities
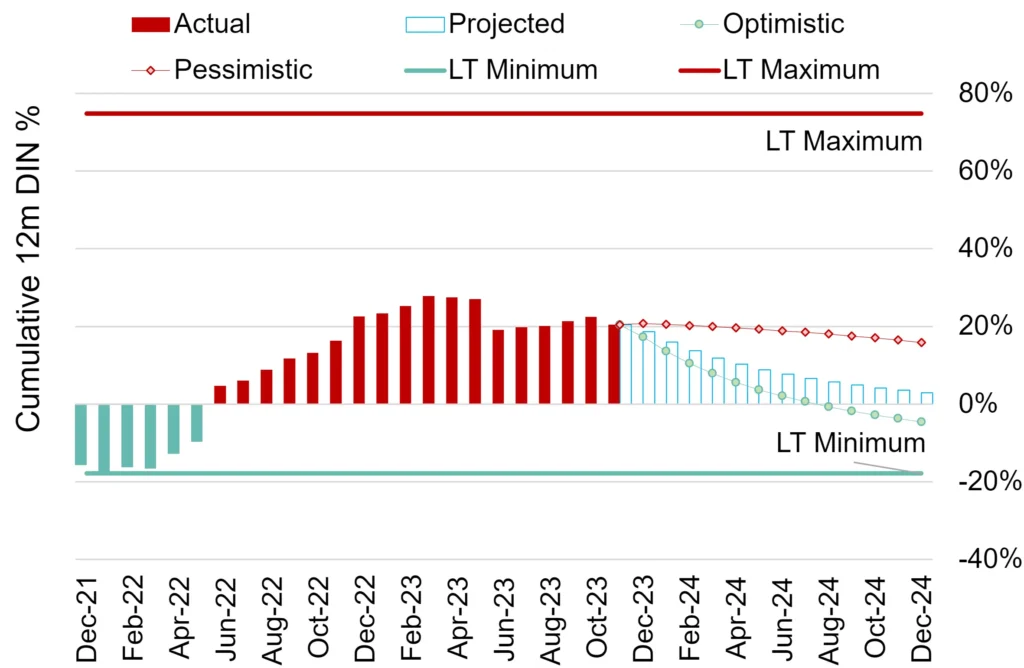
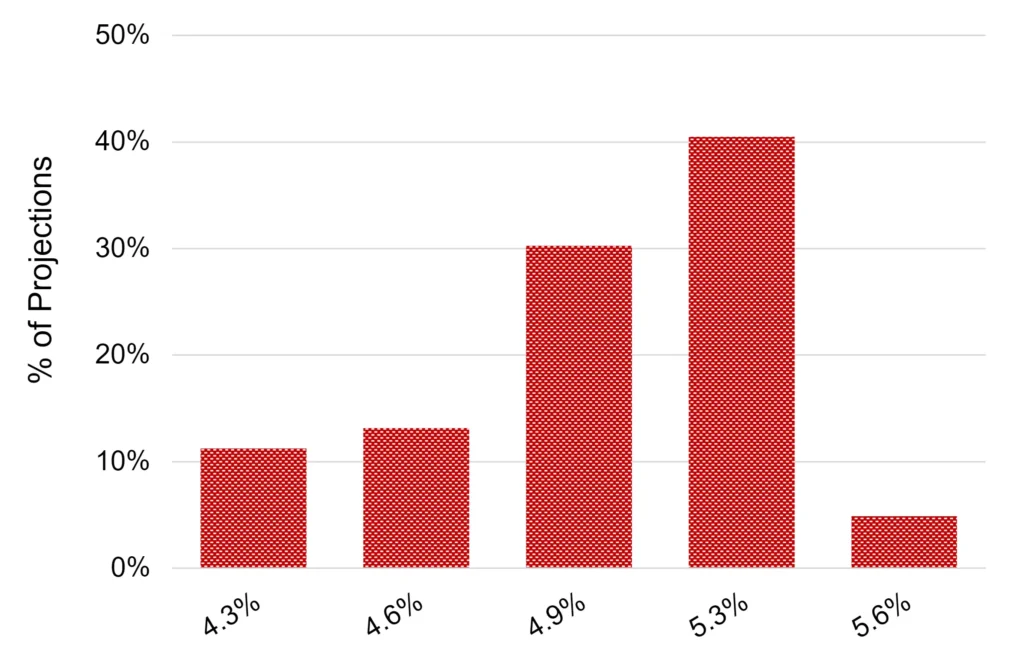
Projected 2024 default rate
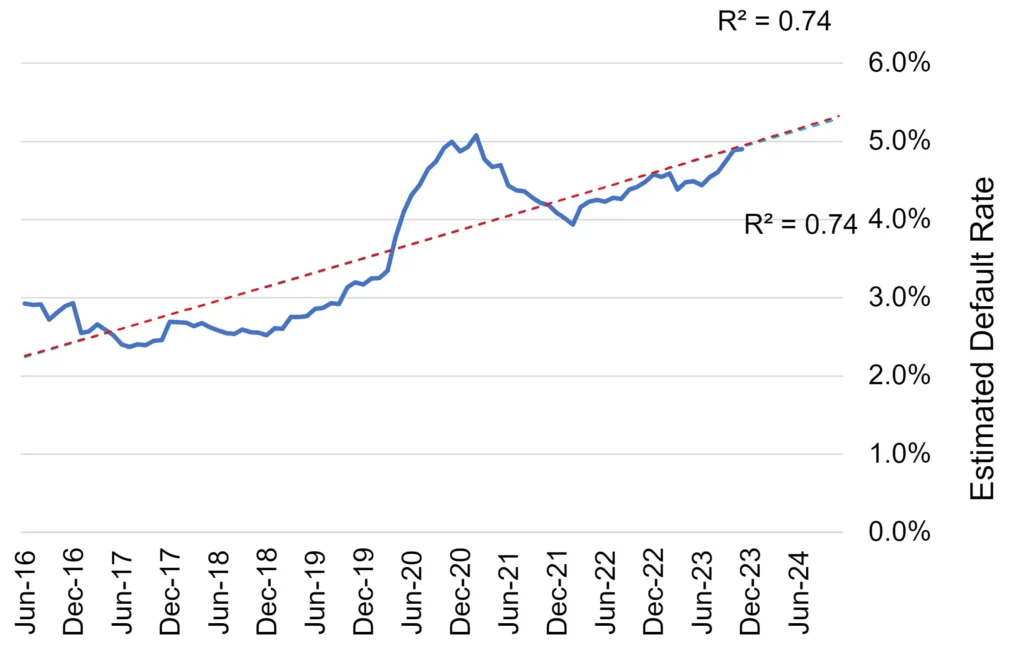
Long-term projected observed default rate (ODR)
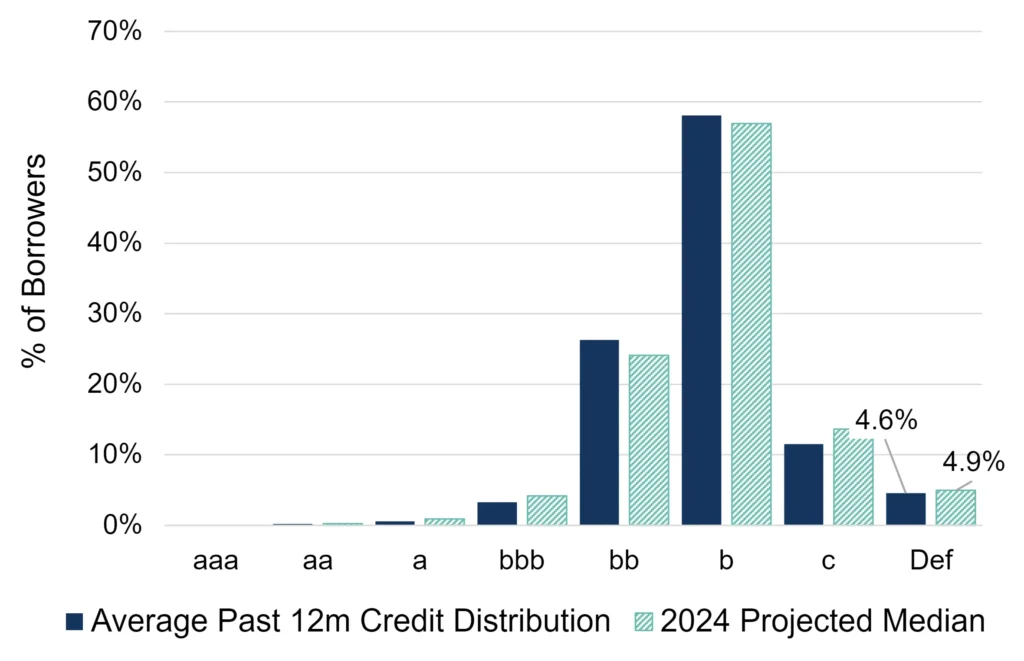
Credit distribution by ratings category
Key Takeaways
- Our central scenario for the US leveraged loans sector shows a further increase in default^ risk from 4.6% to 4.9%. Our 2024 projections are generally skewed towards higher risk, with levels of 4.9% to 5.3% most likely. There is a small likelihood (<10%) of the default rate reaching 5.6%.
- Despite the deteriorating trend in 2023, this sector has remained more robust than the more pessimistic market projections. However, our projections indicate that the long-term negative credit trend will continue for most of 2024.
- The long-term trend in default rates is still on the rise, with no major turning points in sight yet.
- Our aggregated consensus ratings cover 852 US leveraged loans, 27% of which are not rated by a credit rating agency.
^ Default Risk is defined as a weighted average of S&P long-term observed default rates in each rating category, using the monthly sector credit breakdown as weights derived from contributed bank data.
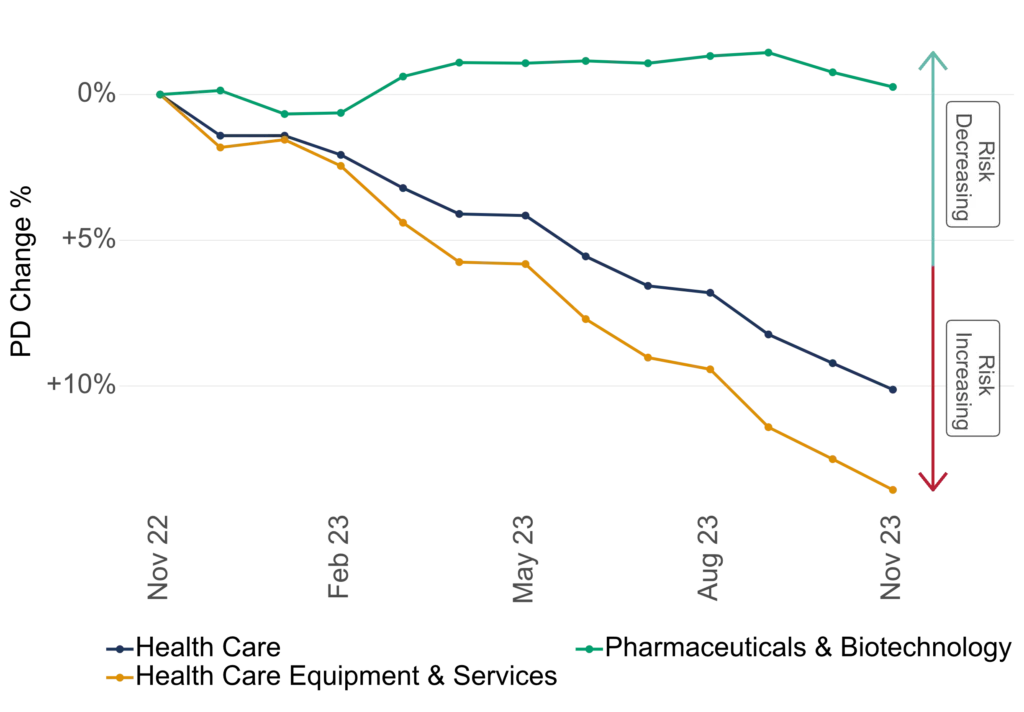
Selection of Sectors to Watch
2023 trends in probabilities of default (PD) across peer industries and sub-sectors
Pharma outperformed Healthcare industry
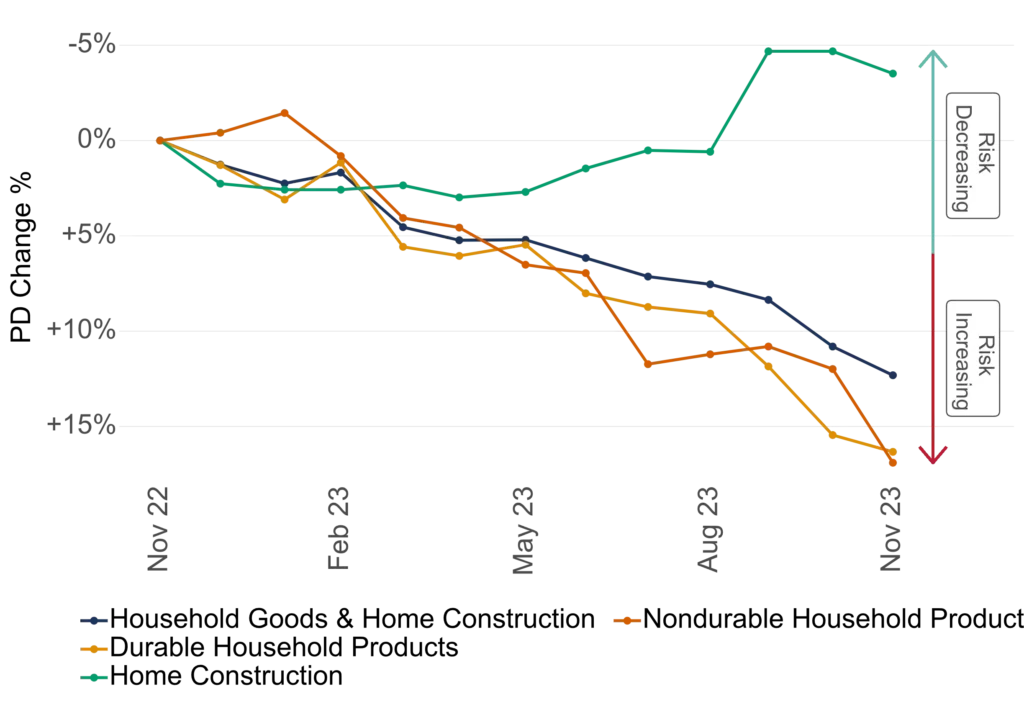
In Consumer Goods sector, household products underperformed home building
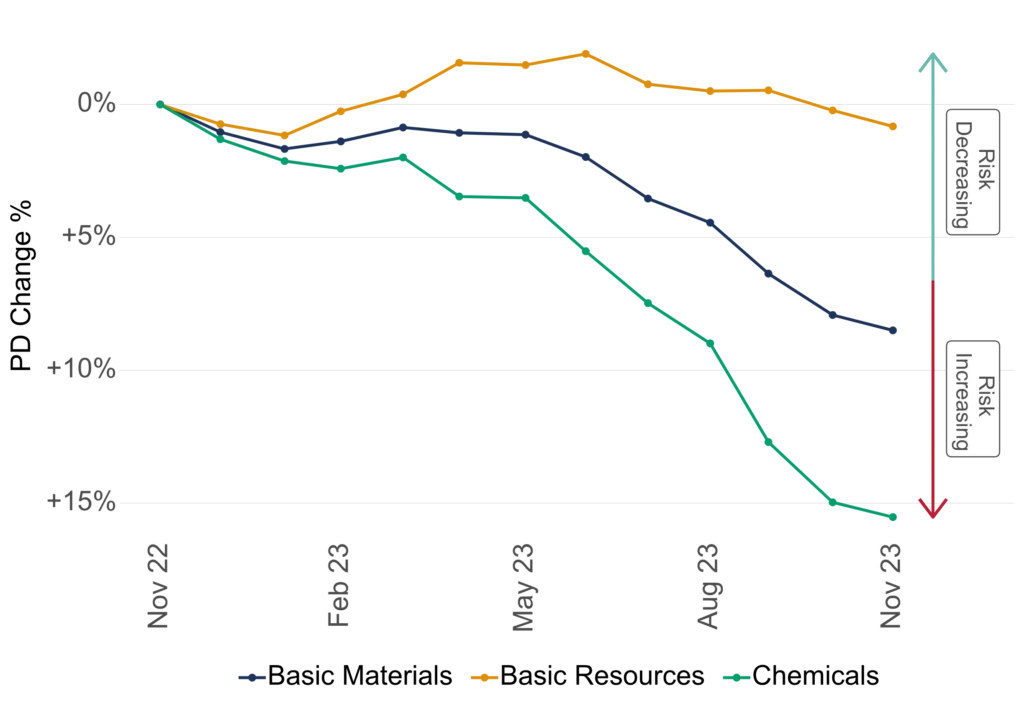
Chemicals was a major laggard in the Basic Materials sector
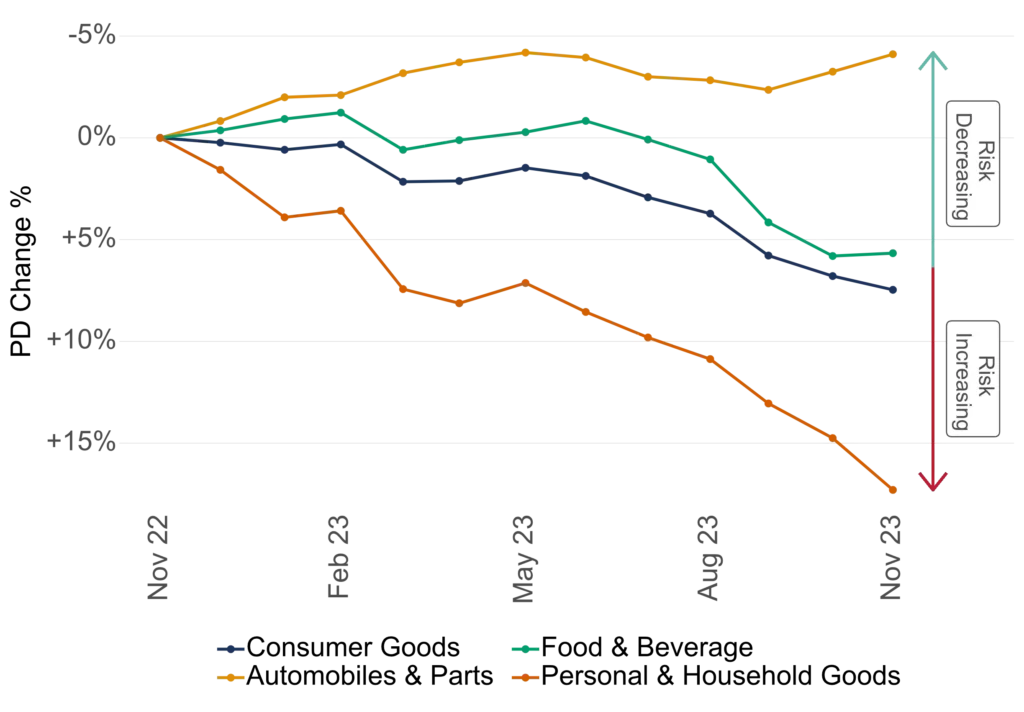
In the Consumer Goods industry, the Autos segment held up well
Key Takeaways
Despite a high federal funds rate, US growth was strong in 2023 overall, with sector-specific factors determining how each sector fared. If inflation continues to slow in 2024, the expected rate cuts will ease funding conditions and drive a credit recovery in H2 – but significant geopolitical uncertainties, especially potential disruptions to supply chains, pose downsides to this outlook.
-
- Health care is set to continue underperforming pharma in 2024 due to staff shortages and the IRA impact.
- The higher cost of living is affecting household products, while construction will benefit from housing starts.
- The chemicals sub-sector is lagging the basic materials industry as global oversupply hits weak local demand.
- The autos sub-sector is holding up well, after gasoline and EV sales posted strong growth in 2023.
Download PDF: Default Risk Outlook
Please complete your details to download the PDF of this report:
Appendix
Additional definitions and explanations
- All projections cover 2024 up until the end of December 2024.
- Segments of some industries are included in other larger industries (for example, parts of the consumer goods industry are included industrials), so the numbers of entities may overlap for some industries.
- The historic data set that we used for our projections is based only on derived metrics from one-year ex ante probability of default (“PD”) estimates contributed by major global banks to Credit Benchmark. No external micro- or macro-level data was used.
- The reported “Default Rate” is defined as a weighted average of S&P’s long-term observed default rates in each of the seven main rating categories (from “aaa” down to “c”), using the monthly sector credit breakdown as weights derived from contributed bank data.
- This gives an index of default risk combined across investment-grade and high-yield borrowers, and this index only changes when contributing banks amend the credit classification of borrowers. It is therefore directly linked to changes in transition rates, which can be tracked and potentially predicted via the deterioration vs improvement net balance, which records ALL movements in single-name PDs across all rating categories.
- Our projections are a combination of three types:
-
- The proportion of borrowers projected to be in the “c” category by the end of 2024. The majority of defaulting borrowers will transition from this category.
- The net balance of deteriorations vs improvements across all rating categories, projected by the end of 2024. This shows how rapidly the upper right triangle elements of the transition matrix are increasing in value, showing the potential scale of future rating category transitions, including jumps to default.
- Modelled default rate projected directly to end 2024.
- All projections follow monthly timestep paths up until the end of 2024.
- All projection types use multiple historic periods to give a range of future outcomes. Many of these give similar results, but some result in large outliers on either side of the distribution
- Optimistic and pessimistic projections based on 10th and 90th percentiles of projected paths. Our central scenario is based on 50th percentile.