Consensus data enables more accurate and comprehensive credit valuation adjustments (CVAs) especially for counterparties lacking traditional credit ratings.
Credit Benchmark (“CB”) delivers a unique, data-driven approach to credit risk by aggregating the internal risk views of over 40 global banks, creating anonymized, consensus-based Credit Consensus Ratings. With 115,000 forward-looking ratings across 160 countries, five times the coverage of traditional credit rating agencies, Credit Benchmark addresses a data gap commonly experienced in addressing credit valuation adjustments to derivative contracts. Features of Credit Benchmark dataset include:
- 115,000+ credit consensus ratings (CCRs) (90% of data are unrated today by CRAs).
- PDs sourced from 40 banks, nearly half of which are GSIBs.
- 130,000 bond and loan ratings representing $34T (available via Bloomberg).
- 1,200 industry and sector credit indices which can be expanded to IG/HY.
- Weekly updates to dataset, with 10 years of history with month-end date stamps.
A CVA (Credit Value Adjustment) is a valuation adjustment to a derivative contract’s recorded value to account for potential losses in the event of a counterparty default.
CVA, and the frameworks that bank regulatory bodies have set for the management of CVA, make it a complex topic, with implications for bank capital management commonly measured in tens of billions of dollars. And because CVA has been codified in IFRS and GAAP accounting standards, the topic must also be addressed by non-bank financial institutions engaging in derivative transactions that are material to their financial statements. The credit strength of financial, commodity, and supplier counterparties can be measured in a variety of ways, which tends to be more complex when in the absence of any credit rating history.
The usual approach to estimating a CVA is:
- Estimate future potential exposure(s).
- Source market derived or credit rating equivalent spread(s) (the market element is critical – the CVA needs to approximate the current cost of insuring against default).
- Calculate expected default losses, with an allowance for recovery.
How do banks source inputs to estimate counterparty CVAs?
Banks often use a “waterfall” approach to data sourcing. A common order of preference:
- CDS spreads: these are universally accepted by regulators so they will be used where available and current.
- Bond price-derived spreads: these may be closely linked to CDS but may need adjustments depending on seniority, security, optionality, term, etc.
- Rating agency credit ratings: they allow the bank to map each counterpart to the relevant credit rating and hence to a CDS or bond spread; but they do not remove the need for spread data.
- Proxies (country/sector matrices) if direct data is unavailable: these can help in two ways: (1) no spread available – use country / sector / maturity samples and interpolate (2) no rating available – use country / sector credit profiles to gauge likely credit rating. The more granular the credit proxy data, the better.
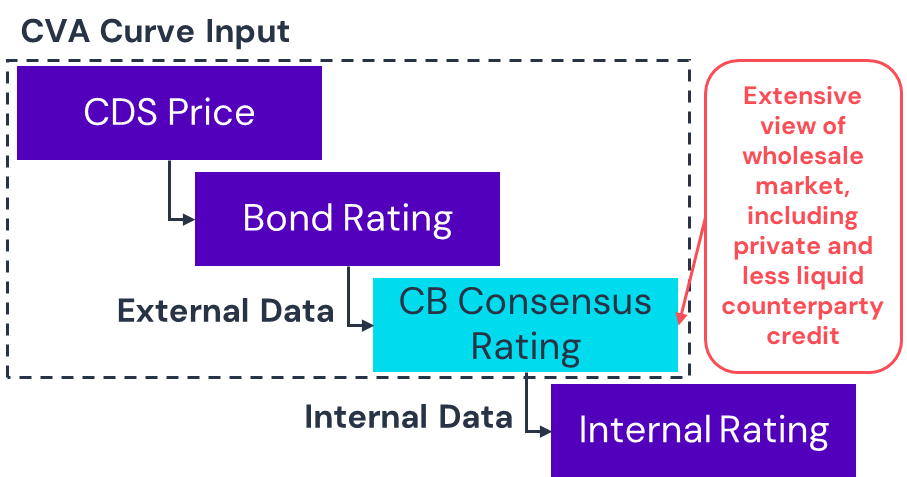
The schematic below shows the ranking of Credit Consensus Ratings in the CVA waterfall. If public ratings are available, they will provide some corroboration, but for unrated and private assets the consensus rating may be the main data source.
Figure 1 - Waterfall Example
What are the challenges?
Inaccuracies, estimations and theoretical concepts impact risk estimates, pricing, and capital allocation. Challenges arise when:
- Counterparties have no observable, traded CDS or bond prices.
- Market spreads may be inappropriate for some private assets, even if CRA private ratings are available.
- CRAs do not provide ratings.
- Internal bank ratings may be restricted by public/private information barriers.
- Proxy ratings (from country/sector matrices and credit profiles) may have wide margins of error.
Credit Benchmark Credit Consensus Ratings may assist CVA practitioners across the CVA process. Existing CVA frameworks used by large and systemically important banks can involve complex, quantitative designs, tight controls, meticulous approvals, and highly specified inputs, which may or may not leave room for credit ratings. Even when inputs of a CVA model or framework do accommodate credit ratings, the type or nature of the credit rating may require analysis and approvals.
Where CVA models or frameworks may not have direct credit rating inputs, linkages between a Credit Consensus Rating and other inputs may be contemplated in the approaches below. The approaches are not recommendations, but demonstrate techniques that CVA practitioners can contemplate for meeting the requirements of their regulatory, risk, and accounting environments.
Credit rating as an input to produce market implied CDS spreads
In this example, a CDS spread is modelled via a simple fitting using CB Credit Consensus PDs.
Beginning with a pool of quoted 5-year CDS for large companies, and their corresponding CB ratings, an OLS line is generated, showing relationship of 61.96 + 0.48 x Real World PD between the two variables. Despite the tenor difference, a 1-yr PD and CDS would be expected to hold some measure of interrelationship, which is seen in the plot in Figure [2]. Where a maturity-match is required between CDS prices and PDs, extrapolating the 1-yr PD to a five-year estimate can be performed.
The regression fit of 57% is significant, but larger CDS samples, non-linear fits, and filtering of outliers and stale prices may improve the R-squared term.
Figure 2 - CDS Spread vs. Real World PD

Credit rating as an input to a market implied corporate bond spread
This is a similar concept to the CDS case, but the output variable is a corporate bond market option adjusted spread (OAS).
The curves in the below chart are fitted from CB US corporate aggregates. Each aggregate has a distribution of rating categories, which are treated as weights. For example, if the US software aggregate has 43% ‘b’ graded entities, .43 is multiplied by OAS of the ICE BofA ‘b’ index. The sum of all OAS’s across the rating grades leads to a plot average PD relative to the summed OAS. The process is repeated for all sectors, creating 130 points, which are fitted to a curve. A CVA desk can enter the graph using a PD (x-axis) and read a corresponding the market implied spread from the y-axis.
An end-month fitting was conducted in January 2025 and again in April, demonstrating the credit widening occurring between the two periods.
Figure 3 - US Market Implied vs. Real World Jan & April 2025

If a CDS spread is needed, a recovery assumption may be applied to convert the estimated OAS to a CDS spread.
If a maturity match between PD and OAS is required, further assumptions would be needed to convert the Credit Benchmark 1-yr PD to the desired tenor.
Proxy approaches
If only the counterpart sector is known, then the plots shown previously can be used to give an initial estimate for weighted average PD and OAS spread. PD and OAS ranges for sector constituents can be plotted as cross-hairs to give some confidence ranges for this proxy approach.
PDs can also be estimated from credit profiles. Credit consensus data is especially valuable here, because the coverage across unrated and private counterparts in multiple countries and sectors supports a large range of credit indices. This gives more accuracy in the proxy approach.
Figure 4 - Credit Profile: Mexico Consumer Goods
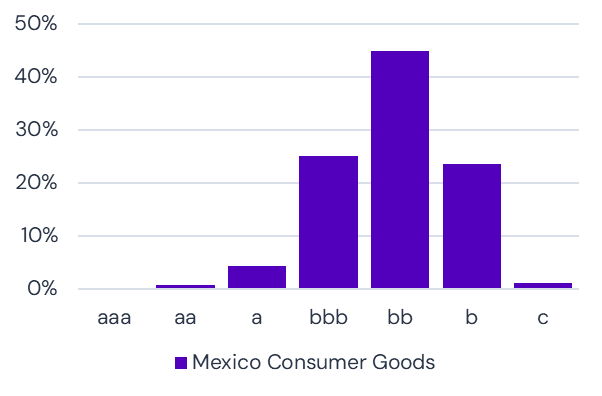
If no market data or default estimates are available, banks can estimate the most likely rating from the credit distribution of the counterparty peer group.
The credit profile shown here for Mexico Consumer Goods gives a 45% chance that a randomly chosen counterpart is in the bb category, and 90% likelihood of being in the range of bbb to b.
More granular profiles are available, with 21 or even 100 PD categories. The proxy PD can then be used in the CDS or OAS approaches outlined above.
Country and sector credit profiles are updated monthly.
About Credit Benchmark
Credit Benchmark’s mission is to enable global financial market participants to make better-informed decisions. Founded in 2015, Credit Benchmark is the leading provider of consensus-based credit risk data and analytics. By aggregating and anonymizing contributed credit risk views from over 40 global financial institutions, CB delivers unique, real-time insight into obligor creditworthiness. With coverage spanning 115,000 entities – 90% of which are unrated – Credit Benchmark offers critical intelligence that enhances internal risk analysis, supports capital efficiency, and helps institutions make better-informed decisions. Trusted worldwide, Credit Benchmark provides a vital alternative to traditional ratings, combining the collective expertise of global credit experts into a single authoritative view.
Contact us at [email protected] to speak with our team and learn more about how our data can support your business.
Credit Benchmark consensus credit data is updated twice-monthly and delivered to our clients via our Web App, Excel add-in, flat-file download and third party channels including Bloomberg. Advanced analytics like those found within this report are now also available for free on the Credit Benchmark website via Credit Risk IQ. 10,000+ monthly geography-, industry- and sector-specific risk reports and transition matrices are available on Credit Risk IQ.