
The “Trump Effect”
Donald Trump and the Economy – The first year of the Trump administration has not been dull. Radical domestic and foreign policy announcements, dramatic White House personnel changes, and allegations about Russian interference in the election – these have captivated traditional and social media.
But behind the scenes, Donald Trump has had another, quieter, but potentially much more far-reaching impact. This “Trump Effect” is economic, and it is having profound and tangible effects across a range of industries in the US and beyond.
Download the PDF “Donald Trump and the Economy”
A brief summary of the key economic changes in 2017:
Macro:
- The US economy grew 2.3% in 2017 and unemployment dropped to 4.1%, with 3 million new jobs created.
1 - By mid-March, the S&P500 index had risen 19%, the Dow Jones 25%, and the Nasdaq 28% – although the first quarter of 2018 has been characterized by bouts of extreme stock market volatility.
- The 10-year US Bond yield rose to 2.4% and three-month rates rose to 2%.
- Inflation dropped to 2.1%. Credit spreads tightened to 1%. 2
- The US Dollar depreciated by 5% – 10% against major currencies.
- Jerome Powell took over as Federal Reserve chairman in early February 2018.
Corporate & Fiscal:
- An estimated 1.4trn tax package was passed by Congress in December 2017, with particularly major reductions in the tax burden for S-Corporations (LLCs etc.)
- A major push to repatriate tax revenues from domestic technology companies with foreign tax domiciles.
- The US has announced its intention to withdraw from the Paris Accord, and there are proposals for the abolition of the Environmental Protection Agency.
- With cross party support, the debt ceiling has been raised to avoid Government shutdowns. Tariffs announced on steel and aluminum imports.
Financial:
- The 2010 Dodd-Frank Act is being rolled back. The Financial Choice Act is intended to “create hope and opportunity for investors, consumers, and entrepreneurs by ending bailouts and Too Big to Fail, holding Washington and Wall Street accountable, eliminating red tape to increase access to capital and credit.” It has already been passed by the House, and the follow-up “deregulatory” bill S2155 could cut the number of SIFIs3 from 38 to 25.
From an economic point of view, the immediate impact of the Trump administration has been business-friendly for American companies of all sizes. Policies show a willingness to temporarily expand the Government deficit in order to stimulate the economy and encourage direct investment by US corporations. There is a commitment to reducing red tape and encouraging access to capital. It also endorses a hawkish Federal Reserve stance to normalize the cost of borrowing, in part to encourage the private supply of credit.
Current policies reflect a belief that American business needs a stable and temporarily protected environment in order to encourage sustained investment, and that what is good for business and the economy is also good for jobs, and – in the longer term – good for the Government fiscal position.
The view that a strong economy is key to fiscal strength echoes the Reagan-Laffer policies of the 1980s, but the tariffbased protectionism of the current administration has worried markets and sparked the resignation of chief economist Gary Cohn. Holman Jenkins of the Wall Street Journal compared the tariff approach with Reagan-era quota-based protection: “Reagan slapped import quotas on cars, motorcycles, forklifts, memory chips, color TVs, machine tools, textiles, steel, Canadian lumber and mushrooms. There was no market meltdown.”
This report uses bank-sourced credit data to assess the Trump Effect on a number of sectors and key economic indicators. It concludes that the Trump Effect has so far had a positive impact on perceptions of credit risk across a number of US industries. The longer-term impact of protectionist policies measures may undermine some of these gains, but that will depend on the scale of the measures that are actually implemented, as well as the scope of any international response.
1. Sovereign Credit Quality and the US Fiscal Position
When Donald Trump was running for President, banks became increasingly concerned at some of the campaign rhetoric which, at one point, included the threat of a US debt default. This seems to have prompted banks to modify their credit views of the US Government, showing that they took the prospect of a Trump victory seriously. Exhibit 1.1 shows the bank-sourced view of US Sovereign credit risk over the past 20 months.
Exhibit 1.1 US Sovereign Credit Rating: Consensus Bank views
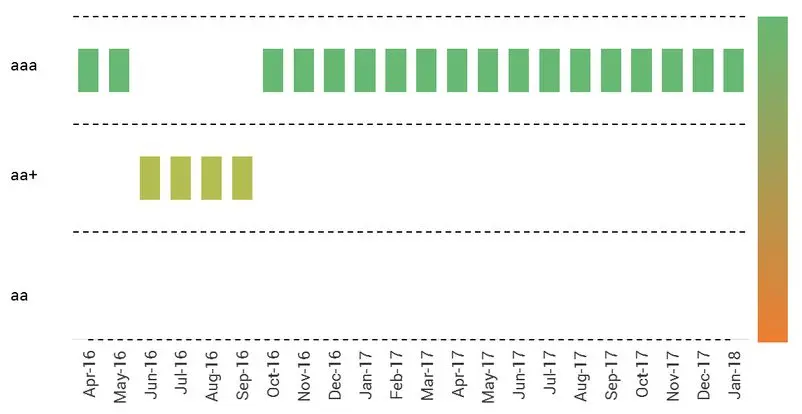
This shows that banks moved US Sovereign risk from a CBC4 of aaa to aa+, a one notch downgrade. However, even before Trump had gained the White House, his actual policy announcements became more pragmatic and banks quickly moved the US Sovereign rating back to aaa.
Looking forward, the tax package will have an initially negative impact on the Government fiscal position, adding 1.4trn to the deficit over 10 years; various infrastructure projects will also boost borrowing. Both of these will be partially offset by the resulting stimulus to the economy and repatriation of offshore corporate profits. The effect of protectionism is likely to be a short-term boost to tax revenues, but the long-term effect is difficult to quantify. The US economy is relatively closed so it will suffer less from the impact on trade volumes of protectionism than some of its trading partners. A number of country exemptions have already been announced, as well as offers of tariff reductions from trading partners. So – ironically – the announcement of higher tariffs may actually spark a round of tariff reductions.
It is also worth noting that the unusual combination of rising bond yields and a simultaneously strong equity market provides a double benefit for traditional defined benefit pension schemes; funds of this type still dominate public sector pension arrangement and can be significant in some municipal finances.
2. The Stock Market
Donald Trump has pointed to the US stock market as an independent yardstick for the performance of his administration. To put this in a credit context, Exhibit 2 shows the Dow Jones index and associated credit data for the past two years.
Exhibit 2.1 Dow Jones Industrial Index and Average Credit Consensus for Constituents
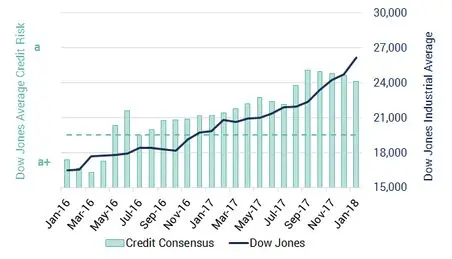
Note: y-axis reversed to show credit risk rather than credit quality Source: Credit Benchmark. The Economist published a similar chart in January 2017 which also used Credit Benchmark data.
This shows that over the past two years the average CBC of the Dow Jones Industrial Index constituents has moved a full notch, from a+ to a. There was a steady deterioration during most of 2016 and in the first half of 2017. However, the credit estimates have improved slowly but steadily from September 2017 onwards. Over the same two-year period, the Dow Jones has steadily risen.
The US stock market has had a volatile start to 2018. The VIX has risen from an abnormal low of less than 10% and is now typically trading around 15%, having briefly spiked to 38% on the day that the new Federal Reserve Chairman Powell took office. The main concern seems to be higher interest rates and the impact of tariffs, and the recent bouts of volatility seem set to continue this year. Exhibit 2.1 illustrates the old adage that “Bull markets climb a wall of worry”. While worries remain, they are focused on interest rates; in credit terms, those worries are currently receding.
3 Corporate America
The stock market boom is not just the consequence of Quantitative Easing. Fortune magazine recently reported that S&P500 Earnings are expected to grow by more than 10% in 2018 and 2019.
They do, however, caution that those earnings now represent 9.5% of GDP, against a long-run average of 6.6%. Interest rates are also rising, but equities are anticipating a prolonged business-friendly regulatory environment and a fiscal-led boom.
Exhibit 3 compares credit trends for US and European non-SME corporates.
Exhibit 3.1 US and non-US Large Corporates: Credit Distributions, January 2018
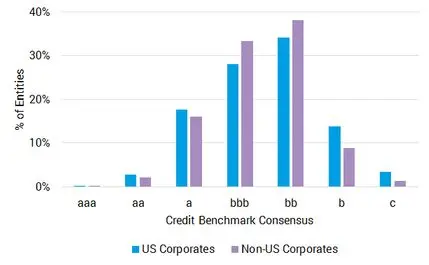
Exhibit 3.2 Credit Trends for US and non-US Large Corporates (Rebased), January 2018
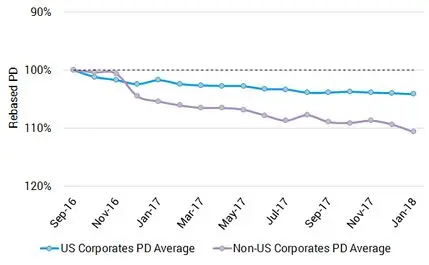
Exhibit 3.3 Credit Comparison for US and European Industries, January 2018
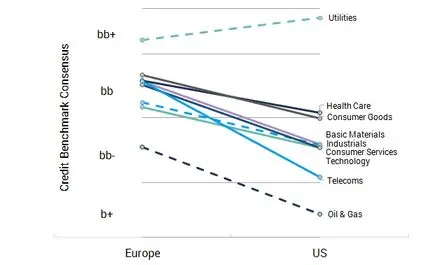
Exhibit 3.4 Credit Comparison for US Industries, Jan-17 to Jan-18
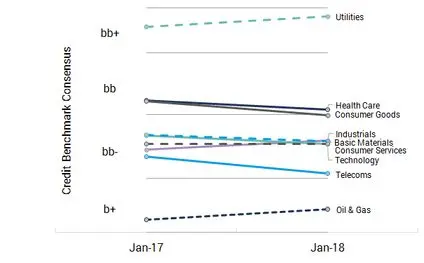
Exhibit 3.1 shows that large US corporates have a higher concentration in the aa and a categories as well as in the b and c categories; but on average are typically one full credit notch below their non-US equivalents. Closing this gap is part of the administration’s stated policy to “Make America Great Again”.
Exhibit 3.2 shows the trends for large US corporates compared with their non-US equivalents. Both show a credit deterioration over the past 15 months but the US series has recently levelled out, while the non-US index has continued to modestly decline.
Exhibit 3.3 shows the current credit comparison for US and European industries. This shows that Utilities are the only US industry which has an overall credit rating that is stronger than its European equivalent. It is worth noting that the industry rankings are similar in both regions.
Exhibit 3.4 shows the credit comparison for US industries between January 2017 and January 2018. This shows that some industries are beginning to improve, in particular, utilities, basic materials and oil & gas. The credit rank of the industries has stayed mostly the same, with the exception of basic materials which is now above industrials.
The next three sections review the credit trends in more detail for three key sectors: Coal, Defense and Steel.
4. Coal
The Trump campaign was vocal in its support for the coal industry, despite widespread criticism by environmental groups. In the first year of the administration, coal production and employment have steadily risen. These trends are reflected in credit data covering a universe (across various tracking baskets) of about 20, mainly US, coal companies. However, the sector has a long way to go before it reaches investment grade and the economics of coal production are still very challenging. Exhibit 4.1 shows the credit trends for these multiple baskets.
Exhibit 4.1 Coal: Credit Trends
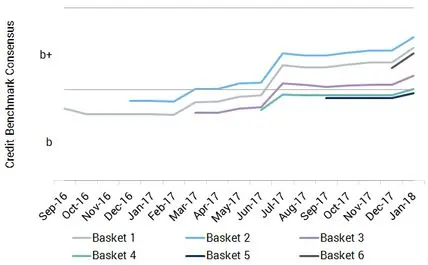
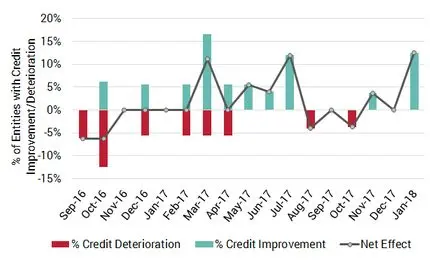
Exhibit 4.2 Coal: Credit Quality Movements
- Each line in Exhibit 4.1 represents the simple average credit risk of a basket of coal companies. There are about 20 obligors in each basket but the actual number varies over time depending on the pattern of bank business. Each line represents the “on-the-run” basket for a three-month period. The initial basket (1) shows a one-notch credit risk improvement from mid b to b+.
- The most recent basket (5) is in credit category b with a similar risk to the opening value of the first basket. This is a good example of a pattern that is often observed in bank-sourced credit data: as the overall credit risk improves, banks tend to take more risk with their choice of borrowers. However, the most recent Basket (6) shows an improvement; partly reflecting the overall trend towards upgrades as well as a change in the mix of the basket; weaker borrowers have now been dropped.
- Exhibit 4.2 shows the proportions of the basket universe with improving and deteriorating credit. This shows a moderate but clear swing towards improvements over the past year.
5. Defense
The Defense sector will benefit from the new “National Defense Authorization Act”. This increased spending coincides with an increase in geopolitical risk. There is tension with Russia over the Middle East and the Eastern European border; and with China in the South China Sea island dispute. But the war of words with North Korea seems to have had a positive effect without shots being fired, and the current administration see that as a vindication of their policy to always negotiate from a position of strength.
The stronger outlook for the sector is reflected in the credit data, with each basket covering a universe of around 25 defense companies around the world (US companies are the single largest group in this index, although increased defense spending is likely to benefit non-US companies as well.
Exhibit 5.1 Defense: Credit Trends
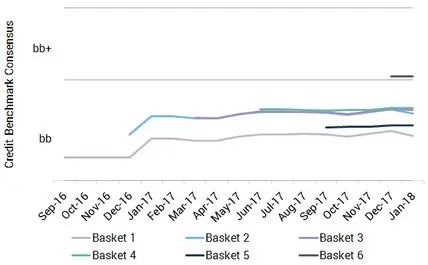
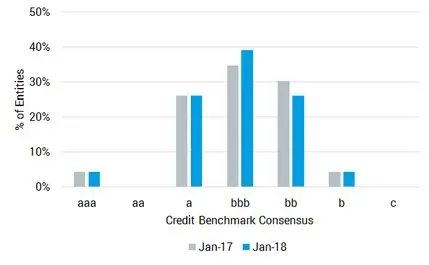
Exhibit 5.2 Defense: Credit Distribution Over Time
- Exhibit 5.1 shows that over the past 15 months, the typical basket of defense names has been in the bb category. However, the most recent basket has improved to the bb+ category.
- The improving environment initially prompted banks to deal with higher-risk names (e.g. basket 5) but the most recent basket is of significantly better quality. As with coal, this mainly reflects a change in the composition of the basket; some long-standing weaker borrowers have again been dropped. If the current improvement in the fortunes of defense companies is sustained, then the next phase could see previously high-risk borrowers move closer to investment grade.
- Exhibit 5.2 shows the distribution of the defense universe across the credit spectrum. This shows there has already been a significant improvement in the credit standing of the companies in the sector with a move from bb to bbb.
6. Steel
Trump’s campaign promised to protect the Steel (and Aluminum) industries and the recently announced tariffs aim to achieve that.
The quota approach of the Reagan era has been described as “cartel-like” – the targeted countries may share in the higher prices that result from volume restrictions, and those higher prices are at the expense of domestic consumers.
By contrast, direct tariffs encourage domestic supply because foreign supply becomes more expensive; so, although they can prompt retaliation, it is also possible that it results in lower tariffs, if other countries fear that they would otherwise be completely shut out. This is the ideal outcome for domestic consumers and ultimately for global trade volumes as well.
Exhibits 6.1 shows the credit trends for the Iron and Steel industry based on median credit risks for about 30 US companies and 70 non-US companies. Exhibit 6.2 shows the credit distribution for US Iron and Steel companies at the beginning and end of 2017.
Exhibit 6.1 US and non-US Steel Companies: Credit Trends
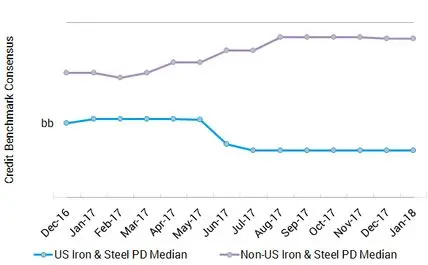
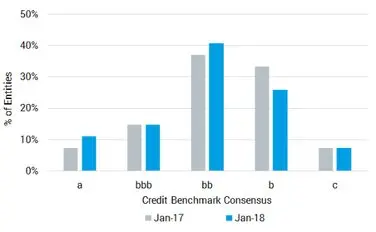
Exhibit 6.2 US Steel Companies: Credit Distribution Now and 12M Ago
These charts illustrate a number of key trends:
- Bank views of median credit risk for the US Steel industry have been deteriorating since May 2017.
- For non-US companies, there has been a steady improvement between February and August 2017.
- This highlights one of the reasons for US administration concerns about the industry. If the tariffs are successfully implemented, US Steel companies could see a significant improvement in their credit standing; non-US companies are likely to see a deterioration.
Exhibit 6.2 shows:
- More than 70% of steel companies are currently non-investment grade.
- At the beginning of 2017, there were a large number of companies in the b category.
- However, over the past year the distribution has shown a slight shift to a and bb categories.
- So, while the median US Steel company saw a credit deterioration in the middle of last year, the credit distribution for the industry is now beginning to improve. If the tariffs are successful, the next phase is likely to be an improvement in the median and a further increase in the number of investment grade steel companies.
Conclusion
Based on 2017 credit data, the Trump Effect is real and positive; bank perceptions of credit risk have improved in a number of specific sectors, particularly those that have been the focus of favorable policies.
This is particularly marked in the Coal and Defense industries where the administration has already announced concrete steps to help those sectors. The Steel industry has seen a deterioration in credit over the past year but recently announced tariffs could reverse that, with possible corresponding and opposite effects on Steel companies outside of the US.
The stock market has weathered the uncertainties of the early days of the administration, as well as geopolitical tensions, and some radical policy announcements – including some which have alarmed the traditional republican supporters of free trade and globalization.
Despite these traditional republican concerns, corporate “Animal Spirits” seem to have been revitalized by the new administration and there are increasingly good reasons to expect a wave of corporate investment. If that also reduces the collective US corporate debt position, then America could close the credit gap with Europe.
The unusual combination of rising interest rates and a booming stock market is also good news for the currently stretched pension industry – ballooning deficits may begin to shrink; which in turn could help a number of state and municipal budgets, as well as corporates who still offer large defined benefit pension schemes.
The Trump Effect has so far had some significant and positive direct impacts on US business confidence and bank perceptions of US corporate credit risk. The indirect global effect will unfold this year and this could have some further consequences – positive or negative – on the US economy. Status quo is not a likely outcome.
Download the article: “Donald Trump and the Economy on PDF.”
More from Credit Benchmark
We aggregate the views of thousands of institutional credit analysts to create new, unique consensus data and analytics. Our clients use the unique entity- and aggregate-level data and analytics to understand and manage their risks effectively. The data helps clients focus their attention on where and when it matters most, whether in their risk management, investment process, or regulatory compliance. Learn More
Reporting was contributed by
David Carruthers
Barbora Makova
Sheliza Siddiqui
Footnotes
1 Economist Intelligence Unit.
2 St. Louis Federal Reserve quoting ICE BofAML US Corporate Master Option-Adjusted Spread (BAMLC0A0CM).
3 Systemically Important Financial Institutions – current asset cut-off is $50bn but would rise to $250bn.
4 Credit Benchmark Consensus (“CBC”): a 21-category alphanumeric scale based on bank-sourced one-year probability of default estimates. It is similar to the scale used by the main credit rating agencies, so that a CBC of bbb is approximately equivalent to BBB reported by S&P and Fitch, and Baa2 reported by Moody’s.
Restricted Distribution
Disclaimer: Credit Benchmark does not solicit any action based upon this report, which is not to be construed as an invitation to buy or sell any security or financial instrument. This report is not intended to provide personal investment advice and it does not take into account the investment objectives, financial situation and the particular needs of a particular person who may read this report