
The International Monetary Fund (IMF) recently published their latest Global Financial Stability Report.[1]
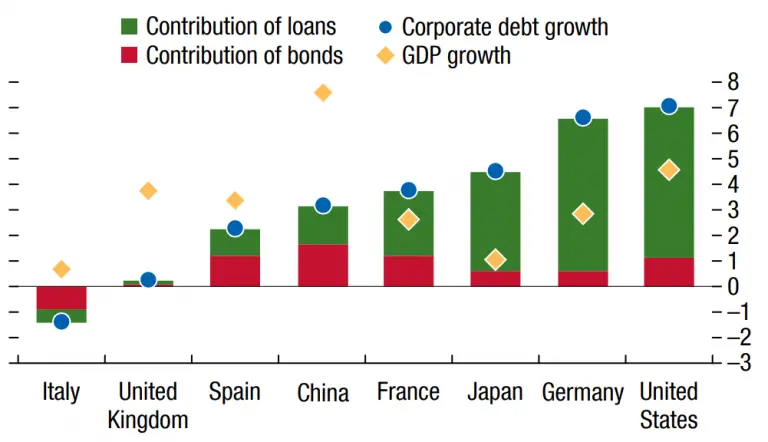
According to the report, Corporate Debt Growth between 2018 and 2019 has been mainly driven by loans rather than bonds, especially in the US, Germany and Japan. Figure 1 compares recent growth in Corporate debt with GDP growth across some of the largest economies.
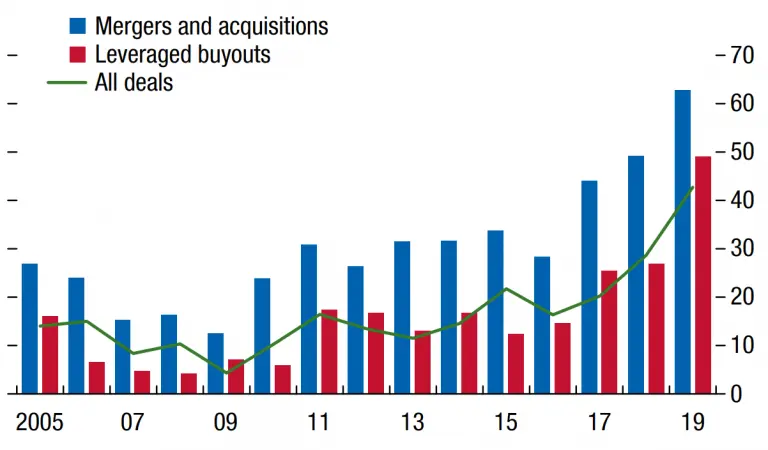
One key finding of the report is that the value of leveraged loans issuance has more than doubled in recent years, from $600bn in 2012 to $1.4trn in 2018, indicating that demand by investors for this type of loan has been strong. In the past year, growth in leveraged buyout loans has significantly outstripped growth in loans for M&A. Figure 2 shows the longer term trend in US leveraged loans (with EBITDA Add-Backs).
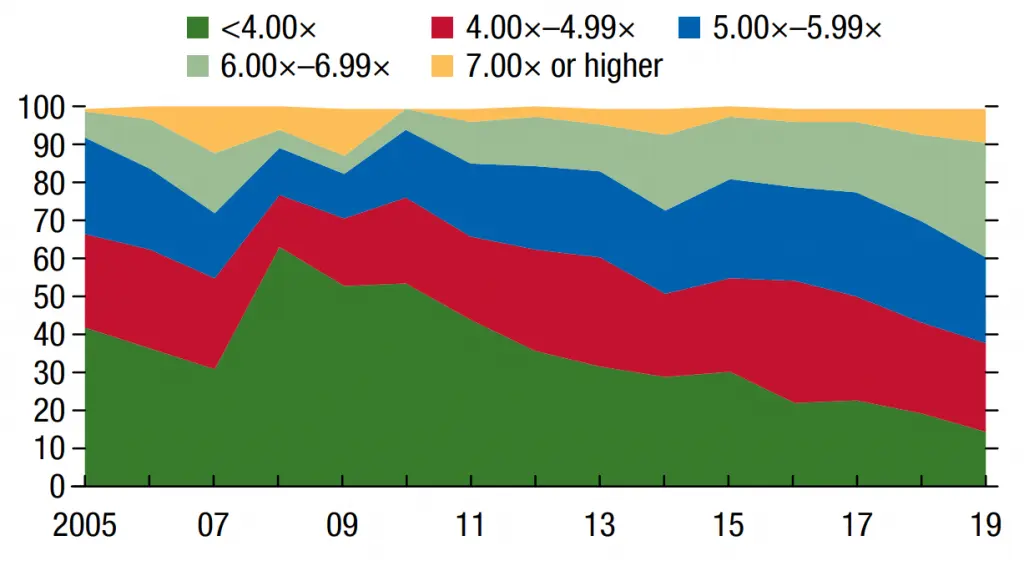
But as the leveraged loan market grows and evolves, what are the risks? Uncertainties about the soundness of underwriting and risk management processes are starting to give regulators pause. According to the IMF report, the leveraged loan risk profile has been increasing, with the 6x-6.99x category expanding from about 15% to 30% of total issuance between 2015 and 2019 while the lower risk categories are stable or declining. Figure 3 shows the trends and proportions of Leveraged Loans by Leverage Multiple.
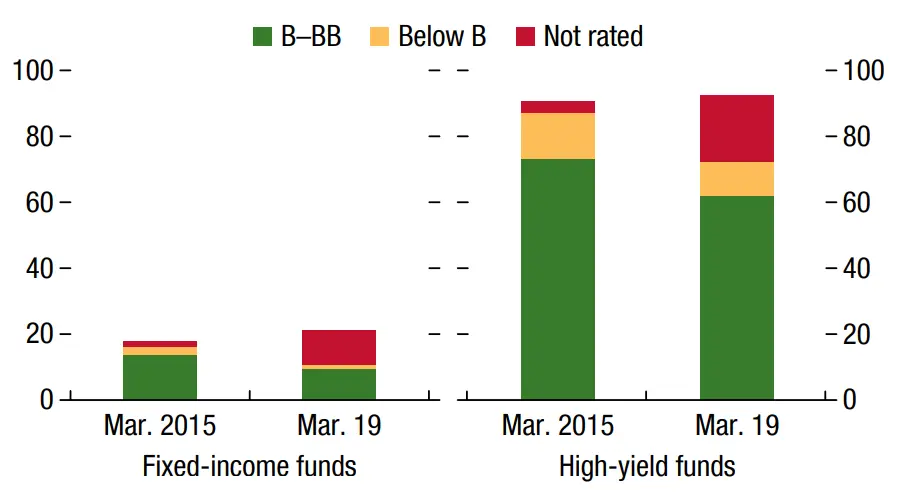
In keeping with these trends, fixed income funds have a growing appetite for higher risk bonds. And within high yield funds, an increasing proportion of bonds are unrated. Consensus ratings from alternative data sources such as Credit Benchmark can help illuminate the risks associated with otherwise unrated issuers. Figure 4 shows the credit category breakdown for Low-rated fixed income funds.
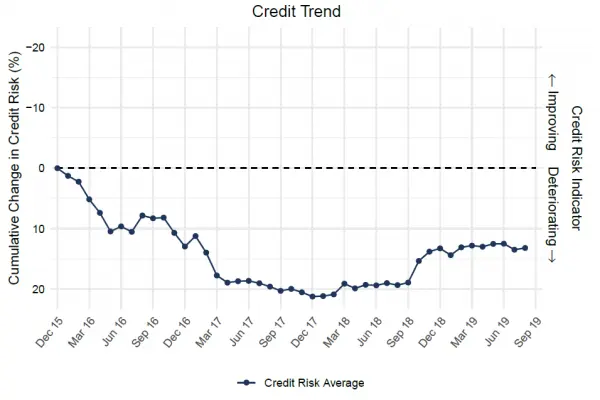
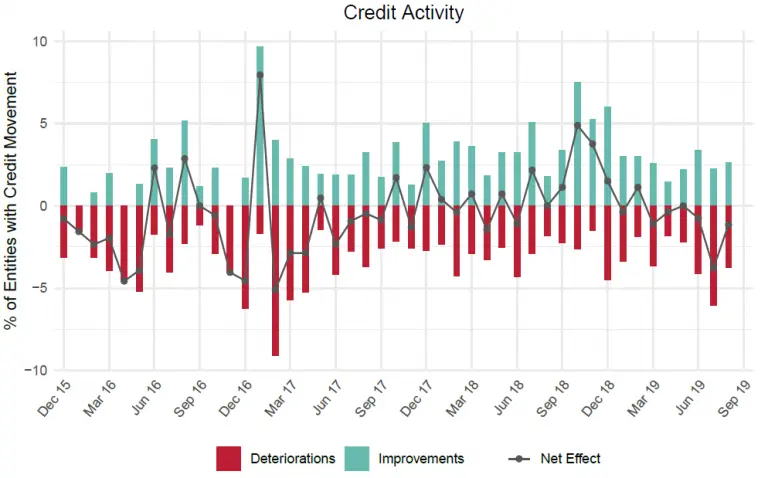
Concerns about leveraged loans are reflected in consensus risk data from Credit Benchmark. While the negative trend in leveraged loan credit has slowed over the last few months (as shown in Figure 5), the dominance of credit downgrades across five of the last six months (Figure 6) suggests a risk of further deterioration.
For information about how Credit Benchmark can help you better understand the credit risk of leveraged loan and unrated bond issuers, contact us here:
[1] https://www.imf.org/en/Publications/GFSR/Issues/2019/10/01/global-financial-stability-report-october-2019