
Key Findings:
Are storm clouds still gathering? Some major economies have been surprisingly buoyant in the past quarter making some of the gloomier credit forecasts look premature. Despite continued rate hikes, economic growth numbers remain robust especially in North America, the UK, and countries with major energy producing sectors. While recent US CPI numbers look promising, core inflation rates are likely to be stubbornly high; the Fed may have paused but further hikes cannot be ruled out. In Continental Europe, the impact of the Ukraine war continues to cast a shadow; stalled growth has been the price of lower inflation. Other major economies may also struggle to slay the inflation dragon for good without recession.
The full impact of rate hikes has been delayed by staggered loan rate resets; some sectors will be hit harder than others. This summer is likely to bring further challenges: El Nino is expected to set new weather records, and the effects of climate change are becoming obvious in a growing list of countries. Africa (also suffering a Ukraine linked fertilizer shortage) has been on the environmental frontline for years, but Southern Europe and the Southern US are now suffering annual droughts. Wildfires are earlier, larger, more frequent and more widespread; New York’s recent smoke haze originated in Canada. Food production and river-based transport now face regular disruption, and water shortages are becoming the new normal.
These problems are driving climate-linked technology research; and shifting global consumer attitudes may start to free up capital needed to turn innovation into climate-tackling investment. Higher interest rates are key in the fight against inflation, but they also encourage saving to finance technological change.
Consensus data shows that many sectors with a marked deterioration in Q1 have stabilised in Q2, while transitions only show a balance to downgrades in the crossover credit categories. This may be the calm before the storm, but the consensus has been broadly correct so far – the worst-case predictions for default rates have yet to materialise.
The commercial real estate sector – discussed in this report – is shifting focus away from office and retail towards industrial and warehousing, consistent with shorter supply chains and hybrid working. The sector is beginning to adapt to the new real estate landscape.
Leveraged Loans – also covered here – have been a major area of concern in 2023. Consensus data shows a marked credit deterioration, but this may have run its course for now. Many leveraged companies continue to successfully refinance and the appetite for securitised assets – at the right price – remains, but volumes are expected to trend lower. The US Government’s flirtation with default has again stretched the definition of “high risk” in credit markets, causing some investors to seek new forms of diversification. Related to this, credit index correlations reported here show that Asian and Continental Europe credit indices are diverging from the UK and North America – so there may be more scope for credit portfolio diversification.
Diversifying credit risk is likely to be become increasingly important if storm clouds continue to gather. Some of these appear in this report, including an uptick in credit volatility after a prolonged downtrend and – as the chartbook at the end of this report shows – ominously negative trends developing in Farming, Fishing, and Food Production.
The chart below covers a universe of approximately 1,200 credit indices, tracking the proportion showing net credit upgrades.

The 2022-Q3 steep decline in the proportion of indices showing net credit upgrades slowed in 2023-Q1. The latest month shows an increase in the proportion of indices showing net credit upgrades; more than 40% of indices are currently biased to upgrades in 2023-Q2.
The charts below show details for index types and regions. Upper charts show the proportion of indices upgrading over time. Lower charts show the current split between downgrades, no change, and upgrades.
All


Corporates


Financials


Funds


Europe


North America


Asia


Africa


Apart from Asia and Funds, the main regions and borrower types are all trending up.
Financials show a higher proportion of stable indices than Corporates; the latter show more movement, roughly balanced between upgrades and downgrades.
The proportion of Europe indices showing net credit upgrades increased in the latest month; North America is on its second month of incline, whilst Africa is on its third. Asia decline continues.
The table below shows detailed global industries and sectors that may be at turning points. These have either started to show negative balances after a run of positives, or vice versa.
Dec-22 to Feb-23 all positive CCIs, Mar-23 to May-23 at least 1 negative CCI:
Dec-22 to Feb-23 all negative CCIs, Mar-23 to May-23 at least 1 positive CCI:
There are more Global indices in the right column than the left. These trend shifts are spread across diverse sectors.
The charts below are based on the net balance between upgrades and downgrades which forms the Credit Consensus Indicator (CCI[1]). The plotted indices are examples of some of the global industries and sectors listed above.


The Global industries and sectors below are some of the key ones to watch. They have all had a run of multiple consecutive months of net deterioration, but the trend is slowing and approaching positive territory, or vice versa.


With economies and markets giving mixed signals, there is a lot of uncertainty about 2023 default rates. The table below compares average consensus default probabilities for a range of US sectors.

Insurance and Funds – apart from Hedge Funds – are very low risk. Travel & Leisure, Hedge Funds, Software, and Fixed Line Telecomms are highest in the 80 -120 Bps range. The mid-range includes Mining, Leisure Goods, Media and Support Services.
Large sector increases this quarter includes Leisure Goods, Fixed Line Telecomms (always a volatile sector), Household Goods, and Electronic & Electrical Equipment. Improvements include Travel & Leisure (cf. Leisure Goods), Industrial Transportation, Forestry & Paper, and Automobiles & Parts.
The second half of 2023 could show deteriorating balance sheets and liquidity problems in some sectors, and the main credit rating agencies are forecasting steep increases in default rates. Consensus data derived volatility and trend metrics will also give a strong and detailed indication of future downgrades or default rates.
The chart below shows percentiles for credit index 6-month rolling volatility. For approximately 1,200 indices, rolling volatility shows the speed and scale of PD changes; these can give advance warning of changes in transition rates. The percentiles plotted here are the most sensitive to turning points in PD volatility.

Across the CB index universe, all percentiles have – along with the equity VIX – ticked up this month, after multiple months of decline.
The next chart is based on cross sectional volatility (“dispersion”) i.e., the average range of estimates for single name estimates. A high value implies widespread uncertainty about individual firm credit ratings, probably around a key turning point; a low value implies a tight consensus and probably indicates that current trends will continue.

This metric shows a trend decline[2] since the start of the pandemic, consistent with the drop in rolling volatility plotted above, but it is above its low and has been volatile in recent months.
The CB Leverage Loan universe now covers about 4,300 issuers (54% North America, 44% Europe). The charts below show the latest trends.


The latest credit trend shows an improvement in average risk. However, the credit distribution has shifted to the right in the last 3 months, with more issuers in the b and c categories.
Cash flow problems at Thames Water have highlighted the range of challenges facing the sector. Crumbling infrastructure, high inflation linked debt, rising interest rates and tougher regulation are all questioning the Leveraged model that has been used to boost returns by infrastructure investors over the past few years.
The charts below show consensus ratings for Global Utilities in a sustained decline, but the deterioration in UK Water companies is significantly greater.
Historic Credit Trend (Jan-16 to Current)

Current Credit Distribution

The chart on the right shows that – despite this long-term underperformance – UK water companies have better credit risks than a typical global utility. But UK water company groups fall into distinct categories:
The next chart shows average consensus credit risk for these four types of firms, based on a UK consensus universe of 39 parent, holding and operating legal entities.

“Holding Company” structures have the highest risk (averaged across parents and subsidiaries), slightly above those with a more traditional investor base. Companies with ready access to equity funding are much lower, while those with implicit Government guarantees are unsurprisingly the lowest.
Summer in the Northern Hemisphere now brings an annual round of heat records and various extreme weather episodes. Drought, fires, fertilizer shortages, supply chain issues, and changing consumer tastes (and budgets) are putting increasing pressure on the agriculture and forestry subsectors.
The impact of climate change has been exacerbated by the Ukraine war, and the temporary ceasefire (Black Sea Grain Initiative) that allows Ukraine to continue to export fertilizer and grain is set to expire on 17th July.
These issues are now hitting credit risk in the “4Fs”: Food, Farming, Fishing, and Forestry. Consensus data shows a modest but consistent impact in these and related subsectors.

Global Farming, Fishing & Plantations, Beverages and Forestry & Paper credit indices all show a deterioration this month. The downward trend in Farming, Fishing & Plantations started in Q4 of last year.
If current climate records continue to be broken, and with no immediate end in sight for the Ukraine war, further deterioration is likely in coming months.
Warning signs continue to flash in the $5.5trn US Commercial Real Estate (“CRE”) market, with rising rent arrears and defaults, plus sales of some properties and real estate loans at steep discounts. The latter now extends to performing loans as lenders and investors anticipate widening problems.
Office sectors are worst affected by the persistence of hybrid working, with a Knight Frank survey reporting that most large firms are cutting office space. Retail is another casualty of work-from-home; already heavily indebted malls and former flagship stores are struggling with lack of footfall.
There are knock-on effects: municipal revenues will be hit by a shrinking property and sales tax base; the CMBS market is likely to see lower volumes and falling prices; and banks may struggle to liquidate property collateral for broader corporate (i.e., non-real estate) loans if those also turn sour.
Most of these problems are concentrated in cities like tech-hub San Francisco, or more generally in older properties in cities like Washington DC and New York. And there are also opportunities: demand for storage and warehousing space is growing. Industrial property demand in some locations is benefiting from onshoring as companies bring manufacturing home and hold more manufacturing inventory. Second-tier office sites are being converted to residences.
The S&P US REIT index reflects some of these issues, down 12% over the past year (vs. S&P 500 +3%). And real estate funds have explicit “gates” to manage withdrawals and avoid a property market overhang. So far, the adjustment has been modest.
The consensus credit distribution chart below shows that the majority of US REITs are investment grade, with around two-thirds in the a and bbb categories. The exception is Mortgage REITs, representing secured CRE loans. The majority are in the bb category and 40% are in single b. Retail REITS are generally high quality but just under 10% are in the c category – i.e., significant risk of default.

The next chart shows recent credit trends for these sectors.

In the past two years, the main index shows a credit risk improvement of 10%, now flattening. US Retail has been even stronger, particularly after Covid lockdowns ended. Mortgage REITs have underperformed, giving up all their post-Covid gains. The worst performer is the combined Industrial & Office category, with a 12M credit deterioration of 10%. This suggests that any Industrial improvements have been more than weighed down by problems in the Office sector.
The next set of 4 charts plot the 2-year Credit Consensus Indicators (CCIs).


The US REIT universe actually turned positive this month after being in net downgrade territory for most of the past year. Industrial and Office shows the largest downgrade bias in this period, although the pace has recently eased. Retail shows a positive credit outlook in the latest month, but Mortgage REITs are mired in downgrades with only brief moments of modest respite.
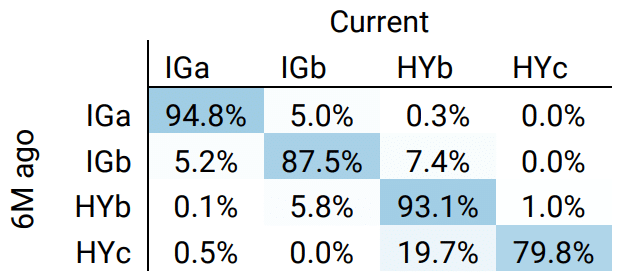
Global Corporates
Global Financials
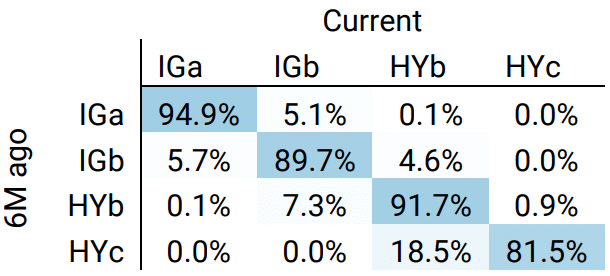
Transition Matrices can be slow to adjust when credit conditions are changing rapidly. Both categories of borrowers still show a very skewed bias to upgrades; Global Financials have 31.6% upgrades vs. just 10.6% downgrades; a ratio of ~3:1.
Global Corporates have a similar ratio with 31.3% upgrades vs. 13.6% downgrades.
However, the majority of these upgrades are within the High Yield categories. In Investment Grade, both Corporates and Financials, show a more balanced position: 5.2% upgrades vs. 5.0% downgrades for Corporates and 5.7% upgrades vs. 5.1% downgrades for Financials.
In the crossover category, Corporates are skewed to downgrades (5.8% vs. 7.4% downgrades) and Financials are biased to upgrades (7.3% vs 4.6% downgrades).
In the second half of 2023, the “Downgrade Triangle” (the upper right) is likely to dominate.
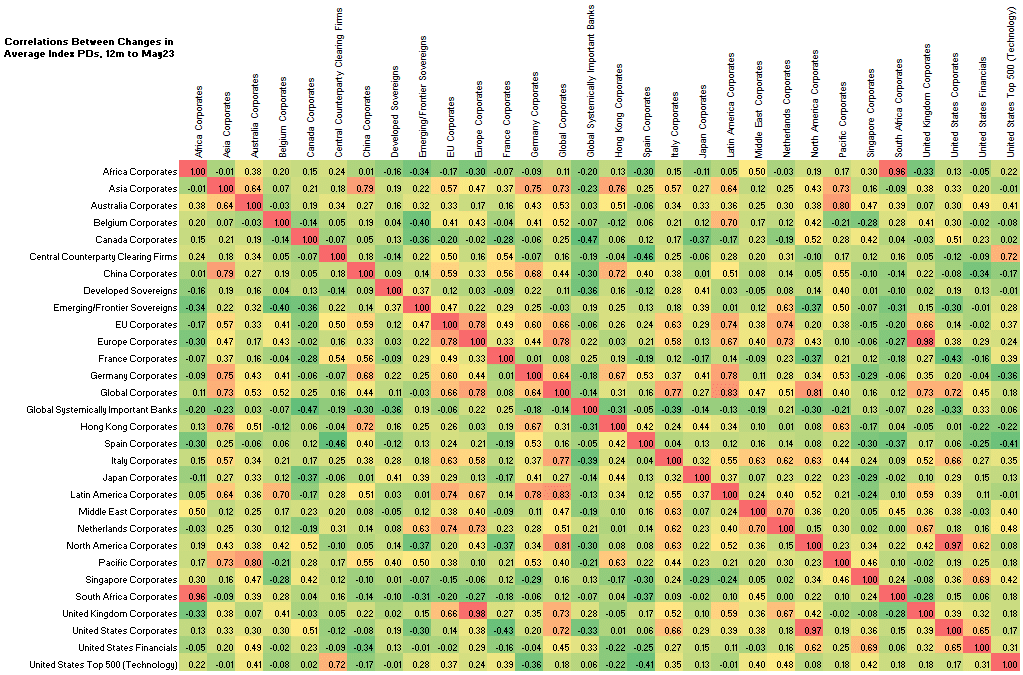
The matrices below are based on credit index changes for the past 12 months. Post-Covid correlations are still low and, in many cases, slightly negative. Continental European and Asian indices show some surprisingly high correlations, while North America and the UK currently form a separate block. This is consistent with the more robust economic news from the latter economies.
Corporate Credit Correlations by Geography
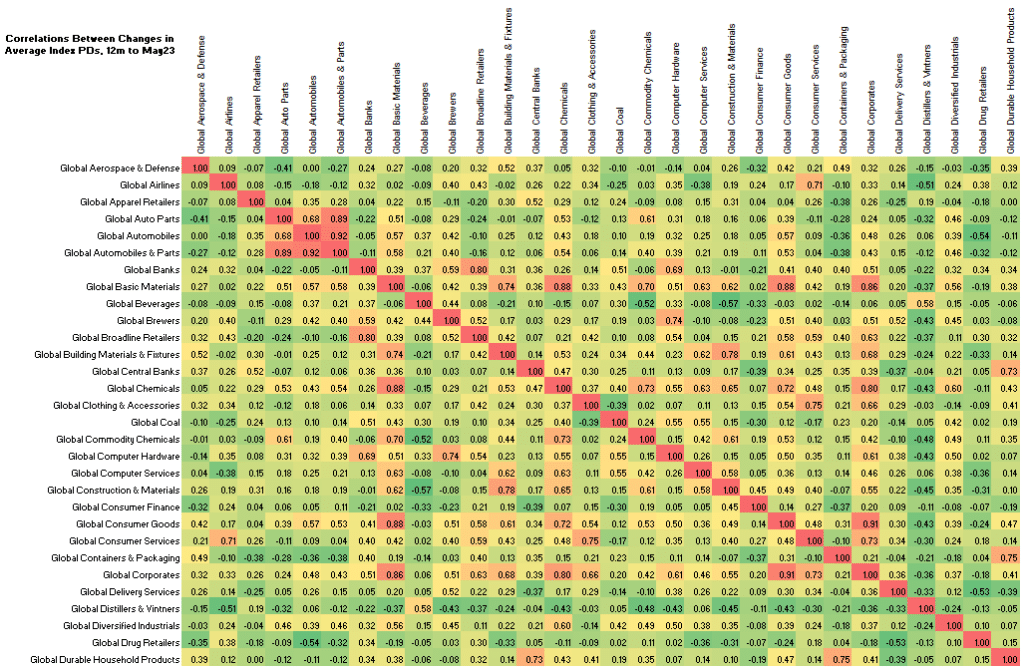
Credit Correlations by Industry
[1] The CCI tracks the total number of upgrades and downgrades made each month by credit analysts to chart the long-term trend in analyst sentiment. A monthly CCI score of 50 indicates neutral credit quality, with an equal number of upgrades and downgrades made over the course of a month. Scores above 50 indicate that credit quality is improving. Scores below 50 indicate that credit quality is deteriorating.
[2] The actual plotted range is small (about 4% of the average value). Changes in dispersion are more marked at the single name level – for example, when a legal entity is downgraded, the range of PD estimates usually increases.

