
The credit optimism of early 2023 has faded as higher interest rates bite. Hopes for a soft landing centred on slowing inflation and an end to rate hikes, but the growing impact of current interest rate levels has blindsided markets: depositor fright at Treasury bond losses pushed 40-year-old Silicon Valley Bank into insolvency in 40 hours. Mark-to-market interest-sensitive losses for the global banking system may be in the low $trillions[1].
Post-2008 regulations established a safer group of global banking giants, but created a fertile environment for an enormous shadow banking industry which now includes insurance companies, various funds (hedge, mutual, pension, private equity, venture capital, sovereign wealth, ETFs, CLOs) and speciality lenders; plus the entire crypto industry which, at its peak, issued nearly 23,000 mini-currencies, some with their own exchanges and quasi-banks.
As interest payments have risen and resets loom, the shadow banking ecosystem has buckled; leaving some participants stuck with illiquid and possibly valueless assets. A flight to quality by depositors has hit smaller traditional banks hard, and more industry consolidation seems inevitable.
The financial sector is globally connected so problems can be highly contagious. Compared with 2008, Governments are now more prepared to follow Kindleberger’s advice[2] – ensuring system liquidity to allow an orderly de-leveraging.
But Credit Suisse shows that even the largest, well-regulated banks are not immune – traditional corporate borrowers face higher rates, less credit availability, tougher loan to value terms and difficult rollovers. If business defaults keep rising, more bank capital is needed to absorb the shocks.
Swap markets increasingly expect an end to Fed hikes and even a rate cut this year. But the Fed may be trying to avoid that through the Bank Term Funding Programme (“BTFP”) that underwrites redemption values for high quality bonds held by banks for a year. Other Central Banks may adopt a similar approach if necessary. The ECB claim that banking system stability is possible without abandoning the fight against inflation – code for further rate hikes even if their banks spend some time on state life support.
The Economist summarizes the policy dilemma: “Alongside this generosity [i.e. the BTFP] lies an uncomfortable truth. To squeeze inflation out of the economy, the Fed needs to make lenders nervous, loans expensive, and businesses risk-averse.”
In addition to the usual global corporate roundup, this report puts a major focus on credit risks in the global financial sector, including some insight into the usually opaque shadow banking system.
It also includes a CCI chartbook showing upgrade/downgrade balances for selected Credit Benchmark credit indices.
The chart below covers a universe of approximately 1,200 credit indices. The proportion showing net credit upgrades has dropped sharply in recent months – less than a third of indices are currently biased to upgrades.
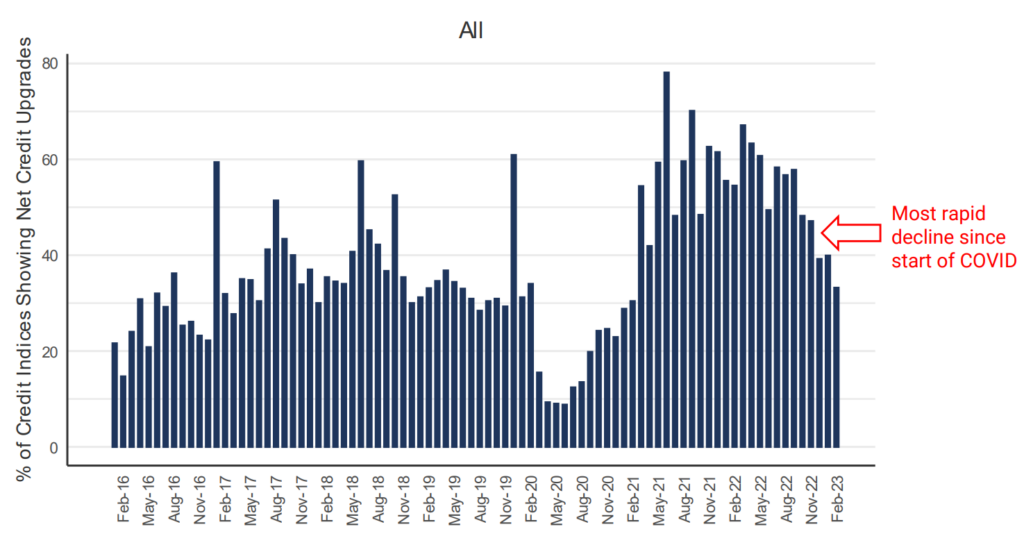
While the post-COVID recovery is clearly over; the % changes in default risk are still modest. But this highlights the unusual breadth of the shift towards downgrades.
The charts below show details for index types and regions. Upper charts show the proportion of indices upgrading over time. Lower charts show the current split between downgrades, no change, and upgrades.
All


Corporates


Financials


Funds


Europe


North America


Asia


Africa


The trend is down for all of these, apart from Funds (more than a third of indices are currently biased to upgrades) and Financials.
Financials show a higher proportion of stable indices than Corporates; Corporates have swung the balance between upgrading and downgrading indices to downgrades after a couple of stable months.
Europe is declining off a relatively high base; North America is on its fourth month of declines. Asia returns to decline; Africa has been flagged up since Q4 2022 and shows another drop this month.
The table below shows detailed global industries and sectors that may be at turning points. These have either started to show negative balances after a run of positives, or vice versa.
Sep-22 to Nov-22 all positive CCIs, Dec-22 to Feb-23 at least 1 negative CCI:
Sep-22 to Nov-22 all negative CCIs, Dec-22 to Feb-23 at least 1 positive CCI:
There are more than twice as many Global indices in the left column. These trend shifts are spread across diverse sectors: Basic Materials, Oil/Gas, Consumer, and various Financials and Funds – including Venture Capital and Private Equity.
Global REITs, Mutual Funds and Hedge Funds
The below industries and sectors have all had a run of multiple consecutive months of net deterioration[3].


Problems in the commercial real estate sector are well known and many of the consensus credit subsector indices are now heading down (starting with Industrial and Office in late 2022). Equity volatility and interest rate risks have not surprisingly hit Hedge Funds, but Mutual Funds are usually credit-stable. LDI issues in the UK, possibly illiquid holdings, and general outflows have all contributed to modest re-assessment.
US Financials (Banks, Insurance, Asset Managers)
These show multiple months of recent deteriorations ahead of this month’s volatility, but with a pause in the latest data for US Banks and Asset Management.


Banking issues are covered in detail in this report, but there are concerns that financial volatility and credit issues may also affect insurance companies. Insurance companies (and pension funds) have the advantage of being able to take a long-term view, but they are not immune to industry issues.
US Technology
US Technology is still suffering, especially the larger listed firms, and Telecomms have returned to significant net deterioration.


Technology sector layoffs continue while start-ups now face the prospect of a funding crunch in coming months if credit remains tight for their backers. Credit downgrades have been concentrated in some of the largest firms, mainly those with a major social media or online presence.
Investment in climate technology is growing rapidly (key priority in the 2024 US Budget) so the tech sector may start to show some divergent credit trends.
Telecomms took a major hit after COVID lockdowns ended; after the recent pause latest data shows risk of further bad news.
The BTFP effectively allows the lender of last resort to offer a classic banking service – maturity transformation – to commercial lenders; provided those lenders have collateral with low or no credit risk. They can borrow against the par value (and pay interest) while they re-establish their depositor base. But many banks do not have that type of collateral and have increasingly nervous depositors. And the US banking system has nearly 5,000 banks in the FDIC system – many of them small and local, often specialising in one sector (e.g., agriculture)[4].
The charts show that less than half of the Credit Benchmark universe of 102 Regional Banks are rated by S&P, and only 26 are listed.


The Credit Benchmark US Regional Banks index (102 constituents) below shows the credit distribution shifting to the right, (i.e., cumulative downgrades) in the past 6 months:

Regional bank solvency is likely to suffer from a flight to quality as depositors abandon smaller, less regulated, less well capitalised banks – relatively good for GSIBs. SVB may also be the tip of a larger bank risk iceberg – as rates rise and liquidity tightens, defaults will climb; even the largest banks need to reserve against those, and they need to raise capital more widely. At the very least, this means cash calls and rights issues – negative for share prices.
The non-bank funding sector is estimated to be as much as 30% of the overall financial system. The charts below show some sub-sector trends.


The improving trends that began in August 2022 have now run their course, but tighter credit has had little impact on average default risks; the only area that shows a recent downturn is Specialized Lending. The SVB collapse and the crackdown on crypto markets may bring opportunities, but some contagion is also likely – these effects may play out very differently for individual firms in these subsectors depending on their individual exposures and access to spare funds.
The Credit Benchmark Leverage Loan universe now covers about 1,200 issuers (69% North America, 29% Europe). The charts below show the latest trends.


The average PD shows a drop this quarter, driven by a large number of downgrades at the end of the year. The bias to downgrades continued into Q1 2023. The credit distribution has shifted in recent months – there are more issuers in the c category, but also more in the bbb groups. This suggests that – like some other sectors covered in this quarterly – there may be two tiers emerging. Stronger issuers will see upgrades, weaker issuers may have to withdraw.
The chart below shows percentiles for credit index 6-month rolling volatility. For more than 1,200 indices, rolling volatility shows the speed and scale of PD changes; these can give advance warning of changes in transition rates. The percentiles plotted here are the most sensitive to turning points in PD volatility. The equity VIX is from the St. Louis Fed.

Based on these percentiles, credit volatility is back to Q2 2022 levels after climbing steadily in the second half of last year. This is consistent with a “soft-landing” and expectations that the Fed will pause rate hikes soon and could even cut rates this year (despite the Fed’s continued hawkish rhetoric). March equity VIX peaked at more than 30%, but started and finished the month at about 20%. Recent issues in the banking sector will likely feed into financial credit volatility in coming months, but until those issues lead to a sustained contraction in bank lending, broader credit volatility is likely to remain subdued.
Global Corporates
Global Financials
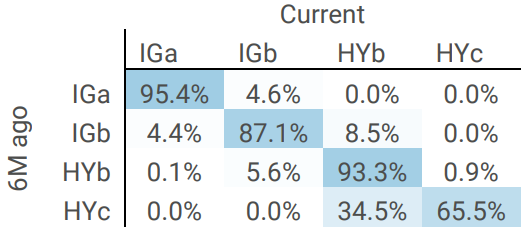
Both categories of borrowers show a very skewed bias to upgrades; Global Corporates have 44.6% upgrades vs. just 14% downgrades; a ratio of 3:1.
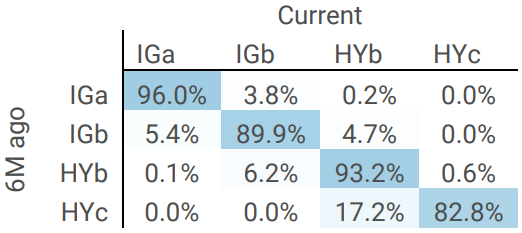
Global Financials have an almost identical ratio with 28.9% upgrades vs 9.3% upgrades.
However, the majority of these upgrades are within the High Yield categories. For Investment Grade, Corporates are balanced (4.4% upgrades vs. 4.6% downgrades) while Financials show 5.4% upgrades vs. 3.8% downgrades.
In the crossover category, Corporates are skewed to downgrades (8.5% vs. 5.6% downgrades) and Financials are biased to upgrades (6.2% vs 4.7% downgrades).
As 2023 unfolds, the “Downgrade Triangle” (the upper right) is likely to dominate.
[1] “The prop-up job”, The Economist, March 18th 2023
[2] “Manias, Panics and Crashes”, 1978, Charles P. Kindleberger
[3] The CCI tracks the total number of upgrades and downgrades made each month by credit analysts to chart the long-term trend in analyst sentiment. A monthly CCI score of 50 indicates neutral credit quality, with an equal number of upgrades and downgrades made over the course of a month. Scores above 50 indicate that credit quality is improving. Scores below 50 indicate that credit quality is deteriorating.
[4] Silicon Valley Bank – officially “regional” – was the 16th largest in the US before being acquired. It is the latest casualty of the Fed assault on inflation[1]. Regulated as a regional bank, it certainly specialised in one sector – tech – but with a global reach. With assets of less than $250bn, they benefited from looser regulation and built a loan portfolio of start-ups with limited assets, patchy cash flows, and no profits. Customers included Biotech, Fintech, Crypto and even California wineries. COVID and war put many venture capital projects on hold, so SVB had excess deposits which it invested in medium maturity US Treasuries. If the Fed pivoted and interest rates dropped, SVB would profit; but rates rose – the classic banking trap of borrowing short and lending long. In the same week that SVB were shut down, two crypto banks closed – Silvergate (voluntary) and Signature (FDIC), both due to bank runs and similar duration mismatches in Treasuries. SVB’s loan book was also squeezed by a tech recession that has brought layoffs to Amazon, Meta, Twitter etc.

