
May 2017
Oil and Gas Industry Trends
Download the PDF “Oil and Gas Industry Trends”
This paper uses bank-sourced data to track recent credit risk trends in the Oil and Gas industry. The data covers 384 legal entities of which 185 do not have a Long Term rating from any of the “Big Three” credit rating agencies as of February 2017.
This dataset provides transparency for global, regional, corporate hierarchy and individual legal entity factors. It can also be used to estimate a range of metrics which track monthly changes in the position and shape of the distribution of bank credit risk estimates.
The dataset provides an independent dimension for sector credit analysis as well as for detailed comparisons with macro- and micro- factors, including oil prices, debt levels, capital expenditure, rig counts, CDS prices and equity price performance.
“…the faster decline in long-term oil prices than we expected this year is a clear downside risk to our spot price level forecast, even if it helps slow US production growth…”
Goldman Sachs // May 2017
“A surge in production in the US, driven by drillers flocking to American shale basins, at a time of subdued global demand has sent the oil price tumbling in recent weeks. Investors are particularly worried about slowing Chinese demand as shale output in the US soars…The US Energy Department expects production to hit 9.7m barrels a day in 2018 – breaking the record set in 1970. Figures from industry experts Baker Hughes show the number of oil rigs operating in the US has more than doubled in the last year, rising by 450 to 870.”
Hugo Duncan // ThisIsMoney // May 2017
Working with key global banks, Credit Benchmark (CB) have developed an anonymous and secure pool of internal bank credit risk estimates, to create consensus Probabilities of Default (“PD”) and senior unsecured Loss Given Default (“LGD”) metrics.
The Credit Benchmark service offers monthly updated consensus PDs and LGDs on thousands of obligors at the individual legal entity level, extending from Sovereigns and banks to public and private corporates and funds. Credit Benchmark also offers data on tens of thousands of obligors for use at portfolio level.
Quorate consensus PDs are simple, unweighted averages of at least three independent PD or LGD contributions for an identical legal entity over an equivalent estimation period.
Participation in the service is open to any banks that use the IRB method for calculating regulatory capital. Credit Benchmark warmly invites interested institutions to become contributors.
The Oil and Gas industry has recovered some ground after the sustained weakness of the oil price over the past few years, but industry dynamics are changing. This is partly due to geopolitics and climate change, but it is also being driven by technological developments: hydraulic fracturing (“fracking”), electric vehicles, drones and exploratory data analysis all have the potential to transform the economics of the energy business. The possibility of a sustained supply glut has returned, leading to renewed oil price weakness. The broader energy industry is also currently the subject of strong debate. Concerns about pollution and the possibility that human activity is partly responsible for climate change has brought increased focus on renewable and clean sources of energy. Investment has been significant in wind, tidal, solar and biofuel technologies; but air, water and land travel continue to be dominated by fossil fuel energy sources. The current enthusiasm for electric vehicles is also misleading – electricity still has to be generated somewhere, albeit in rural locations. Although there is scope for distributed generation, the amount of electricity generation required to replace all oil-driven cars is likely to require major investment in new power stations.
With no immediate, significant technological replacement for fossil fuels, the focus is on the discovery of new reserves and the technology to access otherwise inaccessible deposits. Hydraulic fracturing has been the main technique to derive new supply out of existing basins. It is controversial, but attracts senior political support in a number of countries. Due to its geology (as one of the world’s largest river basins), the US is and is likely to remain the world’s main supplier of shale oil. This has made the US one of the global swing producers, upsetting the existing balance of pricing power in the oil industry. In particular, production cuts by the OPEC nations now have a limited impact on the oil price.
Drone technology is being used to monitor existing, remote production sites as well as in the search for new deposits. Ironically, climate change is opening up the Arctic, which is expected to yield significant reserves. Data mining techniques are making more efficient use of geological data, which is reducing the cost of reserve acquisition. Tanker design continues to deliver additional economies of scale and a growing global pipeline network is reducing supply volatility and vulnerability to political shocks.
This paper presents bank-sourced credit data on 3841 Oil & Gas industry players, including those without stock market listings or without ratings from major agencies. It reviews recent industry trends and compares banksourced credit data to a number of other industry metrics.
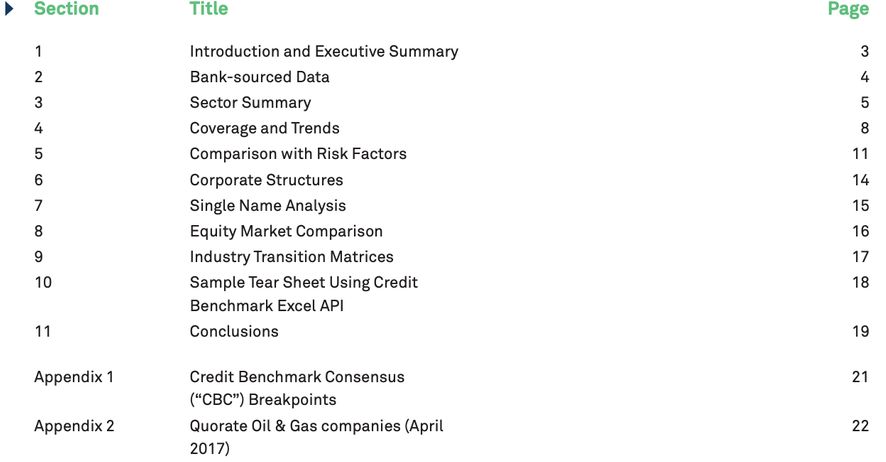
Credit Benchmark aggregates and anonymises one-year forward-looking through-the-cycle Probabilities of Default (“PD”) at the individual obligor level from internal ratings based global banks. The dataset is updated and published monthly. Exhibit 2.1 shows the current coverage.
Exhibit 2.1.1 Global Coverage
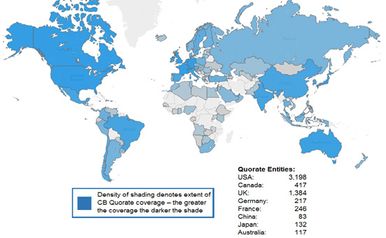
Exhibit 2.1.2 Dataset Growth
As of May 2017, consensus quorate2 estimates are available on more than 8,200 obligors including Sovereigns, corporates, banks, funds and non-bank financial entities, spanning multiple geographies and entity sizes. The dataset also includes close to 300,000 additional mapped entities that can be leveraged to produce top-down portfolio views, indices and transition matrices.
The single name estimates represent the consensus of the collective views of credit risk from experts in global banks. This approach leverages the Diversity Prediction Theorem3 , with single PD estimates aggregated and mapped to the Credit Benchmark Consensus (“CBC”) category scale.4
Oil company coverage now includes Saudi Aramco. Its planned IPO could make it the largest company in the world. In the view of IRB banks, Saudi Aramco currently has a CBC of a-.
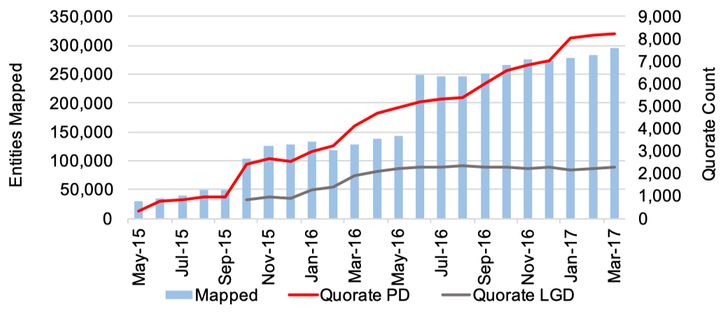
Exhibit 3.1 shows the time series of the two main oil price benchmarks5 , Brent (the European benchmark) and West Texas Intermediate (the US benchmark), from January 2000. This chart covers part of the period of intense debate about “Peak Oil’, representing a serious concern that the global economy was in danger of running out of oil due to the declining trend in discoveries of new reserves. This concern prompted sustained investment in new technology; fracking, in particular, has had a major impact on price and volume dynamics.
The series track very closely except for the period 2011-15, when WTI was systematically lower than Brent.
This shows the major spike and subsequent collapse in oil prices in 2008. The 2009-11 uptrend is followed by the plateau of 2012-2014. After the most recent sharp drop in 2014-2015, prices have shown a modest recovery.
› Source: Energy Information Administration
Exhibit 3.2 shows the relationship between Brent prices and volumes between Jan 2014 and March 2017.
Exhibit 3.2.1 Price & Volume: Time Series
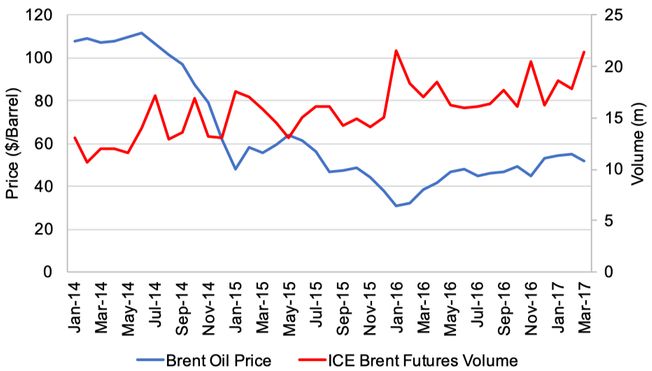
Exhibit 3.2.2 Price & Volume: Phase Plot
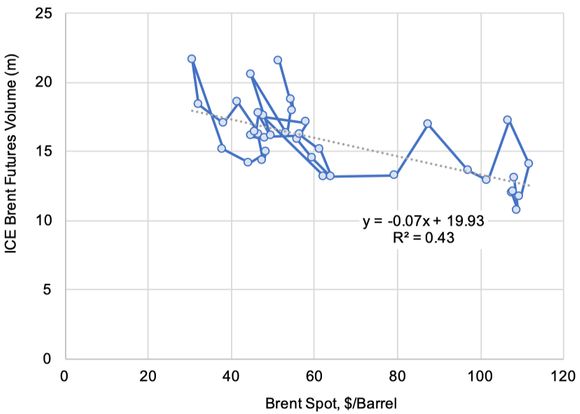
Exhibit 3.2.1 shows a strongly negative trend in the spot price and a moderately positive trend in traded futures volume. Both have been trending higher since the beginning of 2016.
Exhibit 3.2.2 shows the trend as a phase plot (a “snail trail”). This shows two distinct sets of price and volume data points, separated by the large and independent shift in oil prices from mid-2014 until end-2015.
Exhibit 3.3 shows the breakeven production costs per barrel in major oil-producing countries, with capital expenditure (‘capex’) and taxes shown as separate elements.
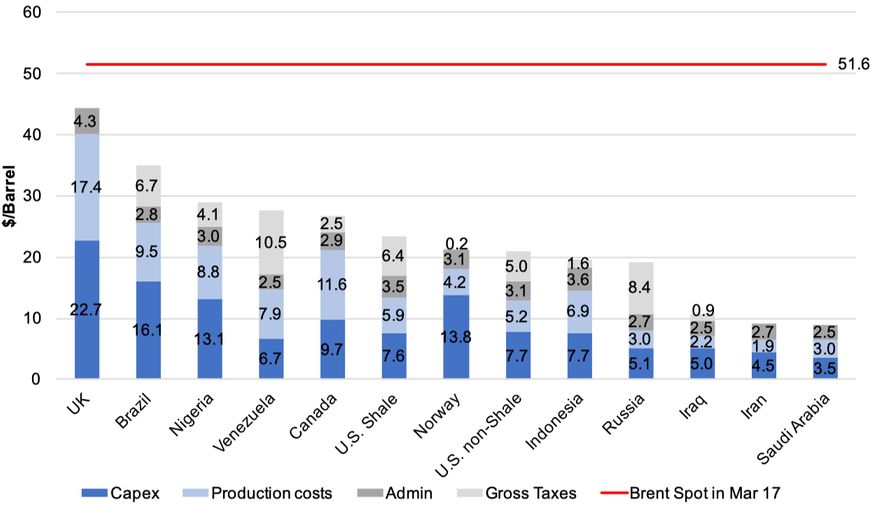
This shows that there are major country differences in the breakeven price. In the UK, current prices are close to production costs. In a number of other countries, profit taxes increase the breakeven price significantly. Some countries responded to this margin compression by making major cuts in investment.
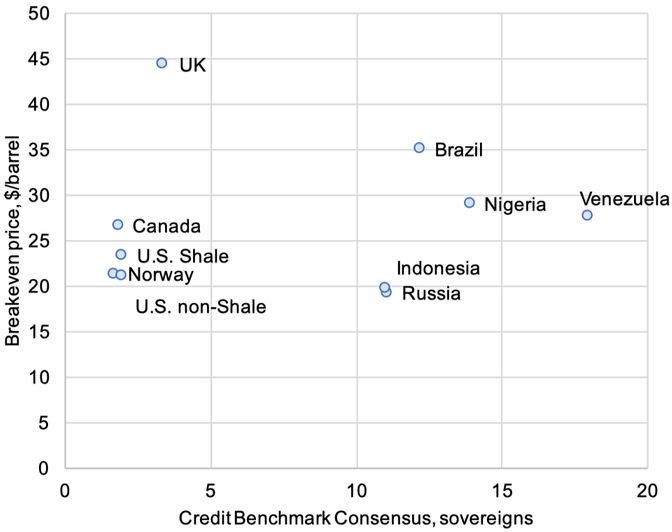
Exhibit 3.4 plots the Credit Benchmark Consensus (“CBC”) and the oil production breakeven price.
Exhibit 3.4.1 Sovereigns CBCs and Breakeven Price Exhibit
3.4.2 Average O&G Companies CBCs and Breakeven Price
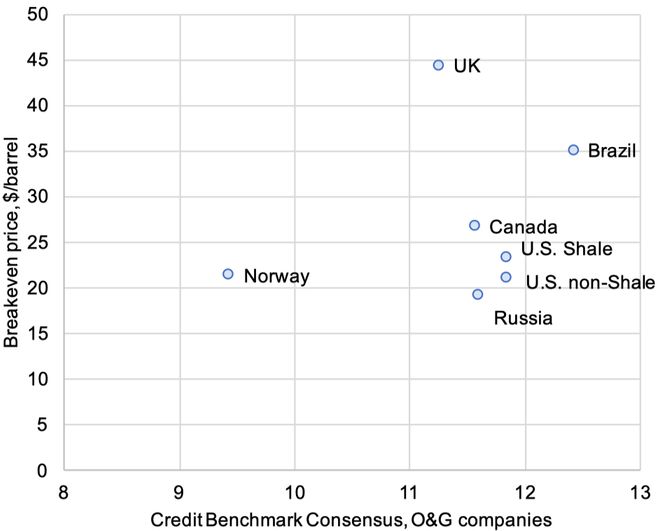
This chart plots the breakeven price against sovereign PD, and against the average PD of the Oil & Gas companies in the corresponding countries. While a number of countries with higher breakeven costs also have lower credit risk (i.e. a higher numerical CBC), these charts do not suggest a strong bivariate relationship.
Exhibit 3.5.1 shows trends in rig counts in North America compared to other regions and Exhibit 3.5.2 shows the connection between North American rig counts and WTI Spot. The majority (>80%) of North American rigs produce so-called ‘tight’ oil (mainly shale deposits). Tight oil production costs are high, so rig counts would be expected to be very sensitive to price changes.
Exhibit 3.5.1 Rig Counts by Region
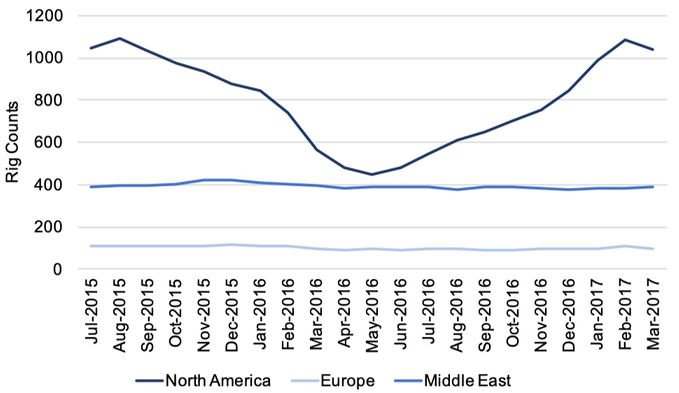
Exhibit 3.5.2 North American Rig Count and WTI Price
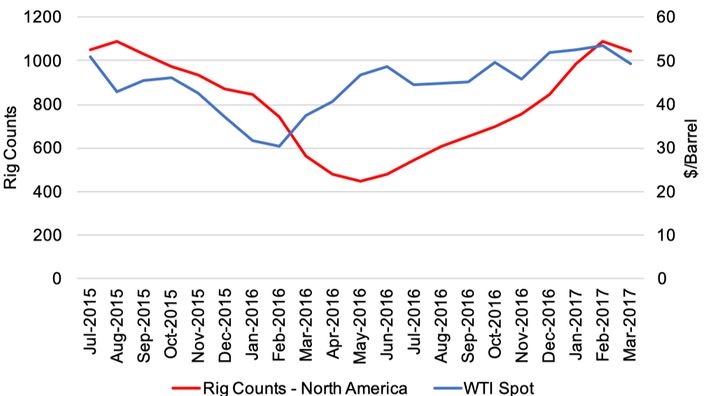
Exhibit 3.5.2 shows that the number of rigs decreases almost immediately when prices drop, but an expansion in rig counts responds to price increases with a lag of several months.
Oil price drops have a redistributive effect on oil-importing and oil-exporting countries. Exhibit 3.6 shows the impact of recent price changes on Sovereign credit risk.
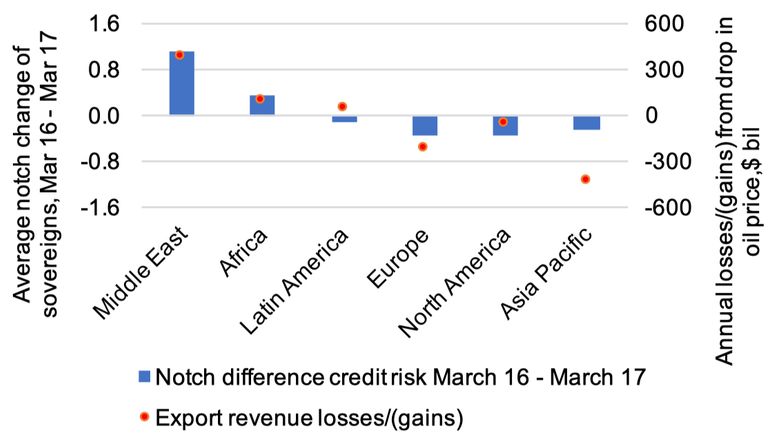
This shows that, over the period March 2016 – March 2017, Middle Eastern and African sovereigns were on average downgraded by 1.1 and 0.6 notches respectively. European, North American and Asia Pacific sovereigns were on average upgraded by 0.2-0.3 notches. Middle East and Africa experienced the largest drops in revenue over this period, while Asia Pacific and Europe were the main beneficiaries.
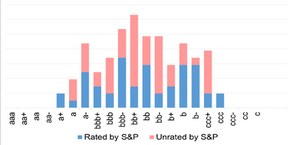
Exhibit 4.1 shows the credit distribution of the Oil & Gas sector for the 384 companies covered by Credit Benchmark.
Exhibit 4.1.1 Rated vs Unrated Obligors
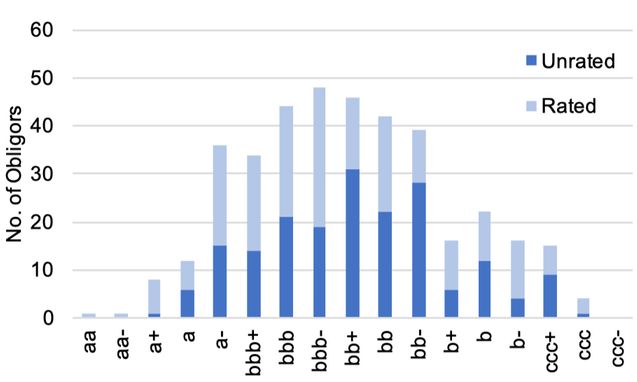
Exhibit 4.1.2 Oil and Gas vs All Corporates
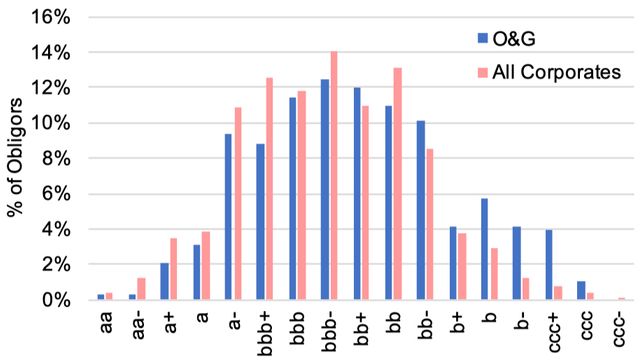
Exhibit 4.1.1 shows that 185 of the 384 Oil & Gas companies are not rated by the “Big Three” credit rating agencies and the majority of these entities are in the high yield category. Exhibit 4.1.2 shows that compared to all corporates distribution there are more Oil and Gas companies in high yield categories b and ccc.
The Dow Jones Oil & Gas Titans Index represents the largest companies in the industry; Credit Benchmark data covers 29 of the 30 constituents6 . Exhibit 4.2 shows the time series of the Titans index compared with the average CBC of these constituents.
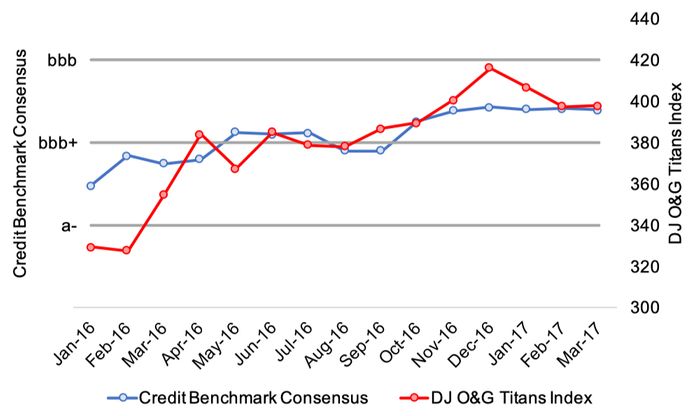
This shows that the Dow Jones Oil & Gas Titans 30 Index has risen more than 20% since January 2016. Over the same period there has been deterioration in the typical credit standing of 29 of these companies. The average rating has fallen one notch from a- to bbb+ over the last year, with 17 out of the 29 entities in the CB dataset showing downgrades7 .
› Source: Bloomberg Finance L.P., Credit Benchmark.
Exhibit 4.3 shows credit risk trends in different sectors of the Oil & Gas industry.
Exhibit 4.3.1 CBC by Sector
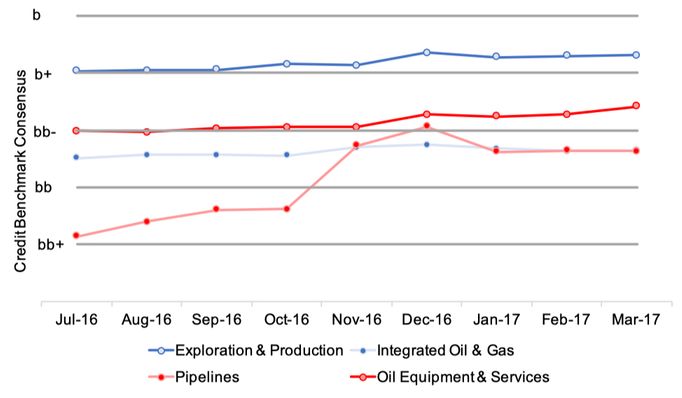
Exhibit 4.3.2 Upgrades and Downgrades July 2016 – March 2017
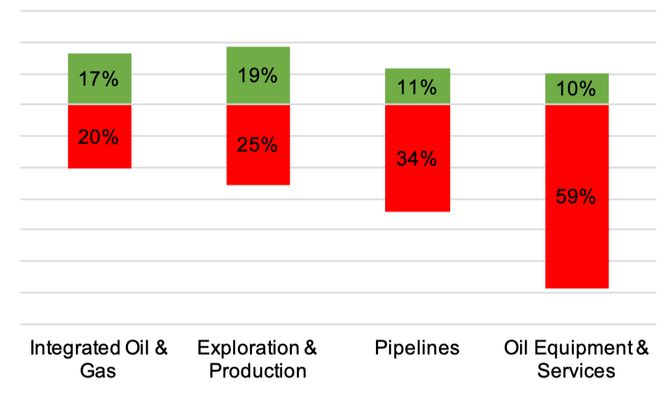
Exhibit 4.3.1 shows deterioration in credit risk in all Oil & Gas sectors except Integrated Oil & Gas. The average CBC for Exploration & Production and Oil Equipment & Services increased by 0.3-0.5 of a notch. The largest deterioration can be observed in the Pipelines sector, where the average CBC notch increased by 1.5 over the last 9 months.
Exhibit 4.3.2 shows that downgrades outnumber upgrades in all sectors. 12 out of 35 companies in Pipelines sector were downgraded while only 4 were upgraded. For Oil Equipment & Services, there are 17 downgrades compared with 3 upgrades.
Exhibit 4.4 shows the relationship between actual and synthetic8 CDS spreads for the 26 quorate Dow Jones Oil & Gas Titans constituents.
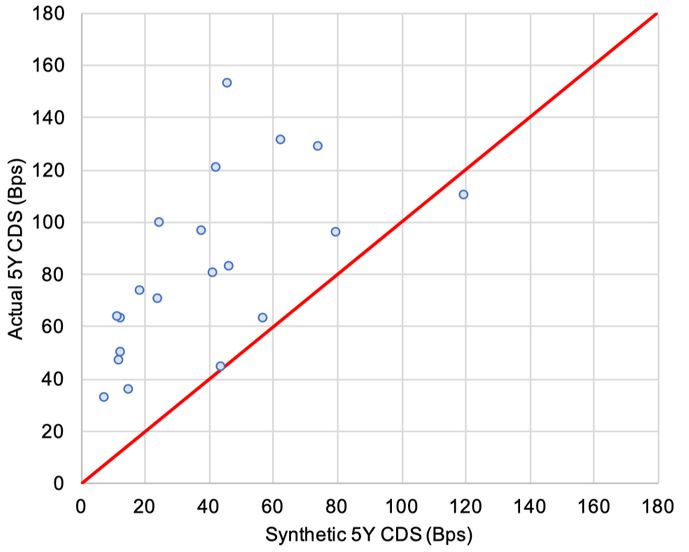
This chart shows the current risk premium (i.e. the difference between risk neutral (i.e. market implied) and real world PDs). If the risk premium is zero, then all of the plotted points will lie on the red line.
Exhibit 4.5 shows the risk premiums by CBC category for the Dow Jones Oil & Gas Titans quorate entities for the period April 2016 to March 2017, as implied by the O&G CDS market. The risk premium is calculated here as the difference between actual and synthetic CDS. It can be viewed as the ‘Market Price of Risk’, a combination primarily of short-term credit adjustments (Point in Time vs. Through the Cycle) and liquidity premiums, as well as a residual term which contains a range of additional second order effects.
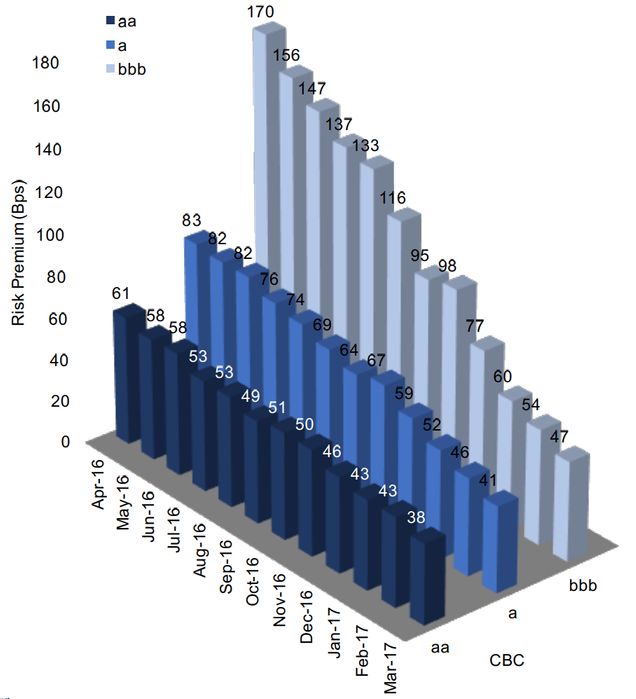
This shows that the risk premium is a positive function of credit risk. The risk premium across all credit categories has been decreasing over the past year, but remains positive, suggesting that the industry credit cycle is moving closer to a recovery. A change to a negative risk premium will represent a key turning point.
With suitable transition matrices, it is possible to estimate PD term structures for different credit classes over time, with applications for the implementation of IFRS9 and CECL accounting requirements. In particular, the transition matrix approach can be combined with the risk premium analysis shown here to derive Point in Time and Through the Cycle term structures.
One of the key advantages of the bank-sourced dataset is that it provides a very large set of Ex Ante PDs. Traditionally, researchers who wanted to understand the relationship between financial fundamentals and default risk have had to rely on sparse Ex Post default history or market data.
With very granular, monthly, PD estimates across a large range of obligors, the Credit Benchmark dataset can be used to test correlations between PDs and a range of macro- (systematic) and micro- (company specific) factors.
Exhibit 5.1 shows the credit risk trends for North American companies in the Exploration and Production (“E&P”) and Integrated sectors.
Exhibit 5.1.1 Average Credit Risk and Oil Price
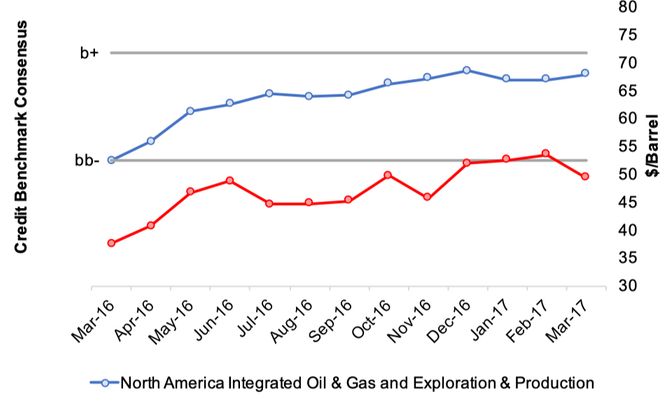
Exhibit 5.1.2 Up/Downgrades and Oil Price Changes
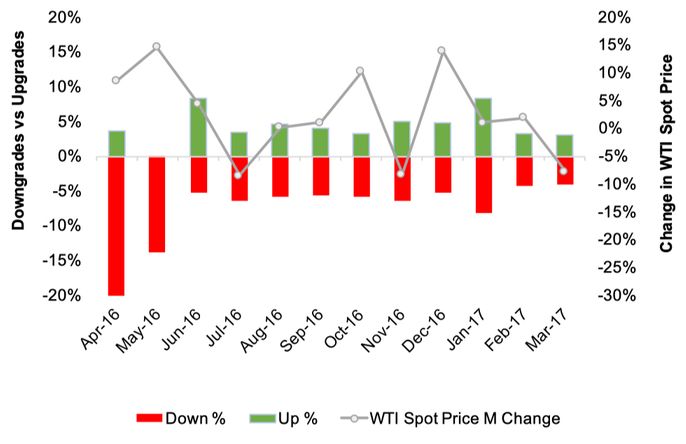
This shows that the credit quality of E&P and Integrated O&G companies in North America has continued to deteriorate, despite rising oil prices. The number of downgrades exceeds the number of upgrades in 10 out of the 12 months plotted here.
The oil price drop had a significant impact on industry capital expenditure (“capex”). Exhibit 5.2 shows the change in capital expenditures of 144 oil and gas public companies.
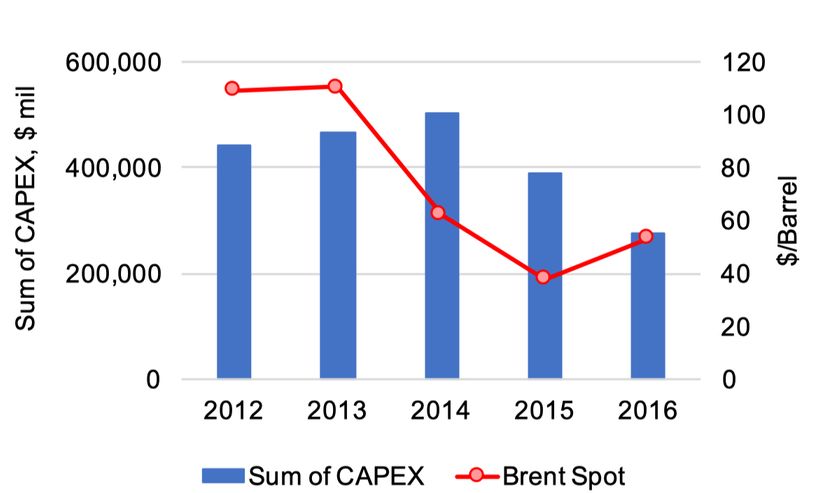
This appears to suggest a one year lag in the reaction of capital expenditures to oil price changes. The Evercore and Cowen and Co. Capex budget survey for 2017 reports that more than 70% of interviewee companies expect to increase their capital expenditure this year, in line with the recent recovery in oil prices.
Exhibit 5.3 shows the relationship between capex and credit risk.

This suggests that investment grade companies show a clear negative relationship between capital expenditure and credit quality. For high yield companies, the relationship is more mixed and one of the highest levels (and ranges) is in the bb- category.
Exhibit 5.4 shows relationship between change in CAPEX between years 2015 and 2016 and change in probability of default between years 2016 and 2017 on company level.
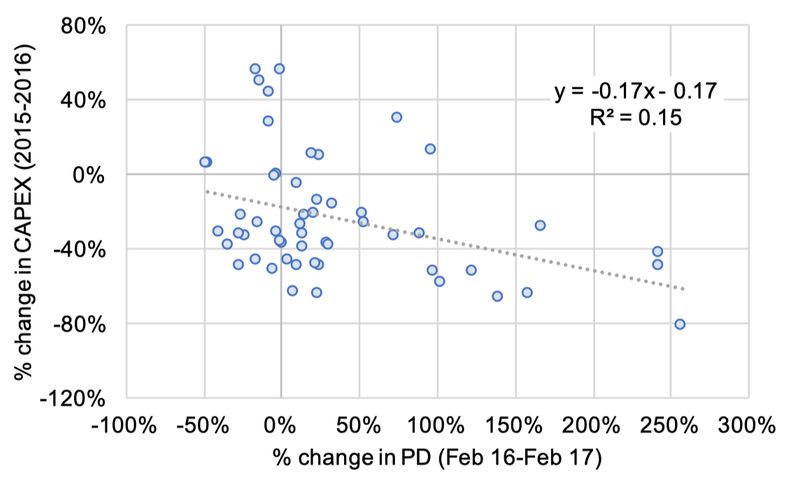
This appears to show a mildly negative relationship between annual change in credit quality and the preceding change in capital expenditures, but in practice there are probably two opposing forces involved. Companies that can cut capex quickly are typically viewed as better credit risks, but companies that can afford to maintain capex in downturns are typically better positioned for the early stages of any upswing. These opposing effects may be the reason for the lack of overall strong relationship. 9
Exhibit 5.5 shows the relationship between Net Debt to Total Assets ratio and individual CBCs.
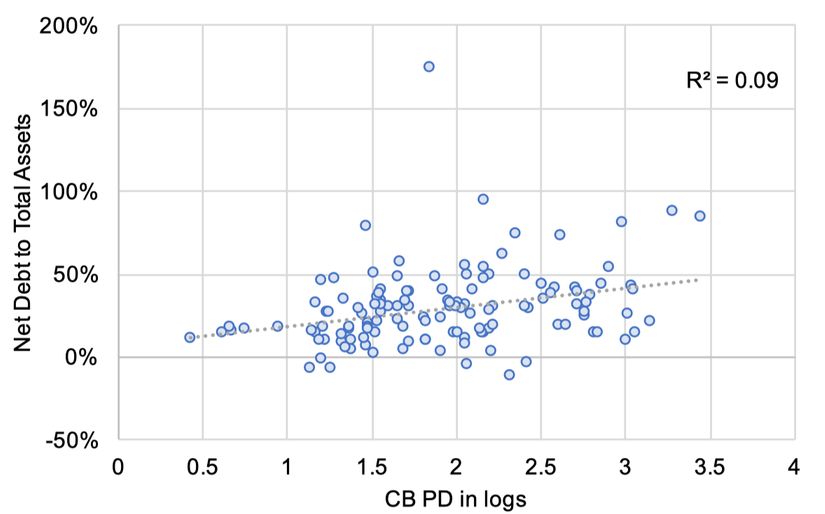
This shows a mildly positive correlation between Net Debt to Total Assets ratio and CBCs.
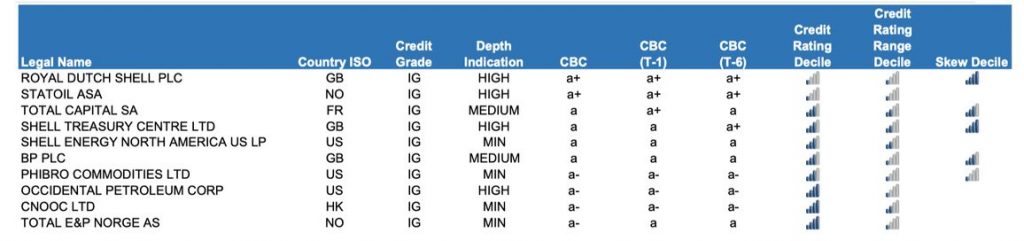
The Credit Benchmark dataset includes Parent as well as Operating Subsidiary legal entities for a large number of corporate families. This provides detailed credit views across corporate structures. Exhibit 6.1 shows the corporate structure of Shell entities in Credit Benchmark quorate dataset, their CBCs, PDs and countries of risk.
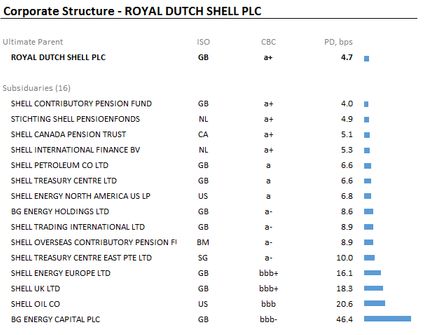
Exhibit 6.2 shows credit trends for chosen entities from the Shell family.
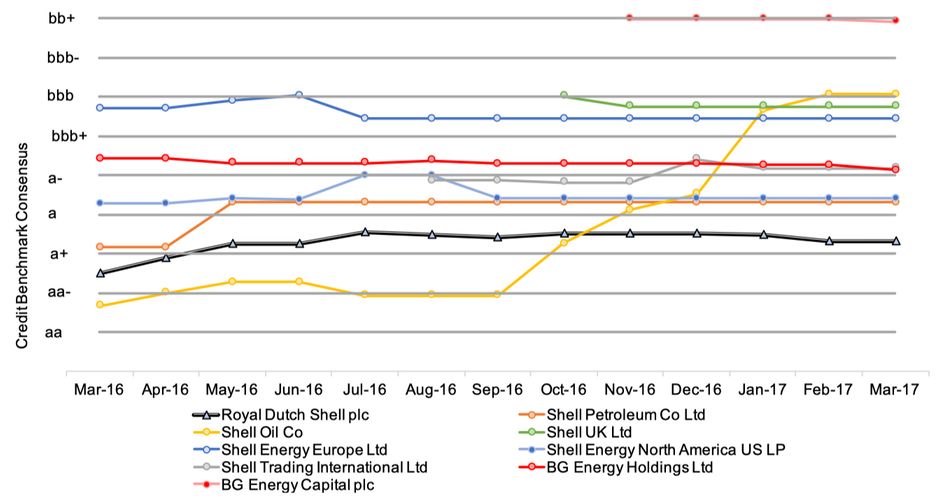
The credit risk profile of Royal Dutch Shell plc deteriorated over the last year as the company was downgraded from aa- to a+. The subsidiary with most significant deterioration in credit risk over the last year has been Shell Oil Co that has been downgraded from aa to bbb. The risk profiles of other subsidiaries were relatively stable over the last year.
For each quorate obligor, the CBC indicates the credit category corresponding to the consensus PD estimate, which is an average across a number of contributions.
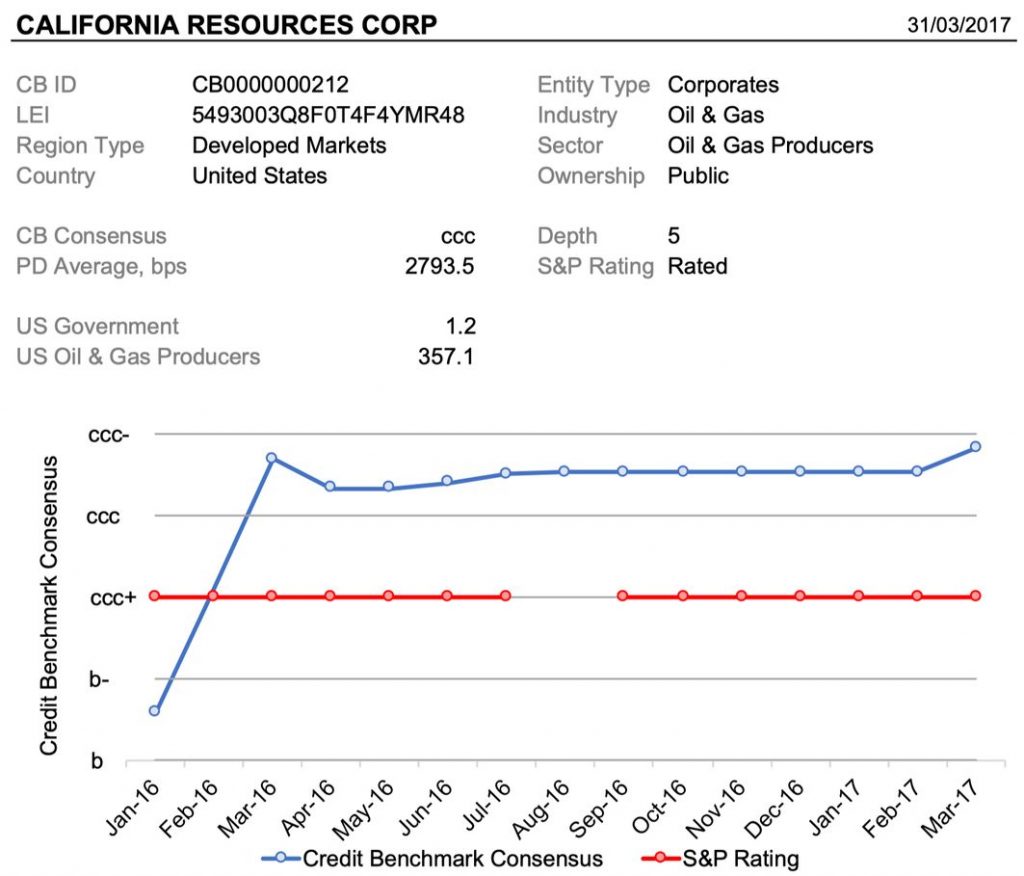
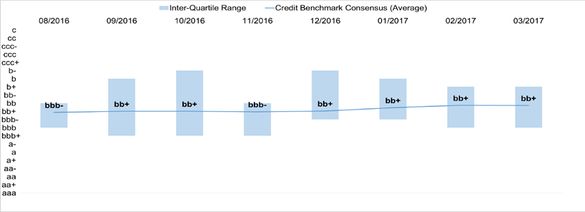
Exhibit 7.1 shows the Credit Benchmark Consensus and company information for California Resources Corporation.10
Within the Credit Benchmark Oil & Gas universe, 144 out of the 384 entities in the dataset have publicly traded equities in issue. 11
Exhibit 8.1 shows the relationship between equity price changes and CBC. Exhibit 8.1.1 compares the CBC level with the one-year share price change. Exhibit 8.1.2 compares the CBC change with the one-year share price change, over the same period.
Exhibit 8.1.1 Stock Price Changes vs. CBC Level
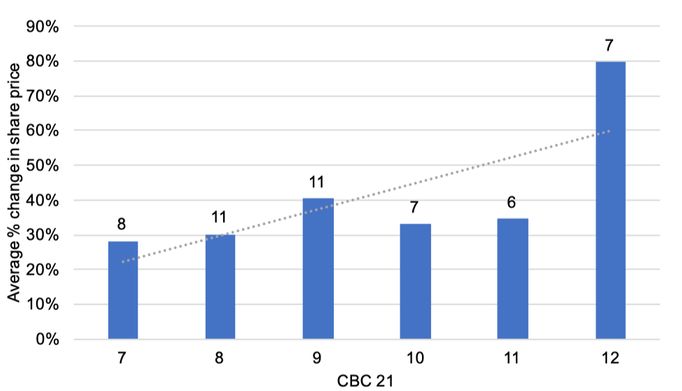
Exhibit 8.1.2 Equity Price Changes vs. CBC Change
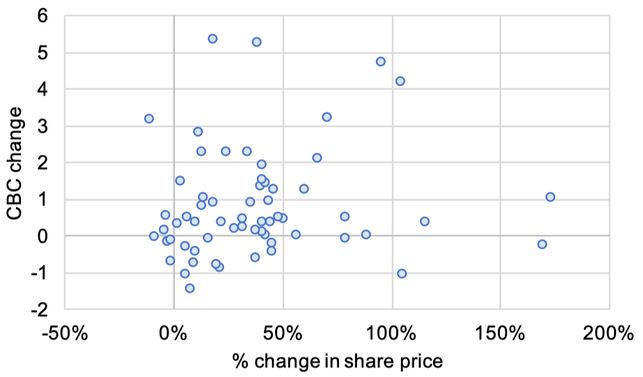
In general, the relationship between credit risk and equity price will depend on the prevailing risk appetite regime. During ‘Risk On’ phases, high-risk assets will show the best performance; during ‘Risk Off’ phases, they will underperform. CBCs reflect a longer-term view of credit risk over an entire credit cycle, so they can provide a clear distinction between high- and low- beta stocks, provided that an investor has a clear view about the prevailing risk regime.
Since CBCs are also available for private companies, they provide some indication of the credit risk of companies that may be planning an IPO, either directly or by comparison with their peer group.
Exhibit 9.1 shows the (January 2016-January 2017) transition matrices for the global oil and gas industry and global corporates.
Exhibit 9.1.1 Global Oil and Gas
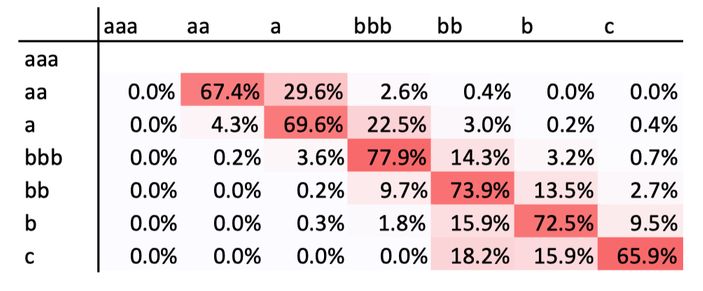
Exhibit 9.1.2 Global Corporates
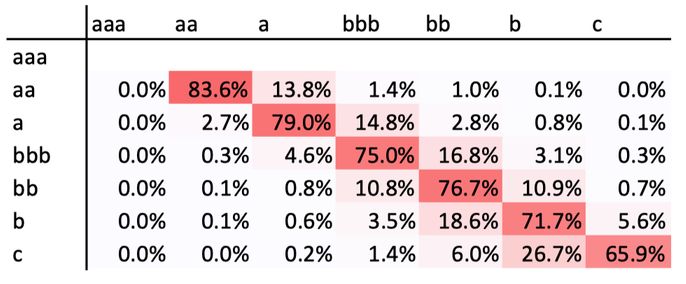
These show that over this period, the oil and gas industry shows a higher frequency of downgrades and a lower frequency of upgrades compared with global corporates.
The proportion of companies emerging from the ‘c’ category is about the same for the oil industry and the global corporate sample.
› To determine that the credit environment in a sector has experienced the ‘significant’ deterioration, one of the key IFRS9 conditions for assessing the need for lifetime impairment estimation
› To derive cumulative, real-world PD term structures as base-level benchmarks for IFRS9 and CECL impairment estimates
These transition matrices are based on Through-the-Cycle / Hybrid (“TTCH”) estimates. These are responsive to structural changes in industry credit cycles, but are not as sensitive and volatile as Point-in-Time (“PIT”) and marketimplied estimates.
It should be noted that there is scope to derive consistent PIT matrices by ‘perturbing’ TTCH matrices using market risk metrics such as equity and bond market volatility, liquidity and credit spreads. Ideally, such an approach should make use of industry-specific data where it is available.
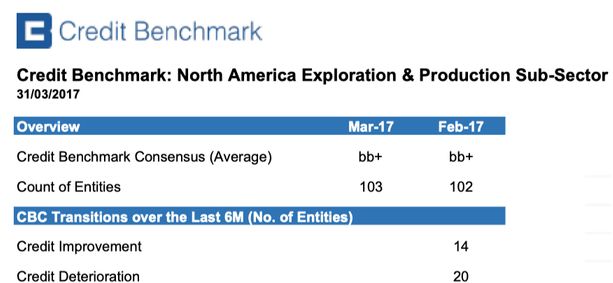
Exhibit 10.1 shows a typical sector tear sheet, constructed using the Credit Benchmark Excel API. This and other templates are available to download; they can be used directly or can be modified to allow combinations of their own data with the bank-sourced data set.
Credit Benchmark Product Specialists can also construct bespoke spreadsheets to suit individual client workflow requirements.
This report has looked at credit trends across the global oil and gas industry using bank-sourced data for the past year. It covers 384 quorate obligors, and includes additional contributed data in aggregate form.

Credit Benchmark Consensus (“CBC”) Breakpoints
| Quorate Oil & Gas Companies (April 2017) | |
| ACTEON GROUP LTD ADVANCED INSULATION LTD AECO GAS STORAGE PARTNERSHIP ALTAGAS LTD ALTAGAS SERVICES US INC AMEC FOSTER WHEELER PLC AMERIGAS PROPANE LP ANADARKO PETROLEUM CORP ANTERO RESOURCES CORP APACHE CORP APACHE NORTH SEA LTD APT PIPELINES LTD ARC RESOURCES LTD ARCHROCK SERVICES LP ASCO ACQUISITIONS LTD ATCO ENERGY SOLUTIONS LTD AUTOBAHN TANK & RAST HOLDING GMBH BAKER HUGHES INC BAYTEX ENERGY CORP BAYTEX ENERGY USA INC BG ENERGY HOLDINGS LTD BHARAT PETROLEUM CORP LTD BLACK STONE MINERALS CO LP BOARDWALK PIPELINE PARTNERS LP BOARDWALK PIPELINES LP BONAVISTA ENERGY CORP BP CAPITAL MARKETS PLC BP CORPORATION NORTH AMERICA INC BP ENERGY CO BP GAS MARKETING LTD BP INTERNATIONAL LTD BP OIL INTERNATIONAL LTD BP PLC BP PRODUCTS NORTH AMERICA INC BP SINGAPORE PTE LTD CABOT OIL & GAS CORP CALIFORNIA RESOURCES CORP CALLON PETROLEUM CO CAMERON INTERNATIONAL CORP CANADIAN ENERGY SERVICES LP CANADIAN NATURAL RESOURCES LTD CARGILL POWER MARKETS LLC CARRIZO OIL & GAS INC CASTLETON COMMODITIES MERCHANT TRADING LP CENOVUS ENERGY INC CHALMETTE REFINING LLC CHENIERE CORPUS CHRISTI HOLDINGS LLC CHEVRON CORP CHEVRON USA INC CHINA NATIONAL CHEMICAL CORP CHINA NATIONAL PETROLEUM CORP CHINA PETROCHEMICAL CORP CHINAOIL HONG KONG CORP LTD CIVEO CANADA INC CIVEO PTY LTD CNOOC LTD CNPC FINANCE HK LTD CNR INTERNATIONAL UK LTD CNX GAS CO LLC COASTAL CHEMICAL CO LLC COLUMBIA PIPELINE GROUP INC CONE MIDSTREAM PARTNERS LP CONOCOPHILLIPS CONOCOPHILLIPS CO CONOCOPHILLIPS TREASURY LTD CONSOL ENERGY INC COSAN LUBRIFICANTES E ESPECIALIDADES SA COSAN SA INDUSTRIA E COMERCIO CRESCENT POINT ENERGY CORP CRESCENT POINT RESOURCES PARTNERSHIP CRESTWOOD MIDSTREAM PARTNERS LP CROSSAMERICA PARTNERS LP CSI COMPRESSCO LP CST BRANDS INC DANA PETROLEUM LTD DCC TREASURY IRELAND 2013 LTD DCP MIDSTREAM LLC DCP MIDSTREAM OPERATING LP DELAWARE CITY REFINING CO LLC DELEK LOGISTICS PARTNERS LP DELEK REFINING LTD DENBURY RESOURCES INC DEUTSCHE RASTSTAETTEN HOLDING GMBH DEVON CANADA CORP DEVON ENERGY CORP DEVON ENERGY PRODUCTION CO LP DEVON NEC CORP DIAMOND OFFSHORE DRILLING INC DOMINION MIDSTREAM PARTNERS LP ECOPETROL SA EDISON TRADING SPA EMPRESA NACIONAL DEL PETROLEO SA ENBRIDGE ENERGY PARTNERS LP ENBRIDGE GAS DISTRIBUTION INC ENBRIDGE INC ENBRIDGE INCOME FUND ENBRIDGE PIPELINES INC |
| Quorate Oil & Gas Companies (April 2017) | |
ENBRIDGE RISK MANAGEMENT INC ENBRIDGE US INC ENCANA CORP ENERFLEX LTD ENERGEN CORP ENERGY TRANSFER EQUITY LP ENERGY TRANSFER PARTNERS LP ENERPLUS CORP ENI SPA ENI TRADING & SHIPPING SPA ENLINK MIDSTREAM LLC ENLINK MIDSTREAM PARTNERS LP ENQUEST PLC ENSCO PLC ENTERPRISE PRODUCTS OPERATING LLC EOG RESOURCES INC EP ENERGY LLC EPCO HOLDINGS INC EQT CORP EQT ENERGY LLC EQT PRODUCTION CO ERA GROUP INC ESSAR OIL UK LTD ESSO THAILAND PUBLIC CO LTD EV PROPERTIES LP EXPRESS ENGINEERING OIL & GAS LTD EXXON MOBIL CORP EXXONMOBIL CAPITAL NETHERLANDS BV EXXONMOBIL SALES & SUPPLY LLC FMC TECHNOLOGIES INC FORMOSA PETROCHEMICAL CORP FORUM ENERGY TECHNOLOGIES INC FUGRO NV GAIL INDIA LTD GAS NETWORKS IRELAND GASLOG LTD GAZPROM MARKETING & TRADING LTD GAZPROM PJSC GEG MARINE & LOGISTICS LTD GENESIS ENERGY LP GIBSON ENERGY INC GIBSON ENERGY ULC GLENCORE SINGAPORE PTE LTD GRAN TIERRA ENERGY INTERNATIONAL HOLDINGS LTD GREATSHIP INDIA LTD GREENERGY FUELS LTD GRUPA LOTOS SA GS CALTEX CORP GS CALTEX SINGAPORE PTE LTD GULFPORT ENERGY CORP HALLIBURTON CO HALLIBURTON ENERGY SERVICES INC HANWHA TOTAL PETROCHEMICAL CO LTD HARVEST OPERATIONS CORP HELMERICH & PAYNE INC HESS CORP HESS INFRASTRUCTURE PARTNERS LP HGIM CORP HINDUSTAN PETROLEUM CORP LTD HOLLY ENERGY PARTNERS OPERATING LP HOLLYFRONTIER CORP HUNTING KNIGHTSBRIDGE HOLDINGS LTD HUNTING PLC HUSKY ENERGY INC HUSKY OIL OPERATIONS LTD HYDRASUN GROUP ACQUISITIONS LTD HYUNDAI OILBANK CORP ICHTHYS LNG PTY LTD INDIAN OIL CORP LTD JONAH ENERGY LLC KEYERA PARTNERSHIP KEYSPAN GAS EAST CORP KINDER MORGAN ENERGY PARTNERS LP KINDER MORGAN INC KOCH GLOBAL PARTNERS LLC KOCH RESOURCES LLC KOCH SUPPLY & TRADING LP KUWAIT FOREIGN PETROLEUM EXPLORATION CO KSC LEGACY RESERVES LP LSF9 ROBIN INVESTMENTS LTD LUNDIN PETROLEUM AB MARATHON OIL CORP MARATHON PETROLEUM CORP MERCURIA ENERGY TRADING SA MIDSTATES PETROLEUM CO LLC MIECO INC MITSUI & CO LTD MOTIVA ENTERPRISES LLC MPLX LP MRC ENERGY CO MURPHY CANADA LTD MURPHY OIL CORP NABORS INDUSTRIES INC NATIONAL FUEL GAS CO NATIONAL OILWELL VARCO INC NAUTICAL SOLUTIONS LLC |
| Quorate Oil & Gas Companies (April 2017) | |
| NESTE CORP NEW YORK STATE ELECTRIC & GAS CORP NEWFIELD EXPLORATION CO NEXEN ENERGY ULC NICOR GAS CO NOBLE AMERICAS CORP NOBLE AMERICAS GAS & POWER CORP NOBLE ENERGY INC NOBLE GROUP LTD NOBLE RESOURCES UK LTD NORSEA PIPELINE LTD NORTH WEST REDWATER PARTNERSHIP INC NORTHERN BLIZZARD RESOURCES INC NORTHERN GAS NETWORKS LTD NSMP TGPP LTD NUSTAR LOGISTICS LP OCCIDENTAL PETROLEUM CORP OCEANEERING INTERNATIONAL INC OIL STATES INTERNATIONAL INC OMAN OIL CO SAOC OMV AG OMV SUPPLY & TRADING LTD ONEOK PARTNERS LP PAN AMERICAN ENERGY LLC, AR PARKER DRILLING CO PATTERSON UTI ENERGY INC PAULSBORO REFINING CO LLC PBF HOLDING CO LLC PBF LOGISTICS LP PDC ENERGY INC PEMBINA PIPELINE CORP PENGROWTH ENERGY CORP PENN VIRGINIA HOLDING CORP PENN WEST PETROLEUM LTD PERENCO PETROLEUM LTD PERENCO PLC PERENCO SA PETROBRAS GLOBAL TRADING BV PETROBRAS INTERNATIONAL BRASPETRO BV PETROBRAS NETHERLANDS BV PETROCHINA INTERNATIONAL LONDON CO LTD PETROFAC INTERNATIONAL LTD PETROFAC INTERNATIONAL UAE LLC PETROFAC LTD PETROINEOS TRADING LTD PETROLEO BRASILEIRO SA PETROLEOS MEXICANOS SA PETROLIAM NASIONAL BHD PETRON CORP PEYTO EXPLORATION & DEVELOPMENT CORP PHIBRO COMMODITIES LTD PHILLIPS 66 PHILLIPS 66 CO PHILLIPS 66 LTD PHILLIPS 66 PARTNERS LP PIONEER NATURAL RESOURCES CO PIONEER NATURAL RESOURCES USA INC PLAINS ALL AMERICAN PIPELINE LP PLAINS MARKETING LP PLAINS MIDSTREAM CANADA ULC PMI TRADING LTD POLSKI KONCERN NAFTOWY ORLEN SA PRAX PETROLEUM LTD PRECISION DRILLING CORP PTT EXPLORATION & PRODUCTION PLC PTT PUBLIC CO LTD PTTEP OFFSHORE INVESTMENT CO LTD RAIZEN COMBUSTIVEIS SA RAIZEN ENERGIA SA RANGE RESOURCES CORP REGIE AUTONOME DES TRANSPORTS PARISIENS, FR RELIANCE INDUSTRIES LTD REPSOL EXPLORACION SA REPSOL INTERNATIONAL FINANCE BV REPSOL OIL & GAS CANADA INC REPSOL SA REPSOL SINOPEC BRASIL SA REPSOL TESORERIA & GESTION FINANCIERA SA RICE ENERGY OPERATING LLC ROS VIT LTD ROSNEFT OIL CO ROWAN COS INC ROYAL DUTCH SHELL PLC RUBY PIPELINE LLC SAIPEM SPA SANTOS FINANCE LTD SANTOS LTD SASOL FINANCING INTERNATIONAL PLC SASOL LTD SAUDI ARABIAN OIL CO SAUDI ARAMCO TOTAL REFINING & PETROCHEMICAL CO SCHLUMBERGER FINANCE BV SCHLUMBERGER HOLDINGS CORP SCHLUMBERGER INVESTMENT SA SCHLUMBERGER NORGE AS SCHLUMBERGER NV |
| Quorate Oil & Gas Companies (April 2017) | |
| SCHLUMBERGER PLC SCHLUMBERGER SA SCHLUMBERGER TECHNOLOGY CORP SCORE GROUP PLC SECURE ENERGY SERVICES INC SEMGROUP CORP SESI LLC SHELL ENERGY NORTH AMERICA US LP SHELL INTERNATIONAL EASTERN TRADING CO SHELL INTERNATIONAL FINANCE BV SHELL OIL CO SHELL PETROLEUM CO LTD SHELL TRADING INTERNATIONAL LTD SHELL TREASURY CENTRE EAST PTE LTD SHELL TREASURY CENTRE LTD SHELL UK LTD SHOWA SHELL SEKIYU KK SINOCHEM INTERNATIONAL OIL LONDON CO LTD SINOPEC CENTURY BRIGHT CAPITAL INVESTMENT LTD SK INNOVATION CO LTD SK LUBRICANTS CO LTD SM ENERGY CO SOUTHWESTERN ENERGY CO SPECTRA ENERGY CAPITAL LLC SPECTRA ENERGY CORP SPECTRA ENERGY PARTNERS LP STATE OIL LTD STATOIL ASA SUNCOR ENERGY INC SUNCOR ENERGY INTERNATIONAL TRADING LTD SUNCOR ENERGY MARKETING INC SUNCOR ENERGY UK LTD SUNOCO LOGISTICS PARTNERS LP SUNOCO LOGISTICS PARTNERS OPERATIONS LP SUNOCO LP TALISMAN SINOPEC ENERGY UK LTD TALLGRASS ENERGY PARTNERS LP TARGA RESOURCES CORP TARGA RESOURCES PARTNERS LP TECHNIP EUROCASH SNC TECHNIP FRANCE SA TECPETROL SA TESORO CORP THAI OIL PUBLIC CO LTD TOLEDO REFINING CO LLC TOTAL CAPITAL SA TOTAL E&P NORGE AS TOTAL GAS & POWER NORTH AMERICA INC TOTAL SA TOTAL TREASURY TOTSA TOTAL OIL TRADING SA TRAFIGURA BEHEER BV TRAFIGURA CANADA GENERAL PARTNERSHIP TRAFIGURA DERIVATIVES LTD TRAFIGURA GROUP PTE LTD TRAFIGURA PTE LTD TRANSCANADA AMERICAN INVESTMENTS LTD TRANSCANADA PIPELINE USA LTD TRANSCANADA PIPELINES LTD TRANSOCEAN INC TRILOGY ENERGY CORP TRINIDAD DRILLING LTD TULLOW OIL NORGE AS TULLOW OIL PLC TULLOW OIL SPE LTD TURKIYE PETROL RAFINERILERI AS UNIPEC ASIA CO LTD UNIPER GLOBAL COMMODITIES SE USAC LEASING LLC VALERO ENERGY CORP VALERO ENERGY PARTNERS LP VALERO MARKETING & SUPPLY CO VALLOUREC INC VALVOLINE INC VELOSI EUROPE LTD VERESEN INC VERMILION ENERGY INC VETCO GRAY CONTROLS LTD VITOL INC VITOL SA VIVA ENERGY HOLDING PTY LTD WEATHERFORD INTERNATIONAL PLC WESSEX PETROLEUM LTD WESTERN GAS PARTNERS LP WHITECAP RESOURCES INC WHITING OIL & GAS CORP WILLIAMS COS INC WILLIAMS PARTNERS LP WOLF MIDSTREAM INC WOOD JOHN GROUP PLC WORLEYPARSONS CANADIAN FINANCE SUB LTD WORLEYPARSONS FINANCIAL SERVICES PTY LTD WORLEYPARSONS LTD WPX ENERGY INC XTO ENERGY INC |
Credit Benchmark is an entirely new source of data in credit risk. We pool PD and LGD estimates from IRB banks, allowing them to unlock the value of internal ratings efforts and view their own estimates in the context of a robust and incentive-aligned industry consensus. The resultant data supports banks’ credit risk management activities at portfolio and individual entity level, as well as informing model validation and calibration. The Credit Benchmark model offers full coverage of the entities that matter to banks, extending beyond Sovereigns, banks and corporates into funds, Emerging markets and SMEs.
We have prepared this document solely for informational purposes. You should not definitely rely upon it or use it to form the basis for any decision, contract, commitment or action whatsoever, with respect to any proposed transaction or otherwise. You and your directors, officers, employees, agents and affiliates must hold this document and any oral information provided in connection with this document in strict confidence and may not communicate, reproduce, distribute or disclose it to any other person, or refer to it publicly, in whole or in part at any time except with our prior consent. If you are not the recipient of this document, please delete and destroy all copies immediately.
Neither we nor our affiliates, or our or their respective officers, employees or agents, make any representation or warranty, express or implied, in relation to the accuracy or completeness of the information contained in this document or any oral information provided in connection herewith, or any data it generates and accept no responsibility, obligation or liability (whether direct or indirect, in contract, tort or otherwise) in relation to any of such information. We and our affiliates and our and their respective officers, employees and agents expressly disclaim any and all liability which may be based on this document and any errors therein or omissions therefrom. Neither we nor any of our affiliates, or our or their respective officers, employees or agents, make any representation or warranty, express or implied, that any transaction has been or may be effected on the terms or in the manner stated in this document, or as to the achievement or reasonableness of future projections, management targets, estimates, prospects or returns, if any. Any views or terms contained herein are preliminary only, and are based on financial, economic, market and other conditions prevailing as of the date of this document and are therefore subject to change. We undertake no obligation to update any of the information contained in this document.
Credit Benchmark does not solicit any action based upon this report, which is not to be construed as an invitation to buy or sell any security or financial instrument. This report is not intended to provide personal investment advice and it does not take into account the investment objectives, financial situation and the particular needs of a particular person who may read this report.
Notes:
Download the article “Oil and Gas Industry Trends” on PDF.
We aggregate the views of thousands of institutional credit analysts to create new, unique consensus data and analytics. Our clients use the unique entity- and aggregate-level data and analytics to understand and manage their risks effectively. The data helps clients focus their attention on where and when it matters most, whether in their risk management, investment process, or regulatory compliance. Learn more.
Barbora Makova
Jacob Hibbert
Aleem Ilyas
David Carruthers
1 See Appendix 2
2 Based on Probability of Default estimates from 3 or more contributing banks.
3 The ‘Wisdom of Crowds’ was initially observed by Francis Galton and is the basis for the value in crowdsourced datasets. It is the popular version of the Diversity Prediction Theorem which can be stated as: “The squared error of the collective prediction equals the average squared error minus the predictive diversity” – implying that if the diversity in a group is large, the error of the crowd is small.
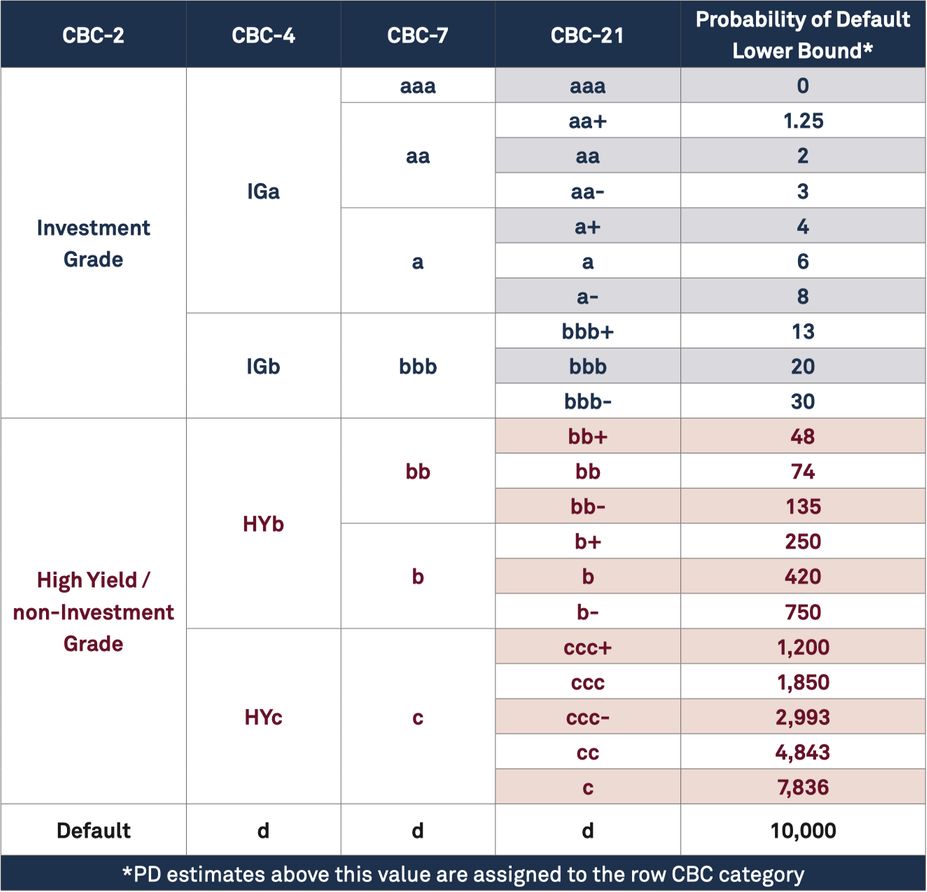
4 The Credit Benchmark Consensus (“CBC”) is a 21-category scale explicitly linked to probability of default estimates sourced from major banks. A CBC of bbb+ is broadly comparable with BBB+ from S&P and Fitch or Baa1 from Moody’s.
5 Along with Dubai/Oman, these provide the reference prices for the main traded futures contracts.
6 26 are fully quorate (3 or more banks contribute risk estimates) and 3 are semi-quorate (2 banks contribute risk estimates).
7 Divergent views between equity markets and bank credit views have recently appeared in several markets. See “Stockmarkets are confident, banks not so much”, The Economist, 10th February 2017 for an example using Credit Benchmark data.
8 Calculated from the Ex-Ante Probability of Default and Loss Given Default estimates published by Credit Benchmark.
9 Several outliers with % PD change larger than 500% are excluded.
10 S&P data for August is shown as a blank due to Selective Default status in that month.
11 The 144 entities included in this sample reflect a mixture of those that have been present for the full period and those that were added over the course of the year.
Disclaimer: Credit Benchmark does not solicit any action based upon this report, which is not to be construed as an invitation to buy or sell any security or financial instrument. This report is not intended to provide personal investment advice and it does not take into account the investment objectives, financial situation and the particular needs of a particular person who may read this report.

