US tech stock valuations: focus on default risks may drive industry shakeout
- US tech stock are increasingly concentrated and volatile, while default risks in the sector have increased, especially among high-yield firms.
- Over 80% of major listed tech firms are investment grade, contrasting sharply with the broader sector.
- External pressures and balance sheet disparities may see significant restructuring for tech industry.
The tech stock results rollercoaster continues, and tariffs are only one of many issues. The technology landscape changes daily with the latest AI developments, semiconductor supply concerns and cyberattacks; but some of the most reliable earnings streams are in mundane services like cloud computing and search engine advertising.
Tesla shares have doubled and halved in just a few months, NVIDIA shares are up 10x since late 2022 but have slipped more than 20% since January. Microsoft stock has outperformed both of these in the past month. Overall technology investment 3-year returns are healthy (around +15% pa) but the stellar returns are volatile and concentrated in a small number of stocks.
As the following chart shows, the Nasdaq 100 equity index doubled between September 2022 and February 2025; it is now 10% off its peak.
Over the same period, average sector default risk according to Credit Benchmark’s US Technology index has increased 14% from 68 to 78 Bps. High Yield US Tech firms are up 24% from 171 to 212 Bps.
Technology: Equity Index vs. Default Risk

How do default risk trends compare with these equity moves? The chart above shows that banks contributing risk views to Credit Benchmark have become increasingly cautious about lending to technology firms, although these a trends are in line with US Corporates overall.
Even the largest and highest profile technology companies show wide variation in debt-to-equity ratios – high-margin debt-fuelled growth can quickly repay heavy borrowings so balance sheet ratios are a rapidly moving target in this sector.
But if underlying tech growth stalls, and recent tech stock corrections are the start of a sustained trend, investors may put a higher value on balance sheet robustness.
The chart below shows the current credit profile of 20 major or critical listed technology firms with Credit Consensus Ratings from Credit Benchmark.
Credit Profile: 20 Major Tech7/AI Firms
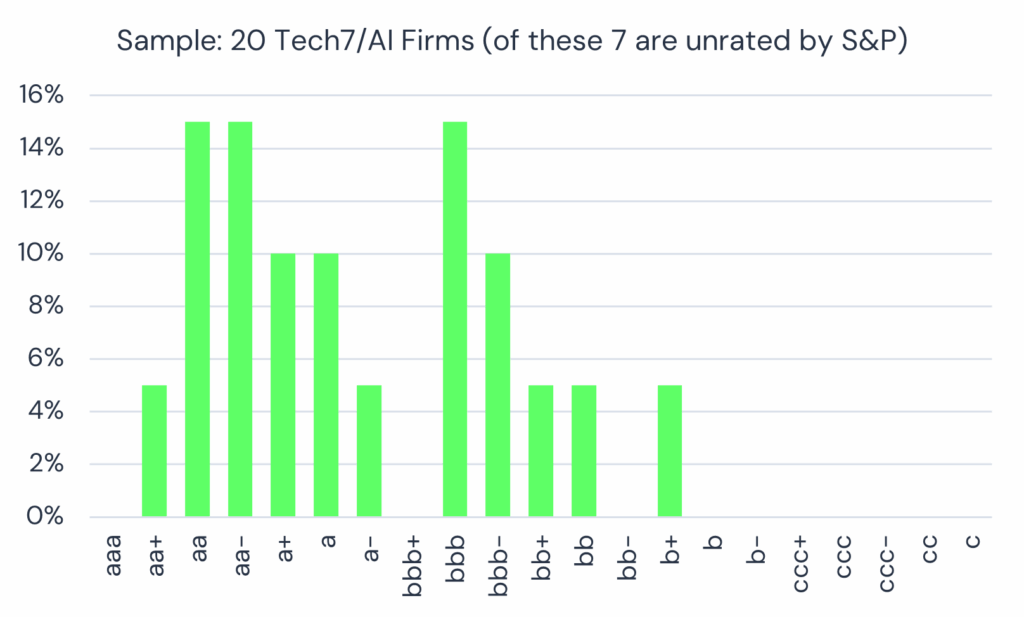
Most of these companies (>80%) are investment grade (vs 40% for the broader US Technology index).
A third (7 companies) are not rated by S&P at the issuer level.
This sample of publicly listed companies includes the “Magnificent 7”, various headline-grabbing semiconductor companies (mainly, but not exclusively US-based), plus a range of high profile AI-focused service providers. In the past 24 months, the credit profile and default risk for this group has been stable – against the modest deterioration in the broader US Technology industry plotted earlier. And as the following chart illustrates, the US Technology sector has a much higher % in the vulnerable c category – nearly double the US Corporate equivalent.
Credit Profile: US Corporates vs. US Technology

As tariffs change the landscape and the gap between winners and losers becomes more stark, there is scope for some major industry realignment. The divergence in balance sheet strength between the majors and the broader industry suggests scope for a shakeout.
Credit Benchmark data shows credit quality in US and UK Technology sectors is holding up better than Canada or Asia, but both the US and the UK have a higher proportion of firms in the c category:
Credit Trend & Credit Profile: UK vs. United States vs. Asia vs. Canada Technology


Globally, software is the most stable segment while semiconductor credit has been dramatically underperforming:

The Global Technology consensus index covers more than 1,300 companies, with a large coverage of unrated, high yield, and private firms.
Consensus ratings, updated weekly, show which companies may be vulnerable, with additional metrics like range and skew of bank estimates plus depth of lender groups. Get in touch to schedule a demo.
Credit Benchmark consensus credit data is updated weekly and delivered to our clients via our Web App, Excel add-in, flat-file download and third party channels including Bloomberg, Snowflake and AWS. Advanced analytics like those found within this report are now also available for free on the Credit Benchmark website via Credit Risk IQ. 10,000+ monthly geography-, industry- and sector-specific risk reports and transition matrices are available on Credit Risk IQ.