
A decade of Credit Benchmark data reveals major global credit shifts.
Over the past decade, Credit Benchmark’s consensus dataset, drawn from the credit risk views of leading global financial institutions, has provided a uniquely granular picture of default risk trends across borrower types and industries. This 10-year analysis highlights how structural shifts in global trade, monetary policy, and capital flows have reshaped credit quality. Because the dataset reflects real-world risk estimates from regulated lenders, it captures subtle but significant changes that are often missed in market-implied measures.
Global Borrower Types: Corporates Take the Strain, Hedge Fund Tail Risk Now Better Than Sovereigns
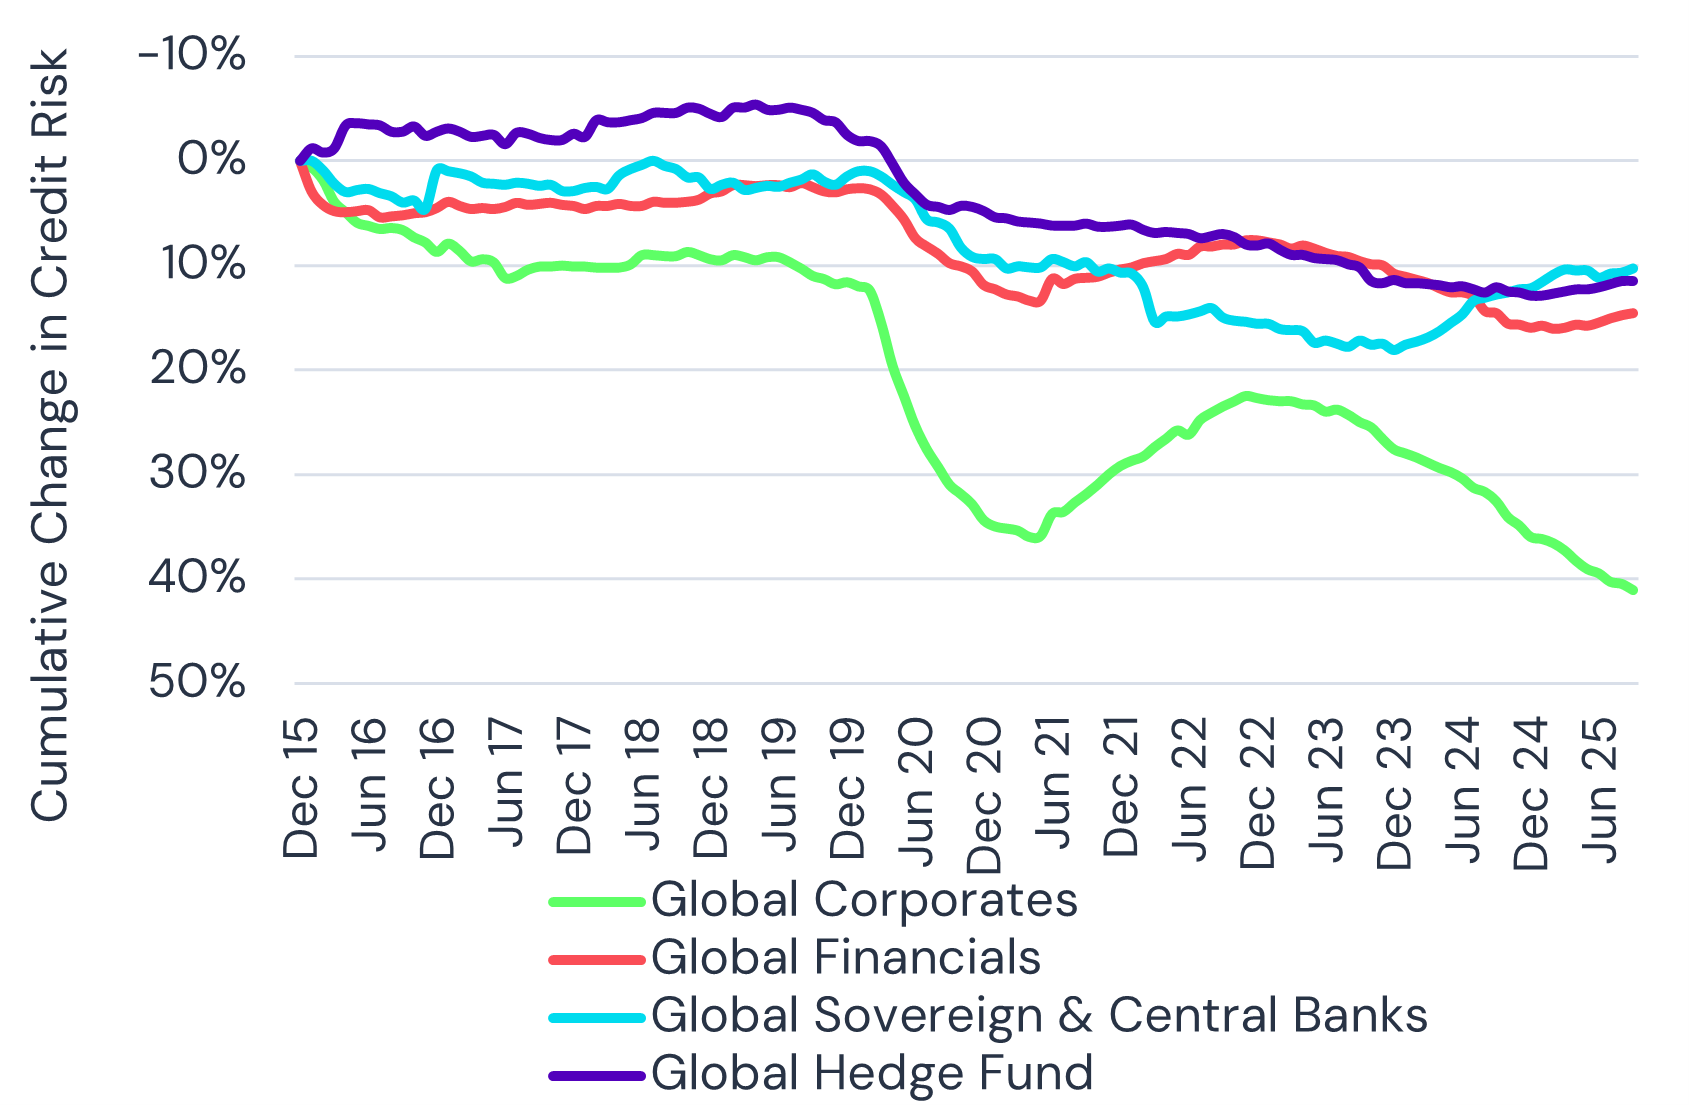
Global Corporate default risks have risen 40% in the past 10 years, according to Credit Benchmark consensus data. Global Financials have also deteriorated, but only by around 15%. This divergence reflects a decade in which globalisation and trade in physical goods have stalled, while services and cross-border financial flows have remained relatively strong.
In the decade of Covid and the Ukraine war, the 10% decline in Sovereign credit quality is modest. Various forms of monetary expansion — QE, collateralised lending, and the growth of Non-Bank Finance — may have absorbed some of the impact. Inflation has also played a part; US Consumer Prices have risen by a cumulative 40%, reducing the real value of debt.
A notable result in the Credit Benchmark dataset is the relative resilience of leveraged financial companies: the Global Hedge Fund index has performed in line with Sovereigns. Yet the proportion of ’c’ rated Sovereigns is now around 10%, while there are no hedge funds in that category.
Credit Trend - Global Corporates vs. Financials vs. Sovereigns & Central Banks vs. Hedge Funds
Credit Profile - Global Corporates vs. Financials vs. Sovereigns & Central Banks vs. Hedge Funds

Industry Rankings
Credit Benchmark’s global industry aggregates, based on consensus credit risk data, show clear cyclical patterns. Consumer Services appear to lead Consumer Goods, and there is a moderate correlation between Basic Materials and Oil & Gas. Industrials track overall Corporate trends, and in recent years Technology and Telecommunications have moved in similar directions.
Oil & Gas, Basic Materials, and Consumer Services remain especially volatile, while Financials, Technology, and Utilities tend to show more stable credit performance over time.
Global Sectors Ranked by PD Change Each Year

Global Industry Credit Risk Changes by Year
The Credit Benchmark dataset shows that default risk is net higher across all Global sectors over the past 10 years. Covid was the largest single shock, but 2016 — when globalisation momentum first slowed — also marked a difficult year. The Ukraine invasion then blunted the post-Covid recovery in 2022. The years 2024 and 2025 so far have offered little relief.
Credit Benchmark consensus data shows Global Corporate default risk up 39%, while Financials are only up 15%. Telecommunications, Consumer Services, Health Care, and Oil & Gas have all risen by more than 50%. Technology, Basic Materials, and Utilities show milder, but still material, increases of 25%+.

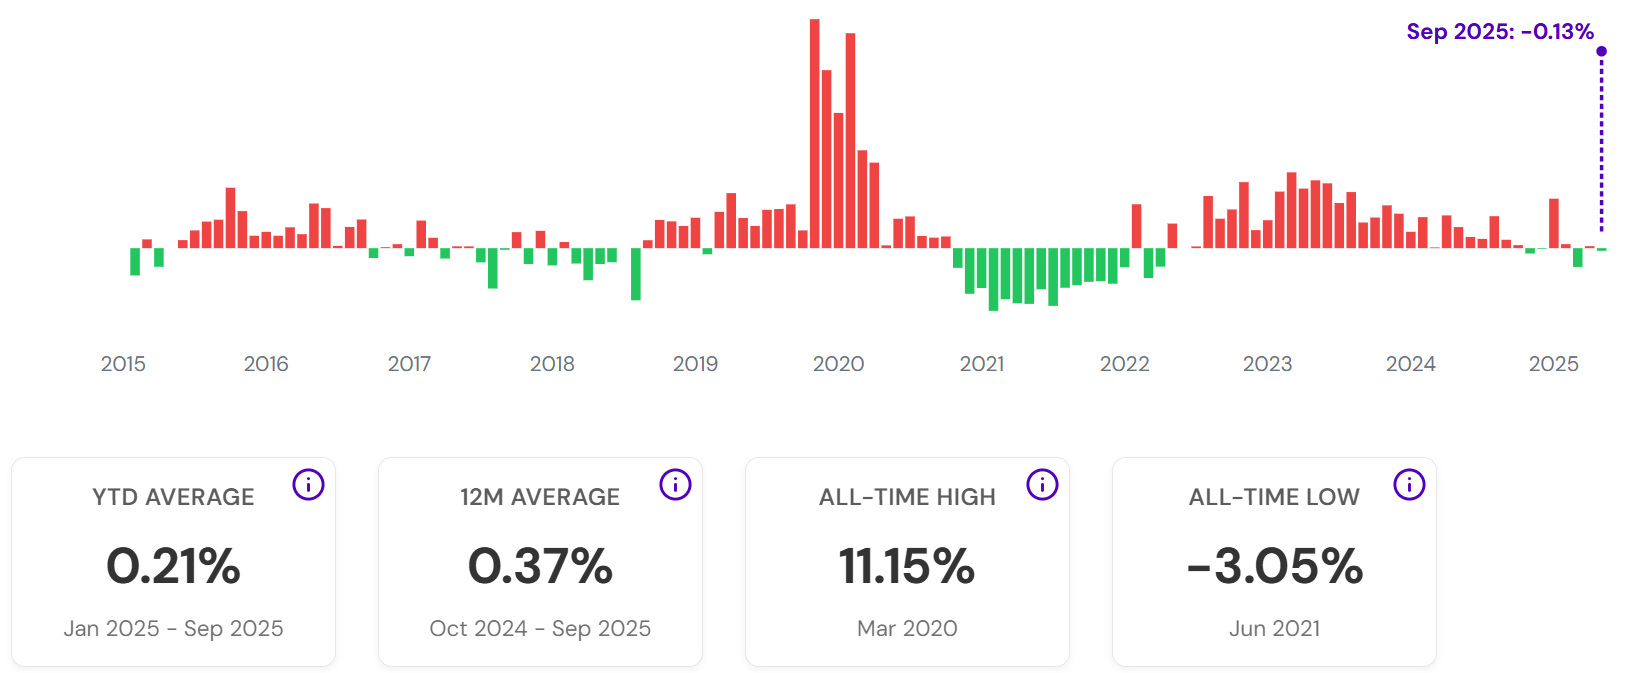
US Private Assets: Credit Risk Index (“Net Downgrades”)
The Credit Benchmark Credit Risk Index (CRI) tracks net rating changes (downgrades minus upgrades) for US private corporates and financials. A positive CRI signals rising risk; a negative CRI indicates improving credit quality. With consensus ratings available at up to 100 categories, the CRI is uniquely sensitive to even small changes in bank credit estimates.
The largest monthly net downgrade occurred at the start of the pandemic in March 2020; the largest net upgrade came in June 2021. There is a strong (>0.9) correlation between the annual average CRI and observed S&P default rates.
Global Credit Migration Patterns 2018 to 2025 YTD
Credit Benchmark’s migration history for Global Corporates and Financials (using the broadest possible coverage for representativeness) highlights clear structural changes:
- Investment Grade categories show a bias toward downgrades.
- High Yield categories show a bias toward upgrades, potentially reflecting the expansion of Non-Bank Finance and increased credit supply to higher-risk firms.
- Corporates show a heavier downgrade bias than Financials, which exhibit a similar but less severe pattern.
Global Credit Migration - All

Global Credit Migration - Corporates

Global Credit Migration - Financials

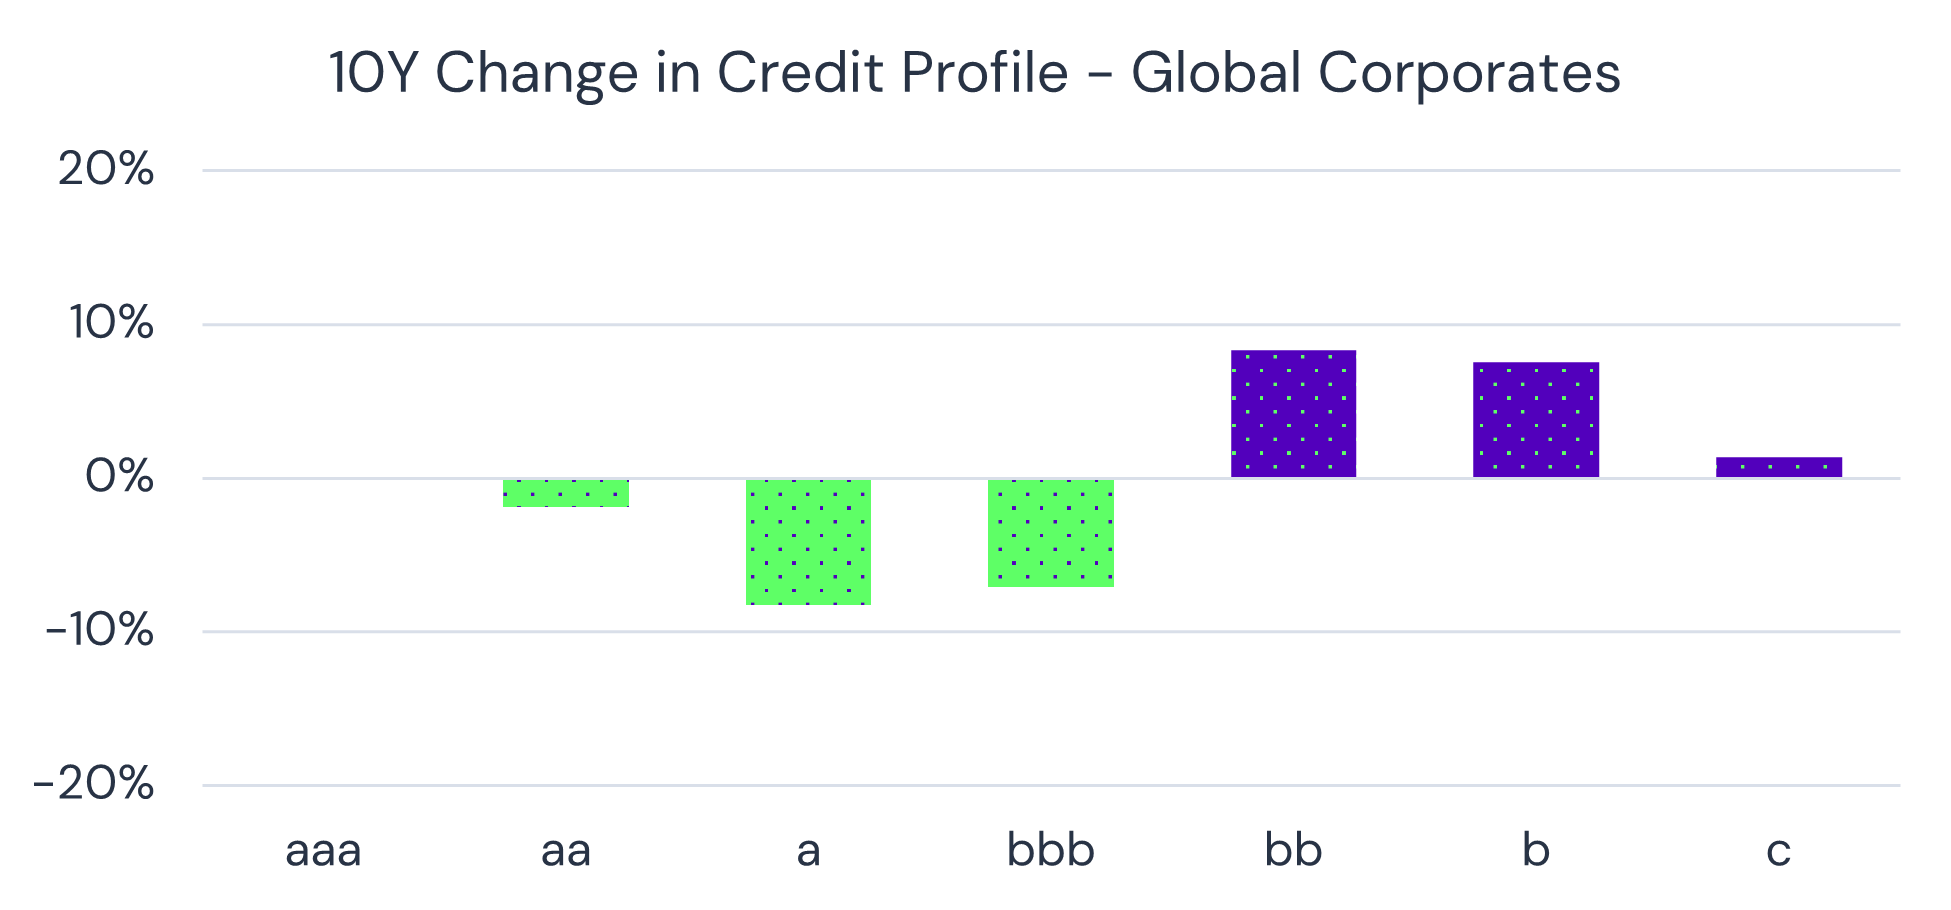
Long-Term Shifts in Corporate and Financial Credit Profile
For Corporates, the consensus dataset shows a significant 10-year shift from Investment Grade to High Yield, especially a decline in ‘a’ rated firms and a spike in ‘b’ rated firms.
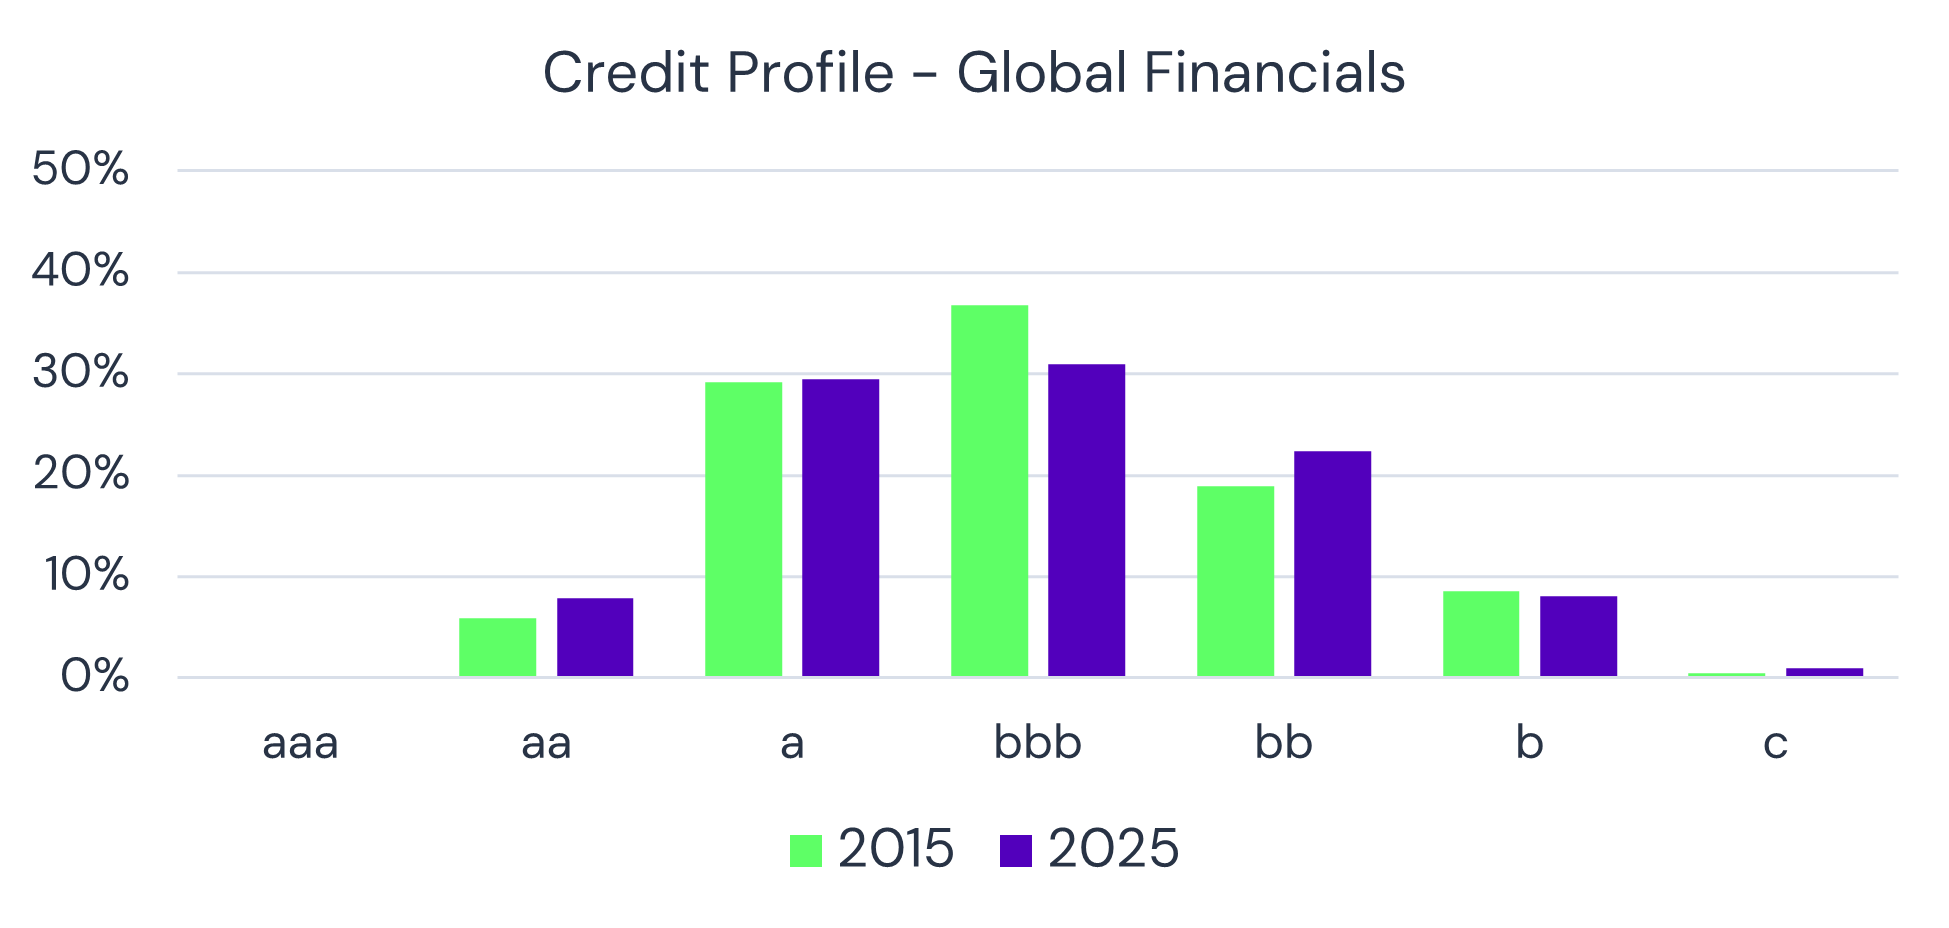
Financials show a similar pattern but concentrated between ‘bbb’ and ‘bb’.
“bb may be the new IG boundary” is an emerging theme.


Market and Real World Credit Risk Measures Diverge
According to Credit Benchmark’s 10-year consensus data, the migration toward High Yield has contributed to a 40% increase in Global Corporate default risk.
Even US Technology — one of the more resilient sectors — has seen risk rise around 30%, while overall US Corporates have posted a 55% increase.
In contrast, the US Corporate Bond Spread currently sits near a 10-year low, showing a disconnect between bank-estimated real-world credit risk and market-implied risk.
Part of the spread compression may be explained by weight of money – the gold price shows the likely effect of monetary expansion on inflation expectations.

Inflation, Gold, Mining & Corporates
Out of more than 1,200 consensus default risk aggregates published by Credit Benchmark, Global Gold Mining is one of the very few sectors to show net credit improvement since 2015.
Over the same decade:
- US CPI rose 40% — mirroring the rise in Global Corporate default risk.
- Gold prices, however, outpaced inflation by ~2.5x.
- When gold prices surpassed the typical extraction cost of $1,400/oz in mid-2019, global gold miners moved sharply into profitability.
Since then, consensus default risk for Global Gold Mining companies has improved from ~75 bps (High Yield) to ~45 bps (Investment Grade).

Global Sector 10Y % Change in Default Risk
Credit Benchmark’s global sector aggregates demonstrate the broad effects of Covid, Ukraine, and trade-related tensions:
- Demand-shock sectors show the worst deterioration: Drug and Apparel Retailers, Hotels, Fixed-Line Telecoms.
- Specialized Lending shows a significant risk increase, possibly signalling stresses in Private Credit or Non-Bank Finance.
- Rising costs weigh on Hardware, Telecom Equipment, Oil Equipment, Food, and Pharma-related subsectors.
- Cyclical swings and tariffs drive changes in Construction, Oil & Gas, Autos, and Chemicals.
- Among services, Travel & Leisure, Media, and Real Estate Services are especially hard-hit.
- Aerospace benefits from defence spending; Airlines have rebounded from Covid.
- General Industrials — a proxy for global Corporates — encapsulate the decade’s challenges.
- Technology, while affected, has fared better than most major sectors.

Conclusion
Across all borrower types and sectors, Credit Benchmark’s ten-year history of consensus data underscores a clear shift toward higher real-world credit risk. As global markets continue to evolve, these bank-sourced measures provide an essential, independent benchmark for understanding true creditworthiness beyond market signals.
To explore these trends in more detail — or to access Credit Benchmark’s full set of consensus credit risk analytics — get in touch with our team or visit our Insights hub for the latest data and research.
Download
Please complete your details to download the PDF of this report: