
Another northern hemisphere summer, another wildfire record. California is facing the single largest fire that the state has ever seen, and this year many of the western states of Canada and the US have seen multiple outbreaks. US wildfires are sometimes attributed to outdated electricity infrastructure; companies in the sector also face a legal hurdle that can hold them responsible even if their infrastructure is not at fault.
Wildfire risk is not just in North America: parts of Italy have declared a state of emergency and the annual fires in Siberia are particularly extensive this year. Turkey and Greece have had to appeal for international help as they evacuate some of their holiday resorts; and even the Greek capital is at risk. At least one power station in Turkey has been destroyed, and unburied power cables which often stretch across wilderness areas are acutely vulnerable.
Wildfires also intensify the political and media focus on global warming, with renewed debates about energy source sustainability and optimal technology in electricity generation and transmission.
So electricity companies face a triple challenge: (1) are generation inefficiencies contributing to carbon emissions which make wildfires more likely? (2) is underinvestment in infrastructure one of the causes of wildfires? (3) how vulnerable is their infrastructure as wildfires inexorably increase in size each year?
Addressing these issues requires investment, and companies with stronger credit ratings are better placed to fund the necessary capital spending. This note looks at the credit profile and recent trends for US companies in the electricity sector.
The US Electricity sector consists of more than 500 companies, of which 371 are covered by Consensus Credit Ratings (CCRs). Of these, more than 180 are not covered by the main credit rating agencies at the issuer level.
Figure 1 compares consensus and average agency credit ratings on the 21-category scale. The bubble size shows the numbers of legal entities.
Figure 1: Consensus vs. Agency ratings, US Electricity companies
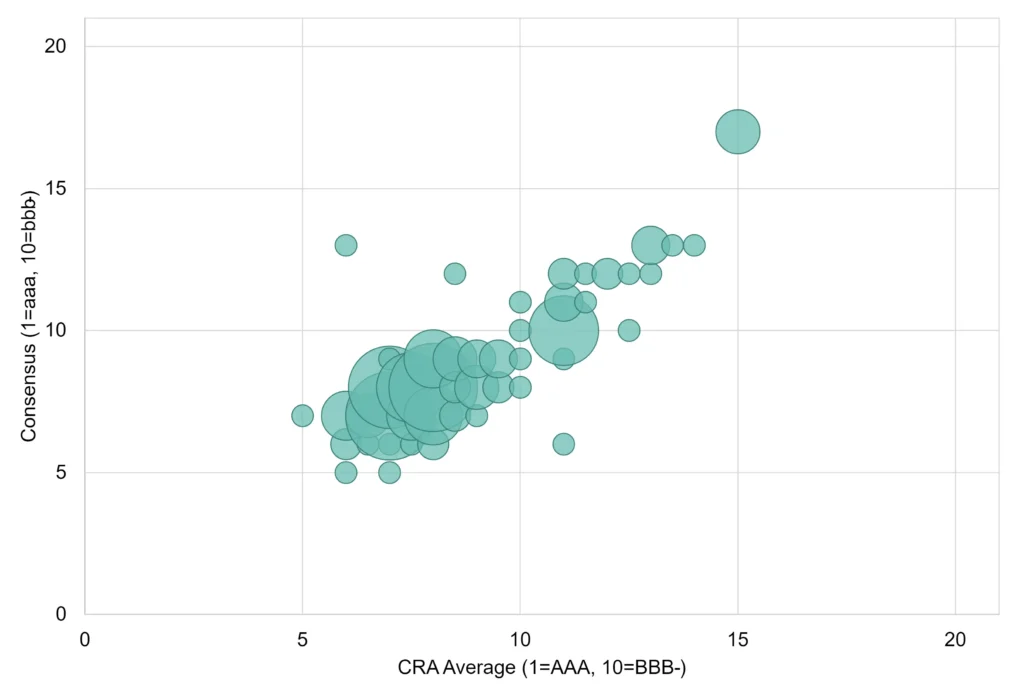
For most (116 out of 156) of the legal entities in this sample, the consensus and agency ratings are the same or at most one notch different. For more than half of these (70 out of 116) the agency average is more conservative than the consensus. This suggests that the consensus is a reliable guide for entities where no agency rating exists, although there is a modest bias to conservativism in the agency ratings.
Figure 2 shows the average consensus rating for legal entities with and without an agency rating, across the full consensus sample of 371.
Figure 2: Average consensus rating, CRA-rated vs. non CRA-rated
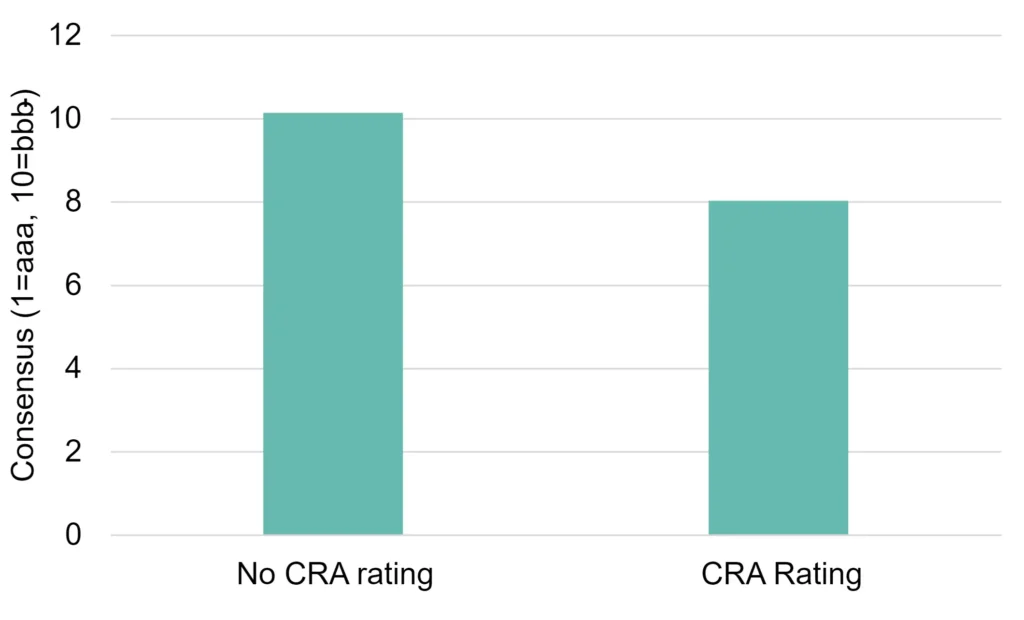
Legal entities with a CRA rating are typically 2 notches better than those without. The average notch for the unrated entities is still above the investment grade threshold, suggesting that a number of the unrated entities could qualify for an investment grade agency rating if they requested one.
Figure 3 shows the credit distribution for the sample of 371 legal entities.
Figure 3: Credit distribution for US Electricity legal entities
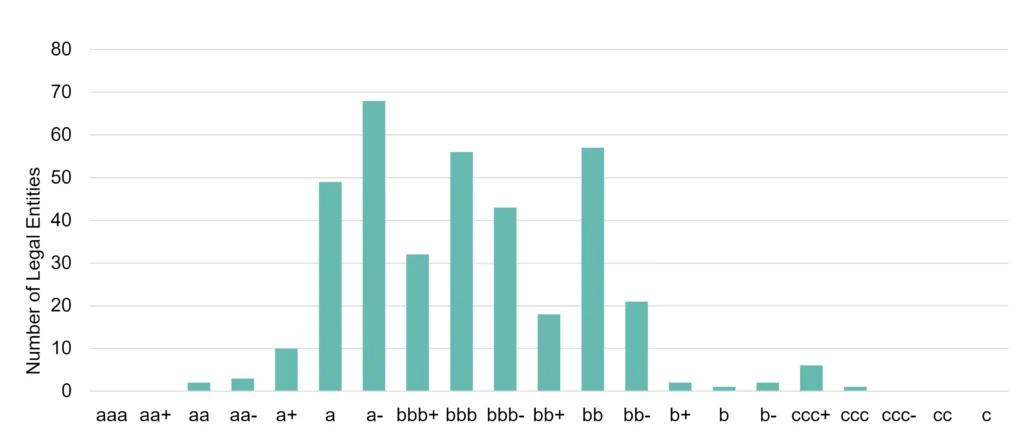
The largest single category is a-; overall, 71% are investment grade, and just 3% are in the b or c categories. For US Corporates, the equivalent proportions are 44% and 18% respectively.
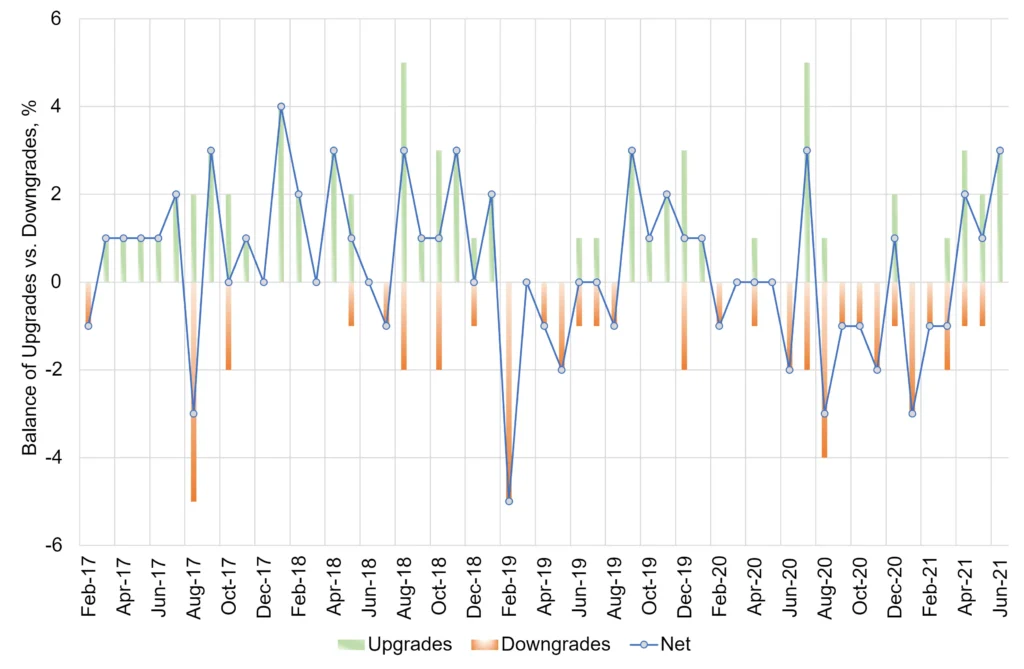
Figure 4 shows trends in upgrades vs downgrades over the past few years.
Figure 4: Upgrades vs. Downgrades, US Electricity companies, 2017-2021
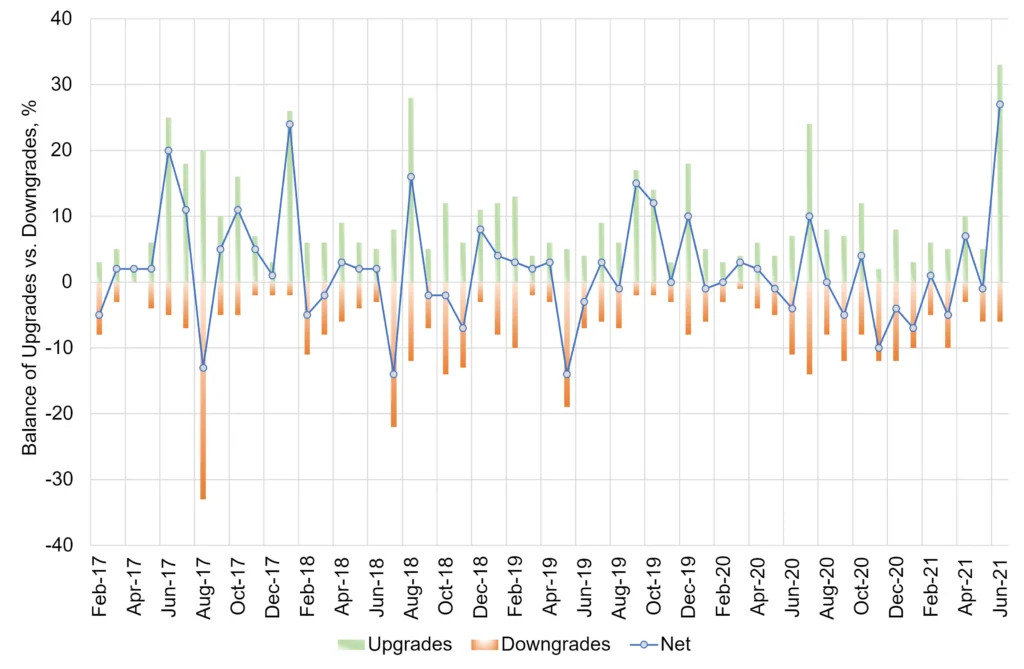
There have been a number of outlier months where upgrades or downgrades dominate. The three major spikes in downgrades have been in summer; of the five major spikes in upgrades, four have been in summer. Over the past year, the sector has followed a volatile but clear uptrend, with June 2021 recording one of the largest positive net balances in the 2017-2021 period.
The volatility of US Electricity balance between upgrades and downgrades is 26% larger compared to US Corporates overall (measured by standard deviation).
Figure 5 shows the same metric for the Western Electricity Co-ordinating Council (WECC) area (US companies only)
The WECC (US) area companies also show a volatile balance between upgrades ad downgrades, but there are two clear uptrend periods: Feb-19 to Sept-19, and Aug-20 to Jun-21. Again, the major spikes – upgrades or downgrades – are mainly (4 out of 5) in summer.
Conclusion
- US electricity companies are generally strong credits. Addressing climate change requires investment, and most of these firms are relatively well placed for that.
- Of the many US Electricity firms that do not have a CRA rating, some may be surprised to learn that the global bank consensus views them as investment grade.
- Electricity company credit estimates (upgrades vs. downgrades) are more volatile than US Corporates overall with a possible seasonal pattern to that volatility; but there has been a reasonably consistent bias towards upgrades in recent years.
- The pattern of upgrades and downgrades shows some variation by NERC area.