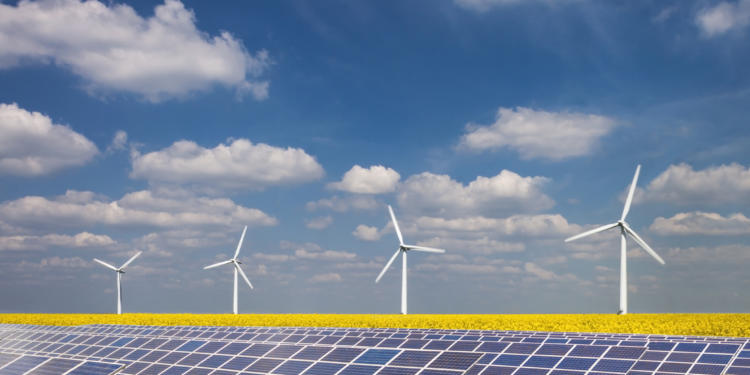
The Ukraine war has realigned economic priorities: countries are scrambling to secure stable food and energy supplies. The EC aims to replace 100 bn m3 of Russian gas this year by tapping alternative supply sources (such as LNG from the US) and boosting capacity in renewables. Non-renewable production is being ramped up everywhere to plug the immediate gaps, but the energy shock is a huge boost for renewables, including wind and solar power. Figures 1 and 2 show the impact of efficiency measures and the relative efficiency of various energy sources.
Figure 1: Changing Habits vs Changing Technology
Figure 2: Energy Efficiency
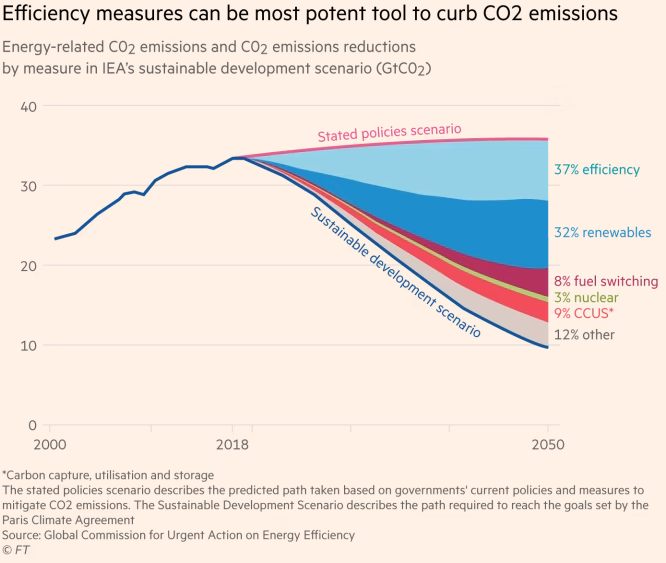
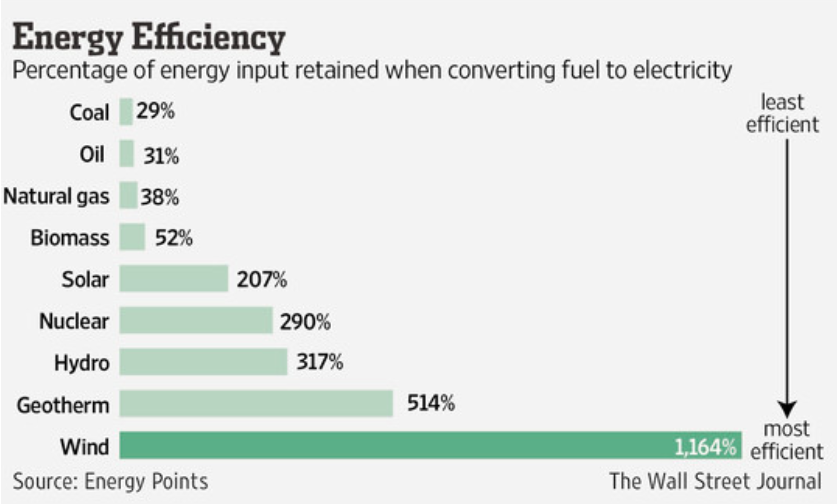
One of the most effective ways of curbing CO2 emissions is greater efficiency in energy usage from any source – by insulating homes, turning down heating, and using less hot water.
Non-renewables are also highly efficient; but some of the greenest technologies are also paradoxically dependent on the increasingly volatile climate. Until large scale energy storage becomes cost-effective, diversity in technologies is critical to ensure stable supplies from renewable sources.
Consensus credit ratings cover 41 wind companies and 51 solar companies. Figure 3 shows the Investment Grade (IG) High Yield (HY) balance for each.
Figure 3: Mar-22 IG/HY balance; Wind and Solar

Over 80% of the companies in the wind power consensus aggregate have an investment grade rating.
More than half of companies in the solar power consensus aggregate are investment grade.
The proportion of investment grade companies in the Conventional Electricity sector in various geographies is typically in the range of 60% to 70%.
For traditional Oil & Gas companies, the investment grade proportion is 47%.
Figure 4 shows credit trends for these wind and solar companies.
Figure 4: Credit Trends; Wind and Solar

At the beginning of the COVID crisis, average solar company credit risk increased 26%. Credit quality modestly improved from early 2021 but this has faded in recent months.
The pandemic had less impact on wind company credit risk, deteriorating from Mar-20 to Nov-21. Recent months show signs of stabilisation and possible improvement.
The Ukraine war is changing the credit landscape – any shift towards green energy is likely to be reflected in major credit improvements in these aggregates.
Figures 5.1 and 5.2 shows Credit Consensus Ratings and country of risk for some of the companies included in these aggregates.
Figure 5.1 Solar Companies
Figure 5.2 Wind Companies


Companies on this list have limited or no rating agency coverage, so the Credit Consensus Rating shown here may be the most robust (or only) estimate of credit available.

