
The Covid-19 crisis crept up on equity markets, with progressively larger drops in share prices in each month of the first quarter of 2020.
Equity markets usually focus on sales and earnings, not credit risk: when a company becomes a “cash cow” with no avenues for new business investments, it is typically seen as ex-growth and ripe for takeover. High ratings are for high growth firms, frequently making liberal use of leverage.
The virus crisis is unique. During the financial crisis of 2008-09, a credit crunch threatened a banking system failure and dented consumer demand for a few quarters. Covid-19 has hit the corporate sector much harder, with a rapid and widespread collapse in revenues. Government and bank lifelines have favoured essential firms, or those with strong balance sheets and sustainable business models in the post-virus economy.
The chart shows the relationship between equity market movements and credit risk for 771 US Corporates over a 17 month period.
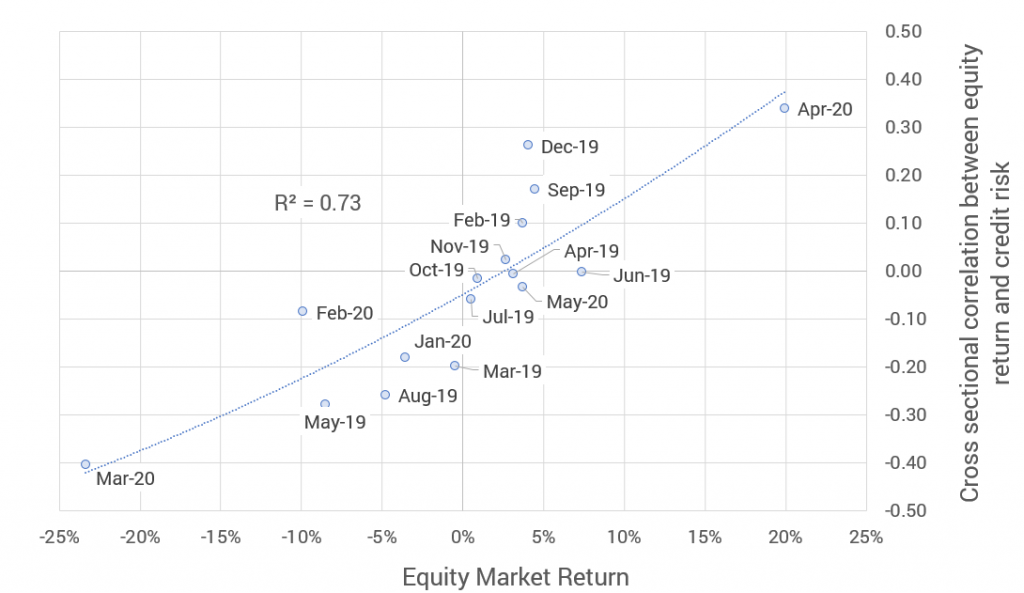
From an overall equity market perspective, the first three months on 2020 all appear in the lower left quadrant – negative index returns, and a negative correlation between individual equity performance and credit risk.
For example, across 771 US Corporates, the correlation between credit risk and share price performance in March 2020 is -0.4, with an index return of about -23%. This means that listed companies with high credit risk were much more likely to underperform the market – a classic flight to quality, where “quality” is defined by creditworthiness. By contrast, in December 2019 the correlation was +0.26, with a mildly positive market return of +4%.
Other months fit this overall pattern; there are no months in the upper left quadrant (positive credit risk / share price return correlation and a falling index) and those in the lower right quadrant are very close to the axes.
The fit is 73%; this drops to 52% if the March 2020 data is excluded, but is still significant. This was also a period of extraordinary weakness in oil stocks, but excluding them does not change the fit significantly.
The conclusion is that rising markets do not just ignore credit risk, they almost embrace it; but when markets turn down – especially in the current environment – they will pivot towards companies with the highest credit quality.
When risk is “on” one week and “off” the next, credit risk data shows which stocks are likely to win or lose in each phase.

