Download full May End-of-Month Credit Updateinfographic below.
Credit Benchmark has released the latest end-of-month consensus credit data (from April 2020), based on the final and complete set of contributed credit risk estimates from 40+ global financial institutions. This final update takes into account the credit movements of ~26,000 separate legal entities.
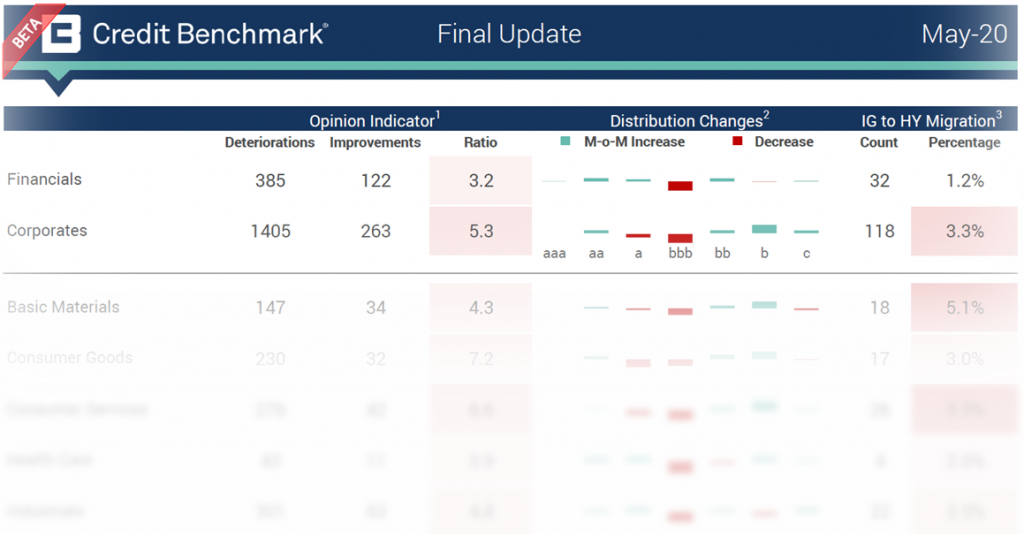
In the update, you will find:
Opinion Indicator: Assesses the month over month observation-level net downgrades or upgrades.
Ratio: Ratio of Deteriorations and Improvements calculated as Deteriorations / Improvements
Distribution Changes: The increase or decrease in the percentage of entities in the given rating category
IG to HY Migration: The absolute and relative movement from investment-grade to high-yield
The bias towards deterioration flagged by the opinion indicator ratio is roughly unchanged in both Corporates (5.3:1) and Financials (3.2:1)
The opinion indicator marks the most impacted industries:
There is an 19.3:1 deteriorating/improving ratio for Oil & Gas entities (down from 31.6:1 in the flash update). This is the largest ratio difference of the industries but also the biggest ratio drop compared to the mid-month flash update.
There is a 7.2:1 deteriorating/improving ratio for Consumer Goods (up from 6.1:1).
There is a 6.6:1 deteriorating/improving ratio for Consumer Services (down from 6.9:1).
Telecommunications again shows the only positive ratio in favour of improvements, at 0.7:1 deteriorating/improving (down from 0.8:1 mid-month).
The percentage of Investment Grade (IG) entities migrating to High-Yield (HY) increased for most of the industry cuts excepting Healthcare, Technology and Telecommunications which remained the same since mid-month.
Consumer Services again showed the strongest tendency to transition to HY with 5.5% of IG entities migrating (up from 4.9%).
Travel & Leisure is still the most impacted sector with 14.9% of IG entities being downgraded to HY (unchanged from mid-month).
Canadian Oil & Gas showed 43 downgrades and no upgrades, and 6.1% of IG entities in this group migrated to HY.
The biggest jump in IG to HY transitions from the mid-month update was in Canadian Corporates which doubled from 2.2% to 4.4%.
Credit Benchmark will continue to provide regular reports on these migration rates. If you have any questions about the contents of this update, please get in touch.
For full details, please download the May end-of-month credit updateinfographic here:
We use cookies to ensure that we give you the best experience on our website. If you continue to use this site we will assume that you are happy with it.Ok