
From Blind Spots to Strategic Insights: Mastering Private Credit Risks
Higher default rates in private credit have highlighted the need for enhanced investor scrutiny. With the Corporate segment of the market nearing $2 trillion and set to double, risk leaders face a pressing challenge: private credit remains opaque, making default risk assessment difficult without better data.
Credit Benchmark tackles this by aggregating anonymized, bank-sourced consensus ratings, providing unique, forward-looking insight into private credit risk. This data bridges crucial gaps, offering clarity and control where it’s most needed.
Key Benefits:
- Unique Transparency: Proprietary consensus data reveals hidden risks beyond traditional ratings.
- Actionable Insights: Supports regulatory needs and capital efficiency for CROs and investors.
- Accurate Risk Pricing: Improves spread accuracy, avoiding mispricing.
- Enhanced Forecasting: Powers proactive portfolio modeling and risk management.
Overview
Private Credit provides companies with debt financing options via private credit funds. But banks remain integral to private credit primarily for supporting liquidity and at times, providing some leverage to the funds. Additionally, banks are playing roles in originating Private Credit financings, the providers of debt are market participants such as insurance companies and pension funds that are well placed to hold them to maturity.
In this paper, we review holdings information for 13 private credit funds and use the Credit Benchmark consensus default risk database to assign risk ratings to those holdings. This gives a credit profile for each fund and a subset of these are plotted in a wider risk-return framework.
Executive Summary
- Out of 2,476 loans across 13 Private Credit funds, 1,241 are loans to unique companies and 1,187 (96%) of these have at least one default risk estimate in Credit Benchmark’s consensus database.
- The majority of these loans are from issuers rated in the ‘b+’ or ‘b’ categories, implying 1-year default risk in the range of 255 Bps to 650 Bps.
- The median loan spread over risk free is 525 Bps, with more than a third of the spreads in the 500-600 Bps range.
- Average spreads by fund range from 400 Bps to more than 600 Bps.
- While Private Credit fund holdings have high default risks, actual average fund spreads offered to investors are slightly higher than the equivalent expected OAS spreads for that risk level[1].
The market in Corporate private credit is worth close to $2trn; current trends point to that doubling in 5 years. The chart below shows the range and scale of other private credit types.

Private credit represents less than 10% of the $25trn current total, but is growing rapidly. Private Credit funds can point to a long track record of stable returns which is often attributed to high post-default recovery rates and low loan-to-value ratios.
How does private credit score on key risk dimensions?
- Credit Risk – ratings may not exist, be private or be unavailable
- Market Risk – higher interest rates pressure debt service burdens, tending to make default risk higher; economic downturns may have a more marked effects on heavily indebted borrowers.
- Liquidity Risk – investments may have time horizons of 3 to 5 years or longer; the longer investment horizon of insurance companies and pension funds mean private credit funds, but it can also leave the underlying lenders with no choice but to hold to maturity even if their investment stance changes.
- Information Risk – the market has less transparency than listed equities or bonds. If problems do develop, it may take time for these to become fully apparent, raising systemic risk issues. Diversification may be difficult to achieve if the entire asset class falls out of favour, but concentration risks may not be obvious during normal economic conditions.
In addition to the lower visibility on private credit risk ratings, creditor behavior toward troubled borrowers has undergone changes. At a recent NYU Stern lecture, Professor Edward Altman[2] warned that record private credit issuance, tight spreads and easy liquidity may be masking default pressure, thanks to a growing prevalence of PIK structures and the willingness of creditors to arrange loan modifications and/or exercise loan take-outs that result in bringing in new investors, while leaving original investors with haircuts. While high-yield bond defaults remain near record lows, 2024 has seen one of the highest bankruptcy counts in decades.
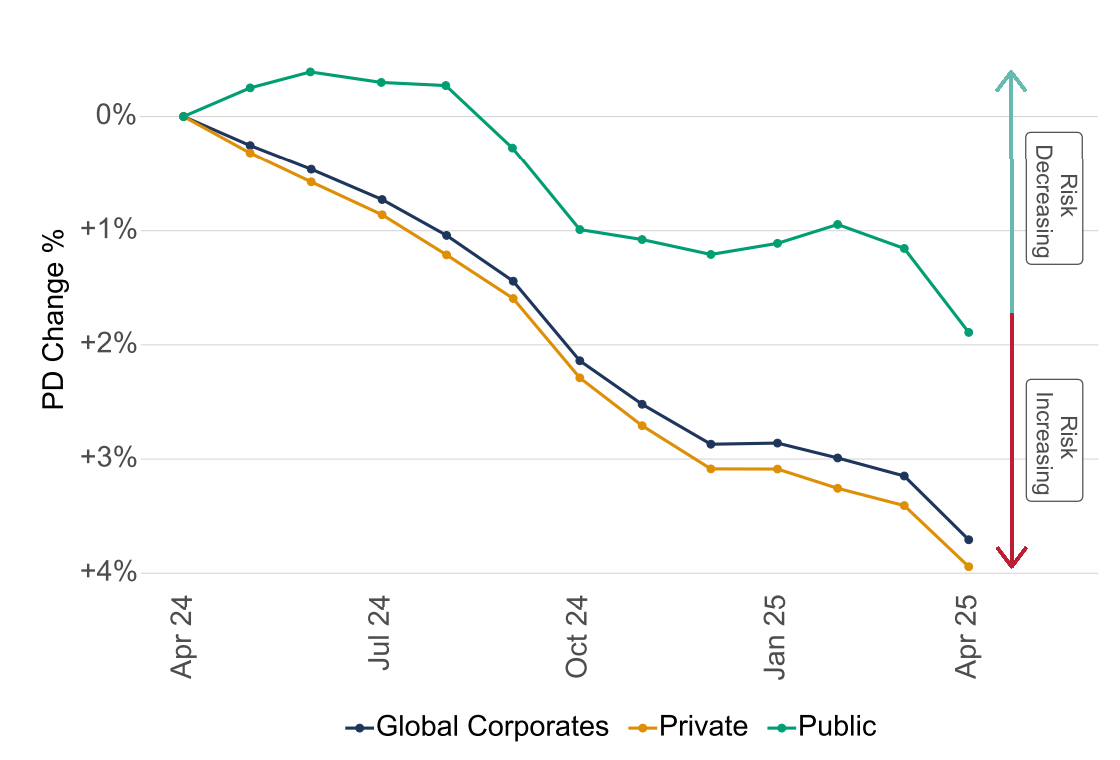
The consensus default risk charts below show all private (not just private credit) borrowers in the Global Corporate universe are typically higher risk than their public counterparts. In the past 12 months, private borrowers in this universe have seen credit risk deteriorate faster than public borrowers.
Credit Trend: Global Corporates - Private vs. Public
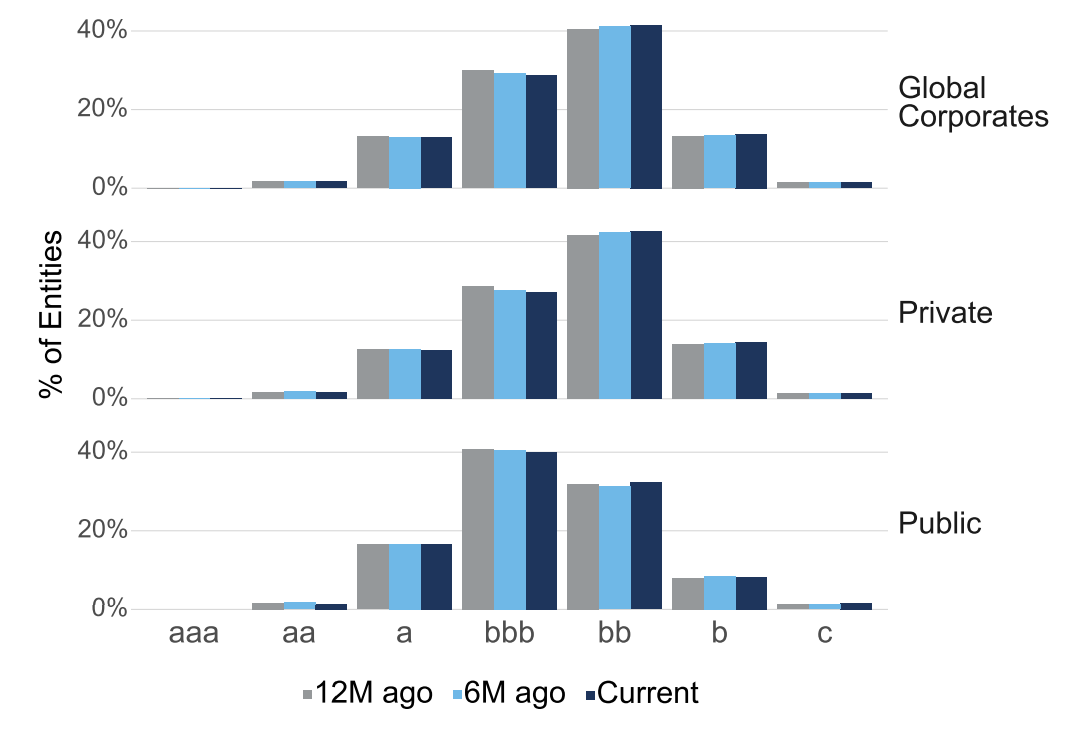
Credit Profile: Global Corporates - Private vs. Public
Publicly Available Private Credit Fund Holdings Data
To focus on credit risk in the private credit segment[3], the consensus dataset is now being cross-referenced with EDGAR / SEC filings for private credit funds.
This growing dataset currently covers 13 funds and 2,476 loans filed over the past 18 months. Of these, 2,029 are recognised (mapped) in the Credit Benchmark database, but only 1,241 of these are unique due to multiple loans to the same borrower (with possibly different inception dates and maturities) or multiple funds holding the same loan. 1,187 have at least one current bank estimate of default risk.
These charts show the geographic and industry mix:
Private Credit Consensus Dataset: Industry Split

Private Credit Consensus Dataset: Geography Split

These funds are concentrated in Industrial, Financial, Health, Consumer, and Technology –sectors that S&P report have tended to have higher recent default rates.
The next chart shows the credit profile for 1,187 borrowers with at least one default risk estimate[4].
Credit Profile: Private Credit Issuers with ≥ 1 Default Risk Estimate

The majority are ‘b+’ or ‘b’ but a significant number are in the ‘bb’ category. The ‘c’ rating categories are about two-thirds of the ‘bb-’ total. A small number are in the investment grade category (including a very small % in the ‘a’ categories.)
This chart shows the range of spreads over benchmark (risk free) indices for 2,821 (for which spreads are available, but credit ratings are not available) loans across 13 private credit funds for a range of SEC filing dates in the past 18 months.
Spread of Loans by % Points Above Index
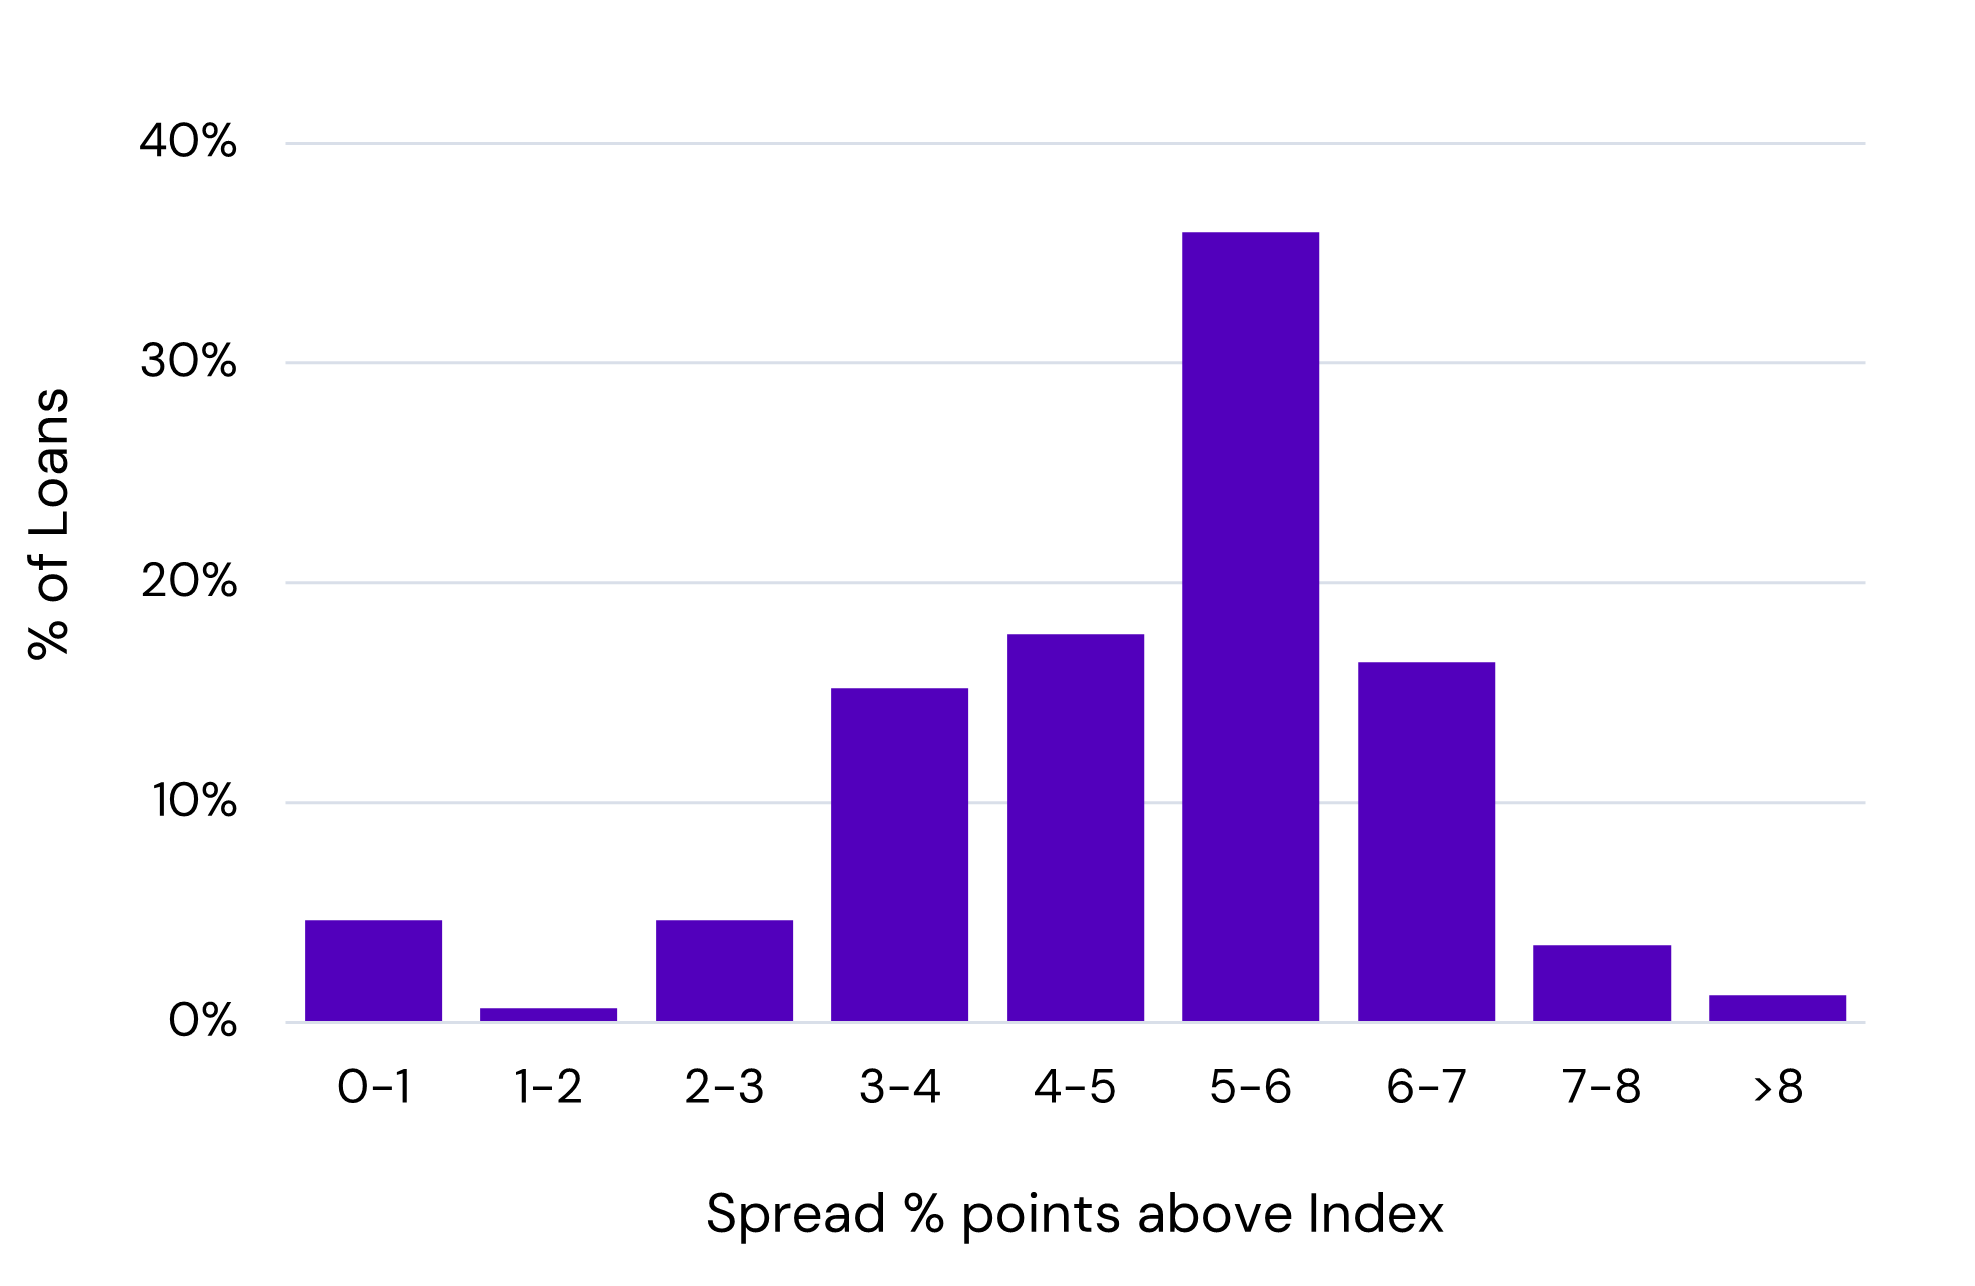
The sample median spread is 5.25%; while the majority of spreads range from 4% to 7%. The single largest category (more than a third of the sample) is the 5% – 6% range.
The next chart shows the average spread over benchmark for 13 funds. Average fund spreads vary from around 4% to just over 6%.
Private Credit Spread: Average by Fund

The following chart shows credit profiles for 7 of the largest (i.e. large samples of holdings) private credit funds.
Credit Profile: 7 Largest Private Credit Funds

The ‘b’ category dominates and only Fund A has more than 10% in the ‘c’ category.
The next chart plots real world default risks against the wider Credit Benchmark universe for a large number of sectors, and compares them with approximate OAS spreads for 3 historic dates based on the credit profile. The subset of private credit funds from the previous chart are plotted below as blue triangles. Green triangles are the actual spreads over risk free for the same funds.
Market Price of Risk (Spreads) vs. Real World Default Risk
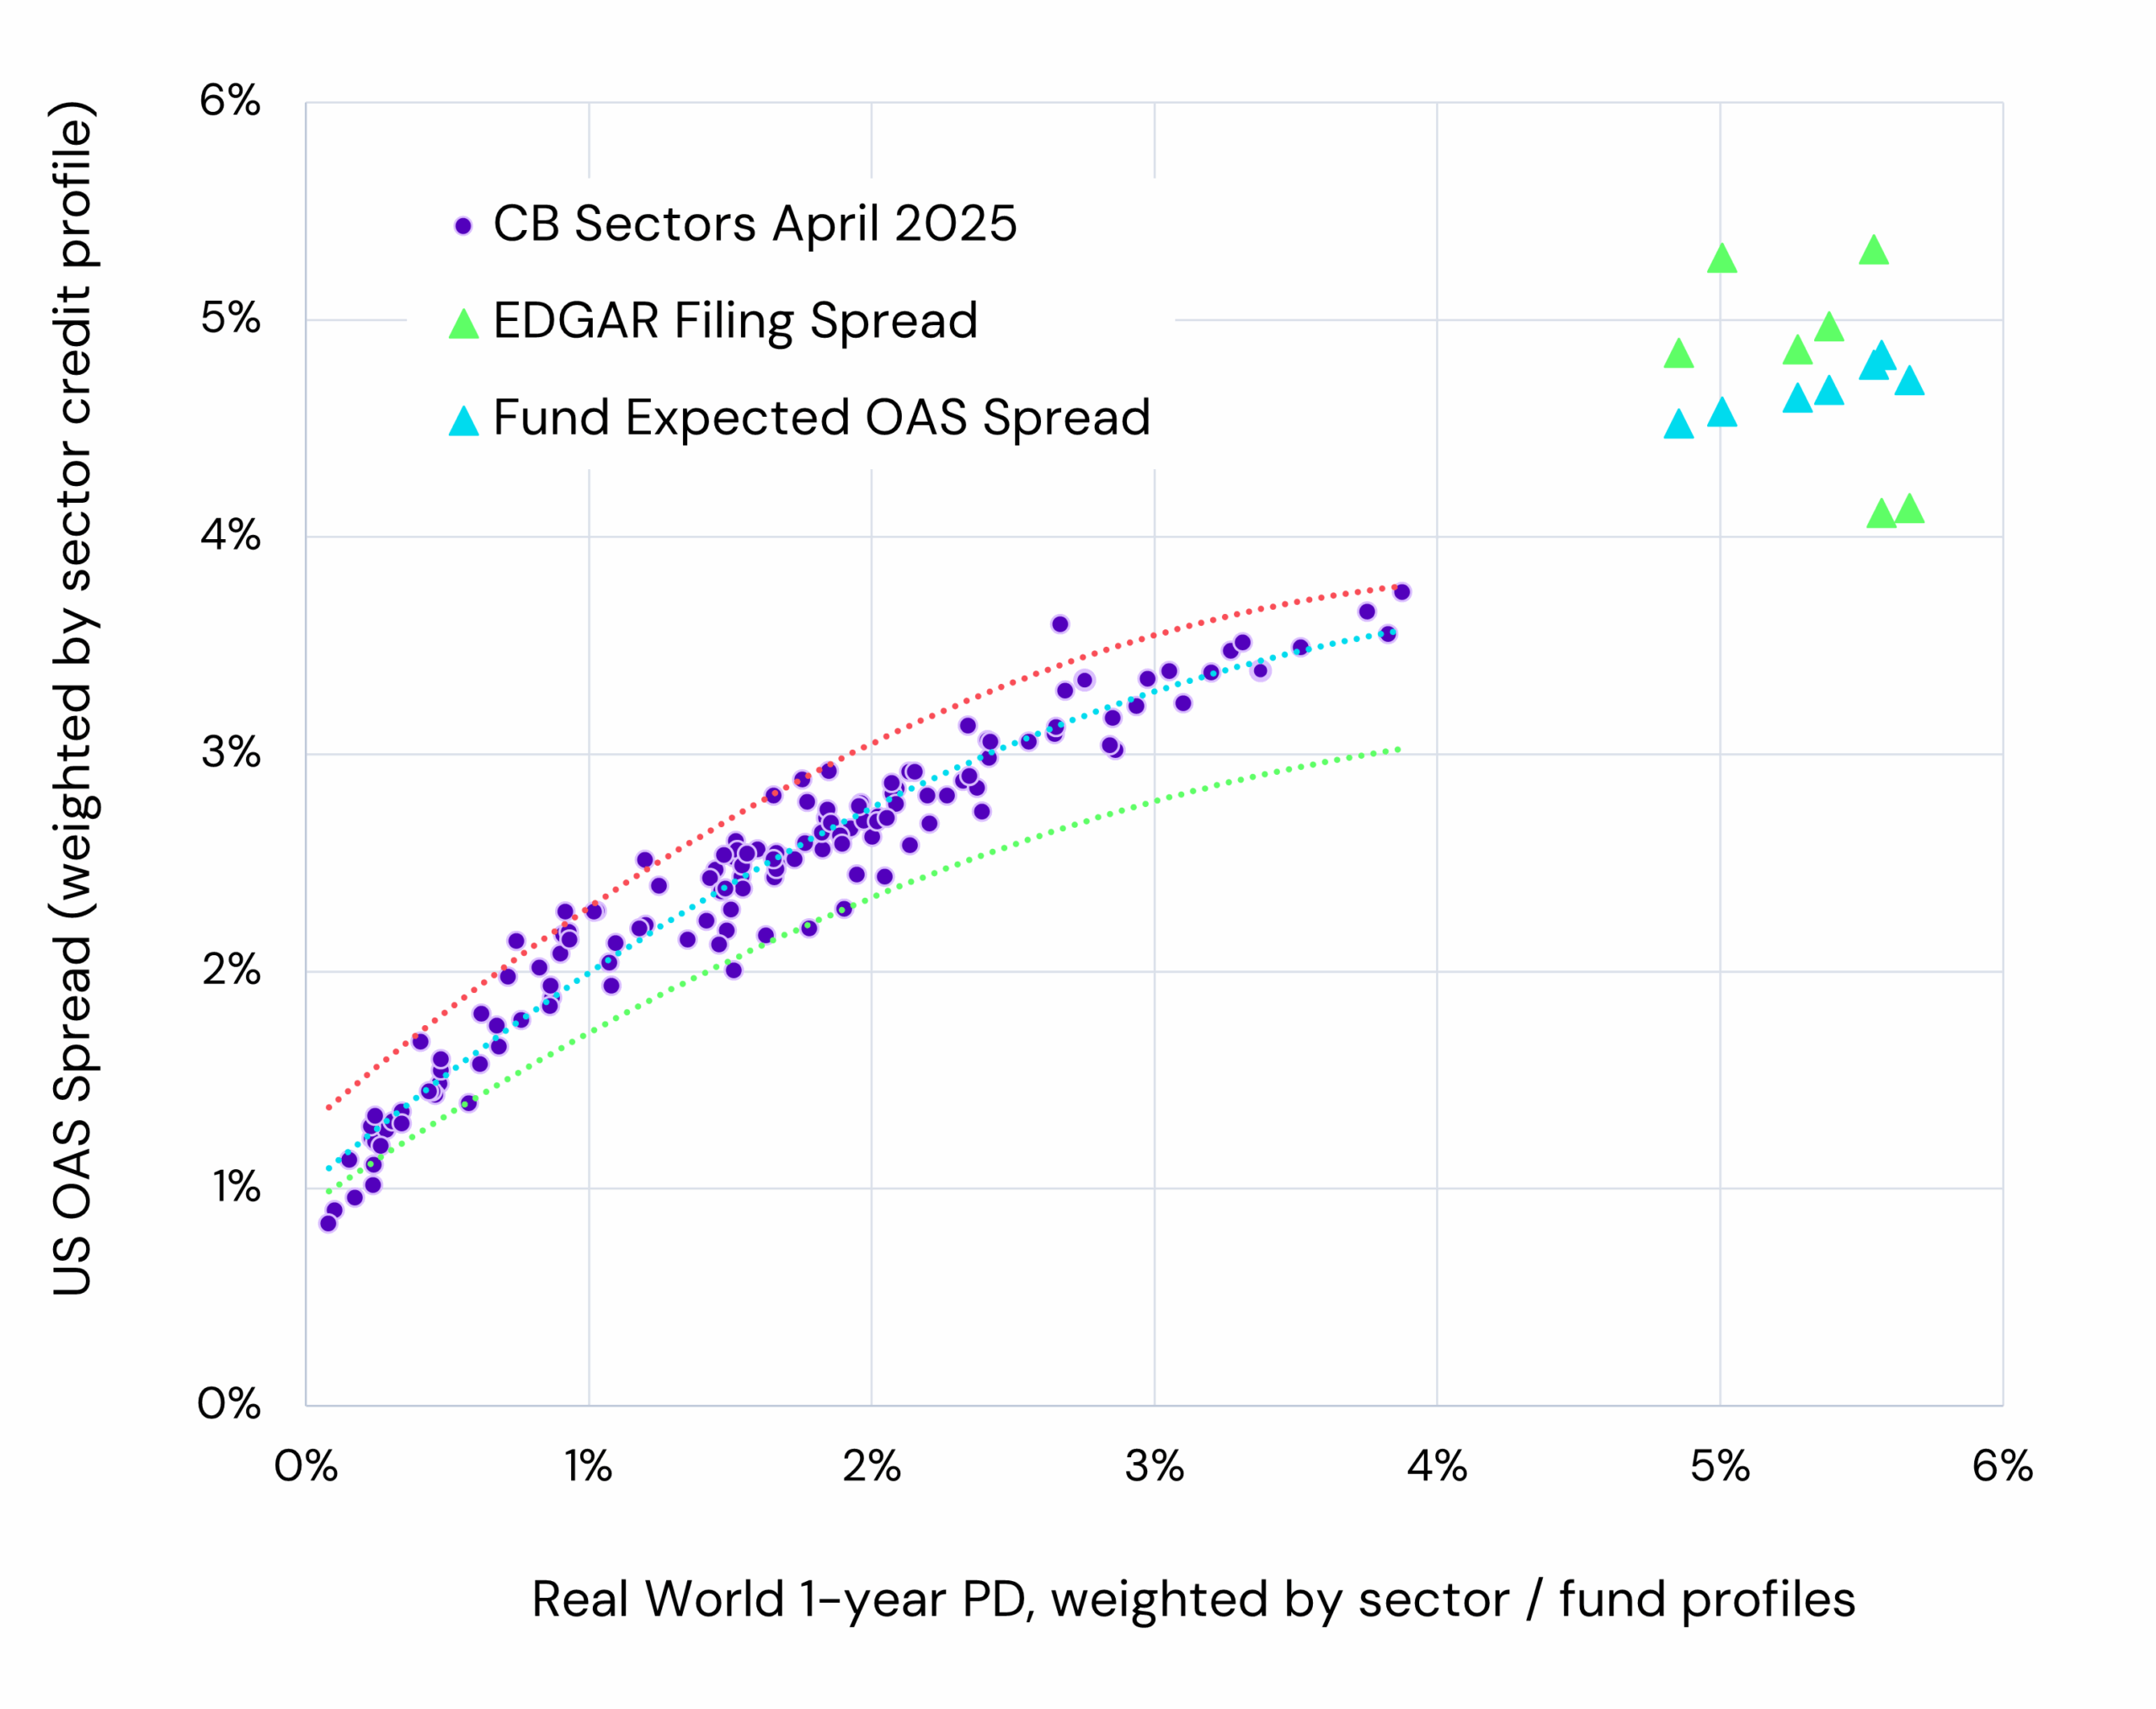
Sources: Credit Benchmark, Factset, FT, St. Louis Fed
[Top line = May 2022 / Bottom line = Dec 2023 / Mid line / scatter = April 2025]
This chart shows real world 1Y default risks for these private credit funds in the 4.8% – 5.8% range. If private credit fund holdings were liquid and traded and could be priced like HY bonds, investors could expect spreads are in the range of 4.5% to 4.8%.
Actual spreads vary between 4% and 5.5%. The differences are mainly due to mixed terms and inception dates for holdings, liquidity premiums and loan to value adjustments. But they may also indicate anomalies and mispricings, especially because default risk data is sparse or unavailable for many of these holdings in the absence of consensus estimates.
Conclusion
If bond spreads rise materially above current levels, private credit spreads will have to follow suit. This will maintain their appeal for private credit investors, but the higher funding rates will require enhanced vigilance over borrower credit risk.
Consensus-based insights from Credit Benchmark are the key to mastering this shifting landscape. Partner with Credit Benchmark to transform how your organization assesses and manages private credit risk. With unique data insights and industry-leading analytics, we empower finance leaders to navigate uncertainty with clarity and conviction.
Appendix 1: Using Credit Benchmark Data for Private Credit Portfolio Risk Modeling and Optimization
Mapping to ratings: The consensus database can be used to establish a single name credit rating, updated frequently, with a large peer group of similar names and various metrics to add comfort and credibility.
- Credit Profiles: These ratings can be used to model your portfolio in terms of credit profile (i.e. exposure to aaa/aa/a/bbb/bb/b/c categories).
- Proxies: In the absence of full coverage, proxies can be used. Generally, coverage of 50% or more will usually be representative of the overall credit profile shape of the portfolio.
- Indices: Portfolios can also be modelled by mapping identified holdings (often 80%+) to the very long and growing list of Credit Benchmark indices (e.g. “US Private Unrated HY Autoparts”) and assigning portfolio weightings. Monthly data back to 2015 supports scenario planning and event studies.
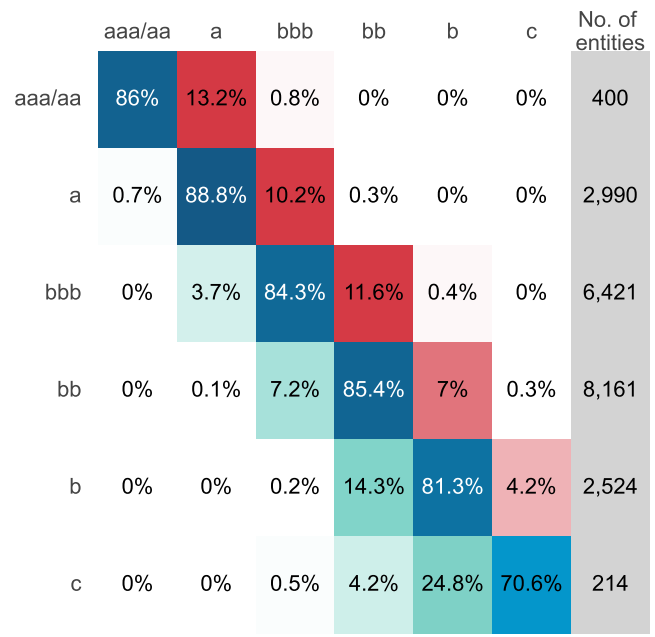
- Transitions: With the large library of Credit Benchmark transition matrices, it is possible to project likely portfolio profile and default rates for future time periods. For example, the matrix below represents transitions for Global Corporate borrowers over the past year:
Credit Rating Transition Matrix: Global Corporates
Correlation Matrix: Global Corporates
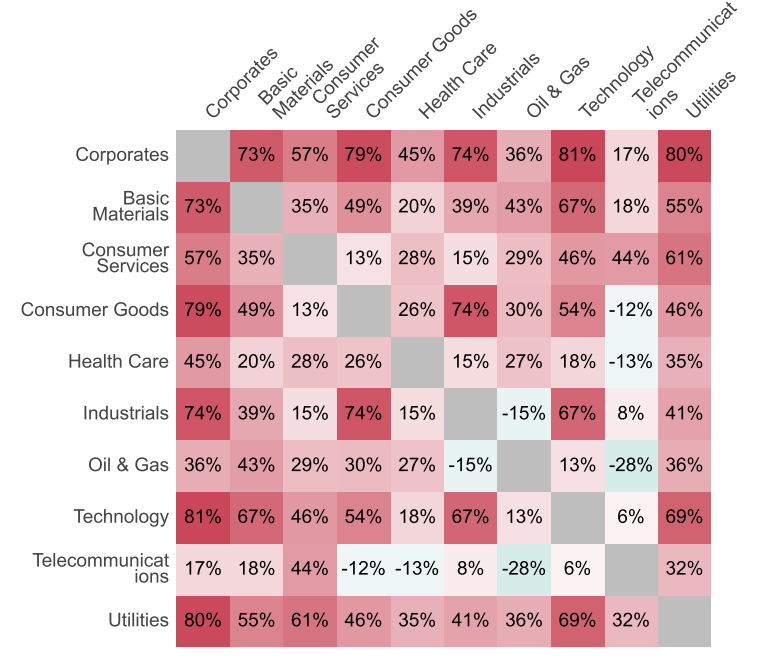
- Correlations: A range of portfolio risk measures can be derived from correlations between indices (above chart) different exposures, such as portfolio volatility over different time periods and scenarios, plus Historic Simulations to potential skew in risk profiles. Excel worked examples are available.
- Pre-Trade: Proposed private credit trades can be modelled using the risk-return framework outlined in this paper, based on a combination of Credit Benchmark consensus default risk data and EDGAR filing spread data.
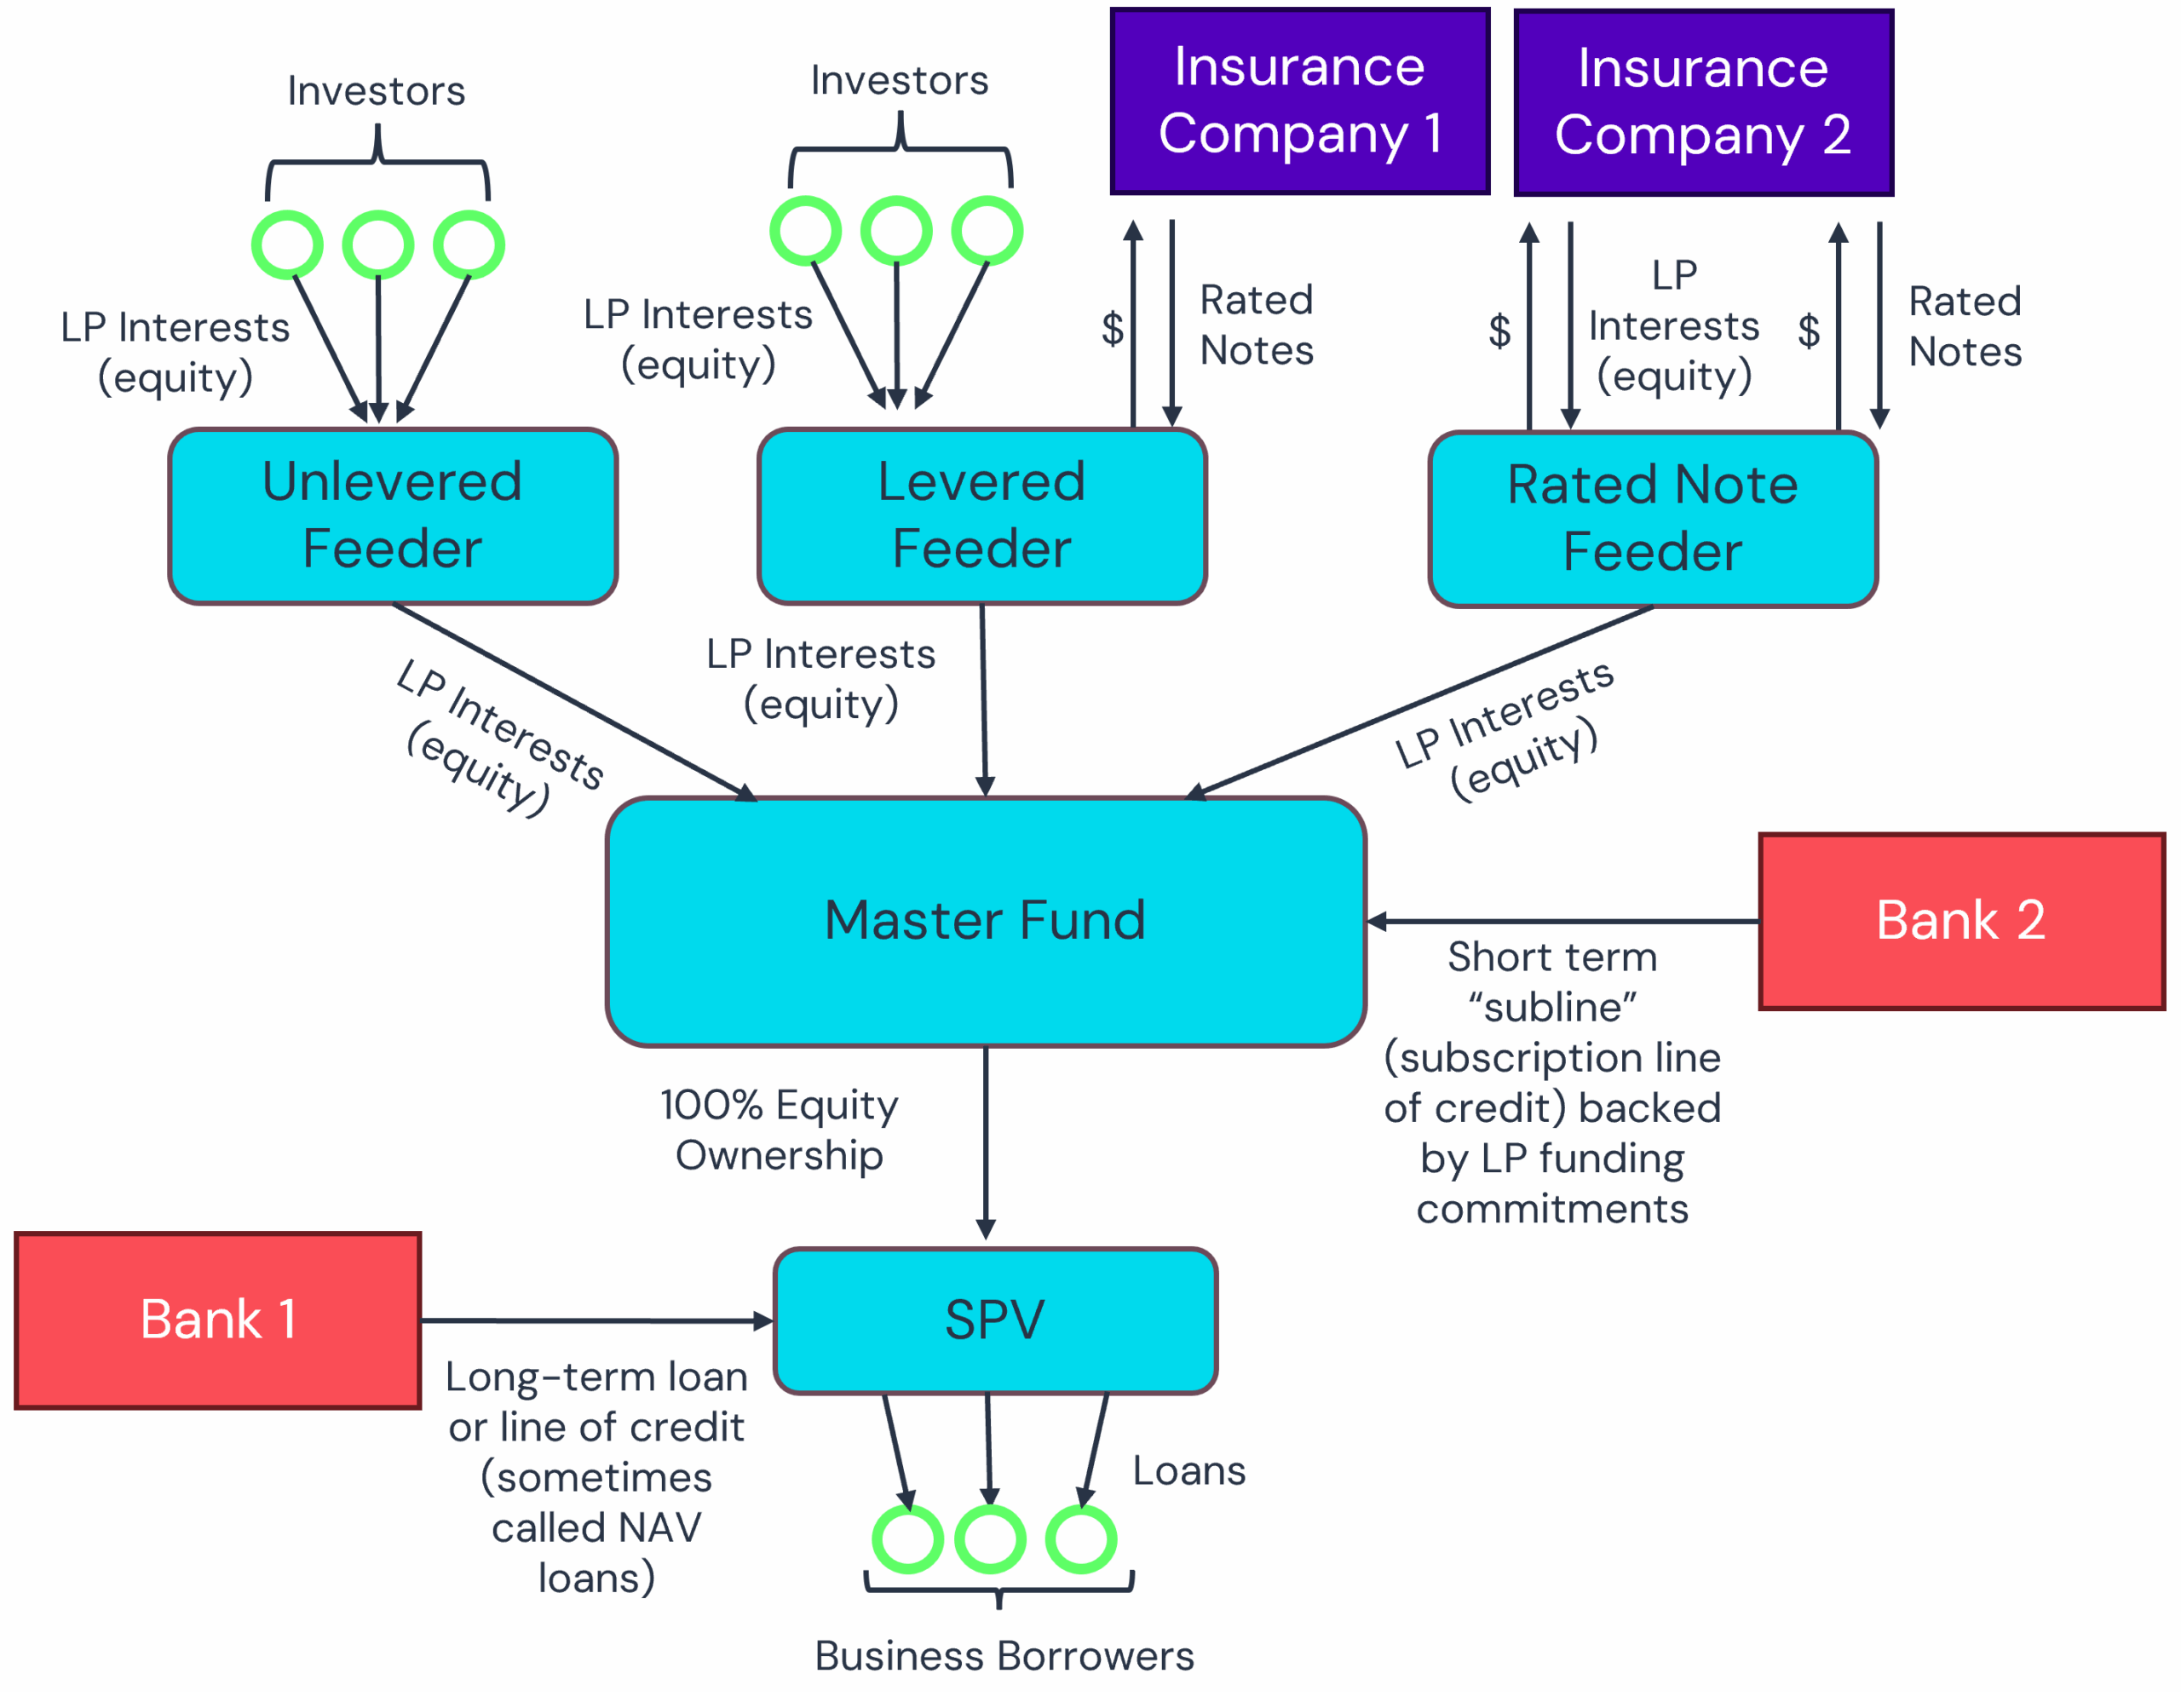
Appendix 2: Private Credit Stakeholders Map
Source: Edward Altman, “Unlocking the Credit Cycle: Insights into Leveraged Finance and the Rise of Private Debt,” Thought Leadership Faculty talk, NYU Stern, May 9, 2025.
Credit Benchmark offers readers a complimentary and fully confidential coverage check report plus a fund-specific version of the risk / return plot on page 4 on your private credit names of interest. Contact us at [email protected] to request this or to learn more about how our data can support your business.
We would like to acknowledge the major contribution by Wanxuan Li from Columbia University who developed software for extracting and standardising the EDGAR filings data used in this paper.
Download
[1] This marginally higher fund spread may be due to (1) volatile credit risk (2) lack of liquidity (3) loan to value adjustments (4) maturity & vintage differences. In addition, private credit recovery rates have so far been very strong, making fund spreads optically higher.
[2] Edward Altman, “Unlocking the Credit Cycle: Insights into Leveraged Finance and the Rise of Private Debt,” Thought Leadership Faculty talk, NYU Stern, May 9, 2025.
[3] Note that some “private credit” borrowers may have public equity listings.
[4] 70% of these are rated by more than 1 bank.
FAQ
Q: What are the biggest risks in private credit today?
A: Key private credit risks include high default potential, low transparency, limited liquidity, and weak covenants. These factors can lead to mispricing and systemic exposure.
Q: Is private credit a systemic risk to the financial system?
A: Some experts, including Professor Edward Altman, warn that unchecked growth, lax underwriting, and limited oversight could pose systemic challenges—especially in downturn scenarios.