
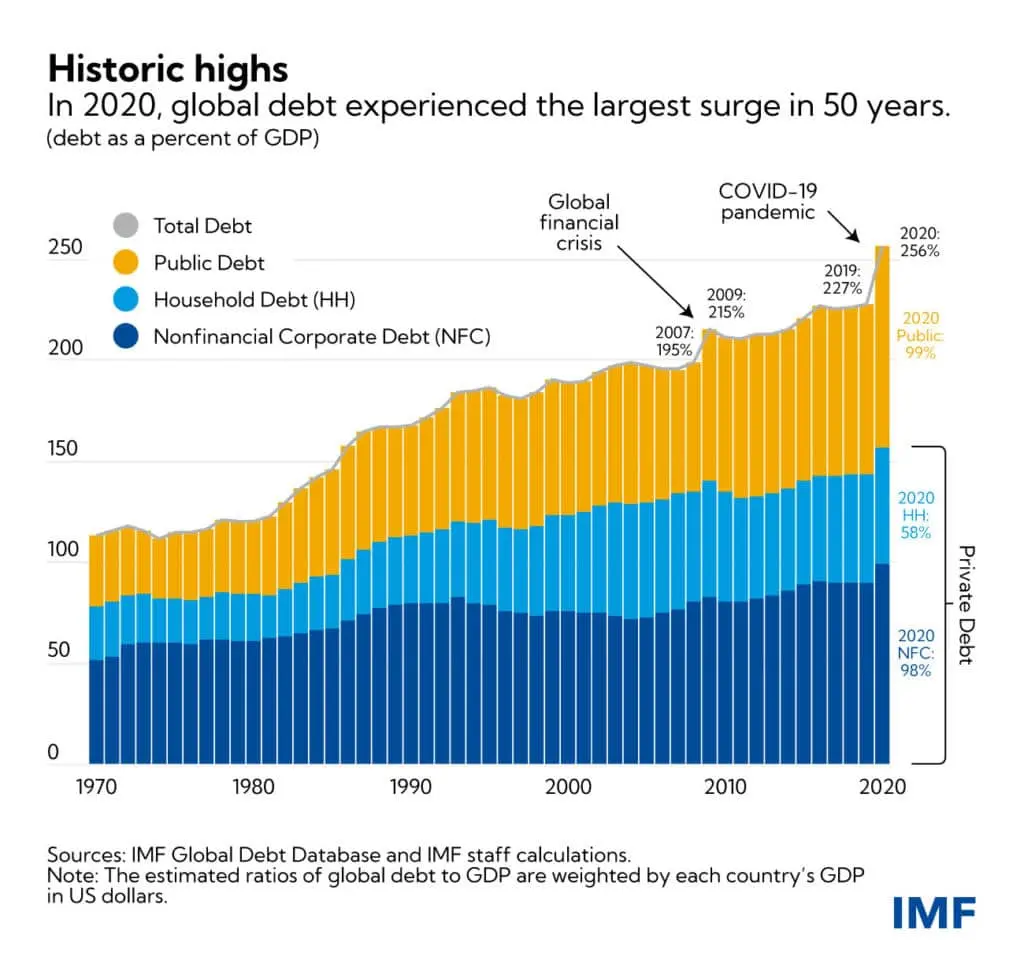
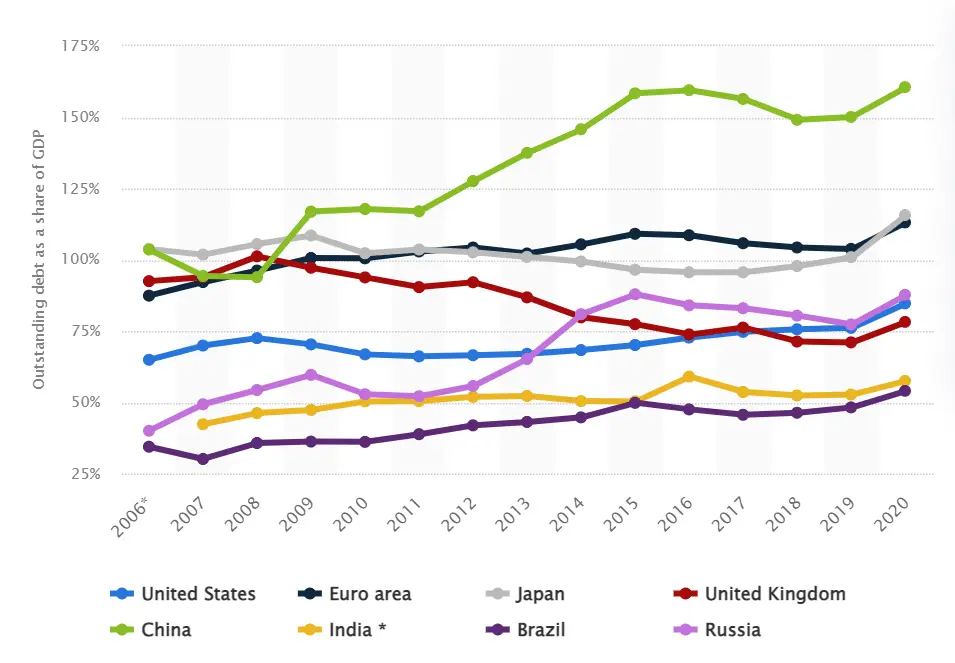
Figure 1 shows overall global debt hitting a new high at the end of 2020, with corporate debt levels in major economies at or close to their highs (UK corporate debt was on a steady downward trend until the pandemic).
Detailed consensus credit data is available on Bloomberg or via the CB Web App, covering many otherwise unrated companies. Contact Credit Benchmark to start a trial or to request a coverage check.
Figure 1: Debt to GDP
With tighter global monetary policy already hitting heavily indebted households and firms, could default rates also reach record levels? Figure 2 shows the history of US Business Loan Delinquencies since the late 1980s.
Figure 2: US Business Loan Delinquencies
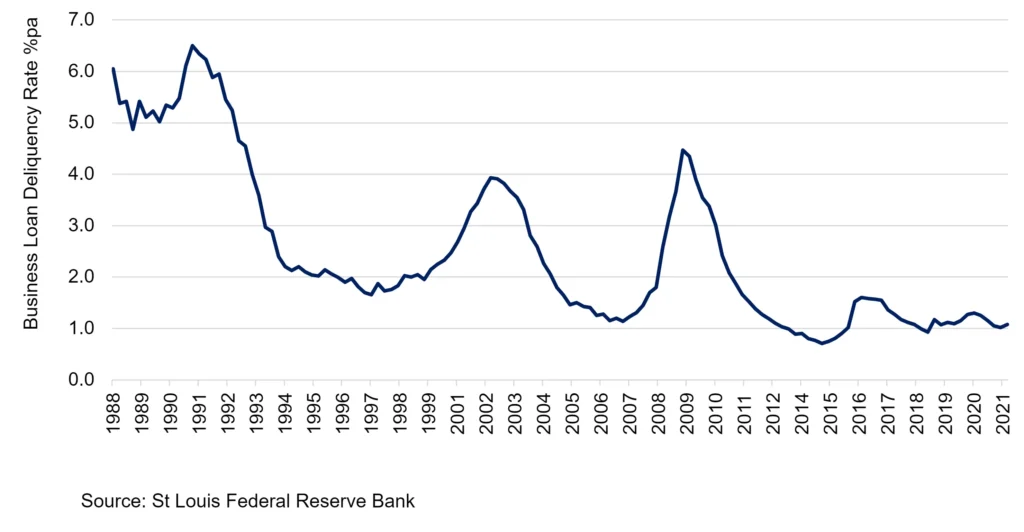
The average over the whole period is 1.7%. The series peaked between 6% and 7% in the early 1990’s, with further peaks in 2002 and 2009. The current rate of 1% is close to the all-time low. Other default rate series averages may be higher or lower depending on the universe. For example, the Moody’s Global Speculative-Grade index has an average default value of 3.8%, with a peak of close to 14% and a low of about 1%. But both series show a similar pattern of peaks and troughs in terms of relative scale and timing.
Figure 3 shows the relationship between the Fed Effective rate and US Business Loan Delinquencies.
Figure 3: Fed Effective and Business Loan Delinquencies
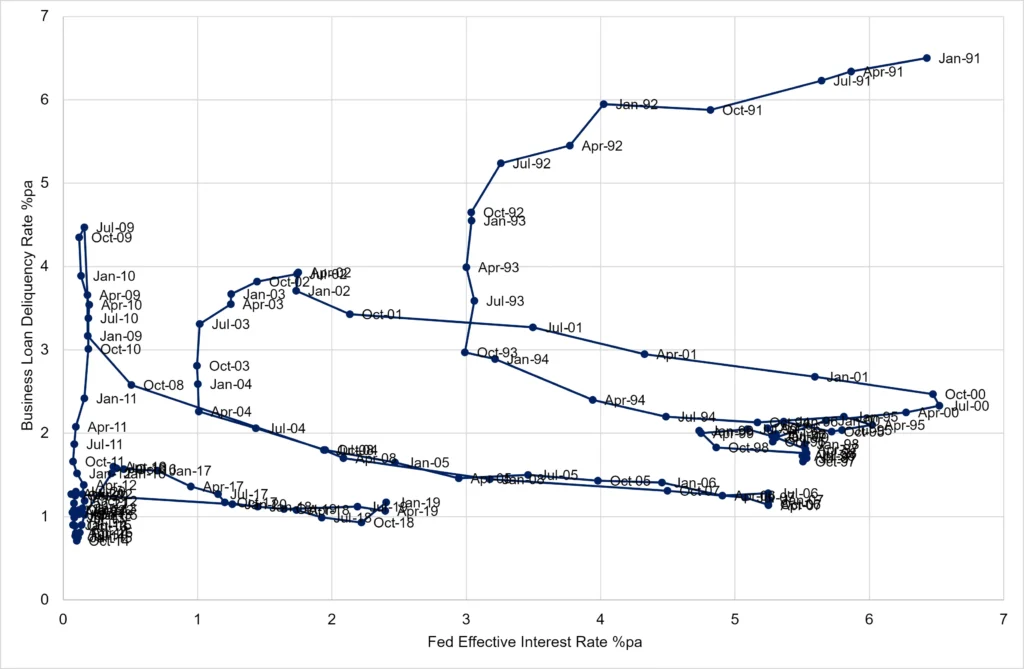
Latest data is in the cluster of points at lower left. Fed rates and Delinquency levels have both dropped erratically from values of about 6.5% in 1991, spiralling down to about 1% (Delinquency) and close to zero (Fed Effective) in recent quarters.
There have been periods when the Fed Effective Rate has been close to its high for the period, and at the same time Delinquencies have been in the lower half of their range for this sample. This suggests that other factors – such as aggregate debt loads – are likely to play a key role in determining the impact of the current round of Fed hikes.
If, for example, the Fed moved short rates to 4%, then the Delinquency rate could be anything from 1.5% to 6% based on the historic range plotted in Figure 3. But with many heavily indebted companies having become acclimatized to paying record low rates to borrow, it is possible that the next spike in defaults will be in the upper half of the range.
Recent Fed policy appears to have reverted to a more traditional inflation-driven approach. In the past 30 years, the average Fed Effective rate has been 2.5% against an average CPI inflation rate of 2.6%. So if inflation becomes stubbornly stuck – say at 4% (still half its current rate) – then Fed rates may reach a similar level. Few commentators are yet talking about inflation staying anywhere near its current level for long, but it is worth bearing in mind that inflation was well into double digits in the 1970s and early 1980s – both spikes also a result of war-driven energy shocks.
There are many dependencies here, but if US inflation stabilises at 4% and the Fed follows suit, then default rates measured by US Business Loan Delinquencies could be above 3.5% (half the range of 1.5% to 6%) – more than 3 times their current value. At an inflation / Fed rate level of 3%, default rates could still be double their current level.
Moody’s base scenario is for the current global high yield default rate of 2% to remain around that level – but rising to about 9% in a pessimistic scenario, an increase of more than 4 times.
It seems likely that default rates will show a sustained rise – they could double, triple or even quadruple from current levels depending on assumptions and the chosen universe.
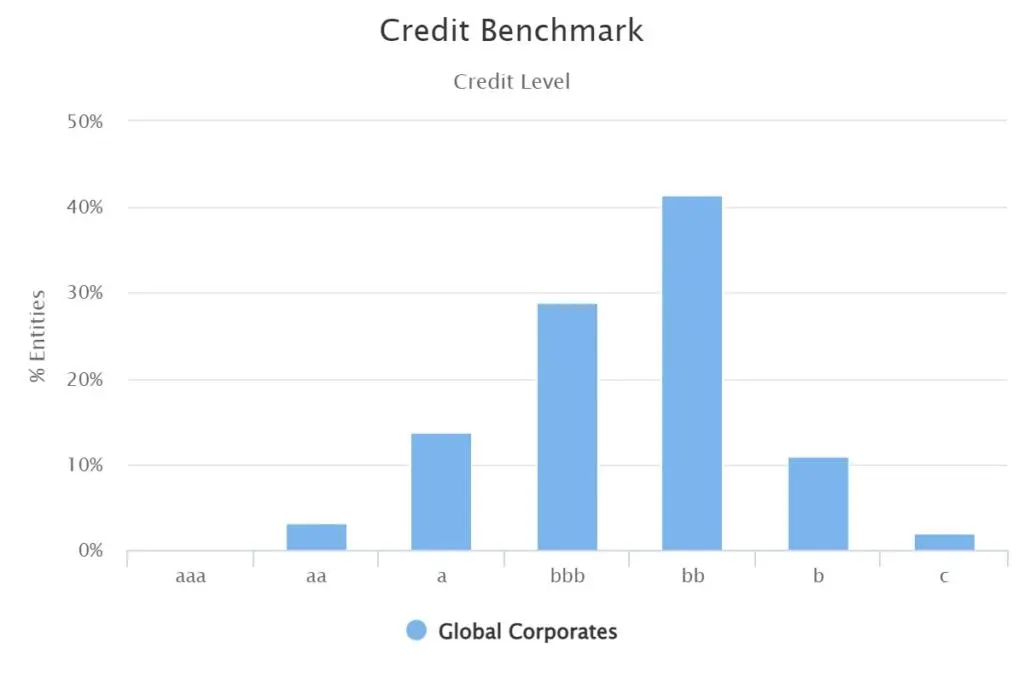
Figure 4 shows consensus credit data for 19,244 global corporates.
Figure 4: Consensus Credit Data for Global Corporates
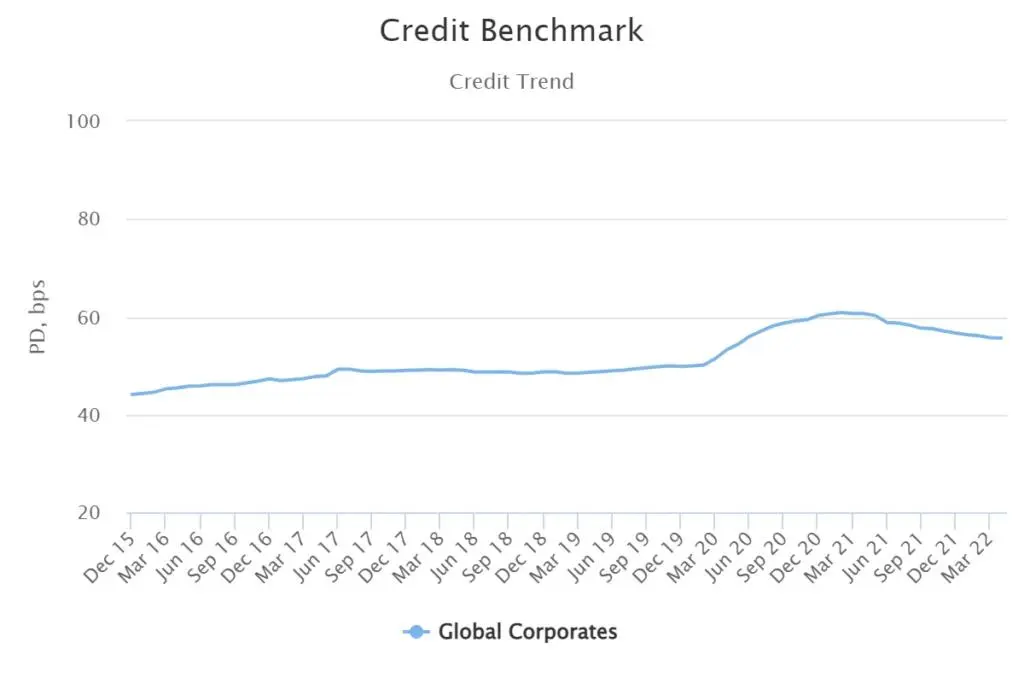
The average Global Corporate PD has risen from 44 Bps at the end of 2015 to a peak of 60 Bps at end 2020. It currently sits at 56 Bps, an increase of more than 25%.
Default rates rise when the credit distribution shifts to the right, with a higher proportion of the corporate universe in the non-Investment grade categories. The average PD rate plotted on the left is very sensitive to small changes in the proportion in the b and c grades plotted on the right, but as a very general rule a tripling of average credit risk corresponds to a shift in the distribution by three to four notches on the 21-category scale – meaning that typical bbb+/bbb/bbb- firms move into the bb+/bb/bb-/b+ range.
Consensus credit data covers a large universe of otherwise unrated names; these can be used in calculating quarterly transition matrices to track credit distribution shifts in detail. Credit Benchmark provide regular updates on the speed and scale of movements in the global corporate credit distribution and the impact on average PDs.