Global Default Risk Rising But Some Sector Bright Spots
Table of Contents
Introduction
Key Findings
- Global Corporates vs. Global Financials vs. Global Sovereigns: Broad Negative Trends Continue
- Industry and Sector Turning Points: Many Sectors Showing Short Term Positive Bounces
- US Sector PD Comparisons: Beverages Are Largest Monthly Drop
- Credit Volatility: Equity VIX Up, Credit Volatility Down
- Leveraged Loans: Credit Downturn Undermines Positive Investment Return
- Food Producers: From Conflict to Climate Change; Africa Is Largest Impact
- Oil & Gas: Net Default Risk Improvement for Most Indices
- Sovereigns: Rising Sovereign Default Risk Mainly Driven by Africa
- US Commercial Real Estate: Major Risk to Shadow Banking Sector
- Portfolio Default Risk Report: Taiwan Semiconductor Customer Universe
Credit trends in 2023 have not (yet) been as damaging as expected. In early 2023, many commentators were pessimistic about the impact of sustained higher interest rates, projecting steep increases in corporate failures. For example, S&P expected US default rates to more than double from 1.6% to 3.75%, and a similar spike in Europe.
The bank consensus has been more subdued, although recent trends suggest more defaults in 2024. Household finances are under stress, but personal bankruptcies in the US and UK remain stable, albeit at high levels (they rose sharply 2014 – 2018). US Business Loan Delinquencies ticked up in Q2 this year but remain below the 5-year average. Monthly UK Corporate insolvency stats are very volatile, but do not show a clear upward trend.
Commercial real estate woes are a continuing problem for corporate owners, financial lenders and fund investors; this sector is the likely source of any further problems in second line and shadow bank sub-sectors. But it is worth noting that leveraged loans – which include a large slab of commercial real estate as collateral – have been surprisingly robust investments, despite steady credit deterioration.
Property is also at the core of problems in the Chinese financial system; with likely contagion into the real economy, as well as some risk to international property values if Chinese real estate investors try to raise liquidity from overseas markets.
Leisure industries are also feeling the intermittent chill of the El Nino summer along with the effect of wildfires on tourism and the fading of the post-Covid bounce.
Tech is seeing pockets of weakness in some chip markets although AI-focused chipmakers are caught up in the AI frenzy. And some less glamorous tech areas are also benefitting from the AI effect.
Food remains a major issue. War and weather are hitting production and supply chains, with no improvement likely anytime soon. The 2023 harvest in the Northern Hemisphere will probably disappoint, and credit data is confirming the major challenges in this industry. Higher food prices also undermine Central Banks’ attempts to tame inflation.
Middle East instability is pushing up fuel prices ahead of winter, adding to the $4trn post-Ukraine windfall for energy companies. Green investment policies are discouraging energy firms from major E&P investment, further intensifying the spot market squeeze. The “new normal” oil price floor may now be $80 per barrel.
Although the credit picture is mixed for Corporate and Financial sectors, the fundamental outlook for most Governments seems mainly negative. With the exception of a few energy-resource rich countries, most Sovereigns face a long list of issues including inflation-linked payroll costs, pressure for climate related investments and increased military spending, migrant crises, a spate of military coups in Africa, failing local governments, and growing losses on QE bond portfolios. But the consensus credit impact globally is so far limited, with only Africa showing a large and sustained decline. Apart from Africa, latest modest deteriorations include China, Brazil, Belgium and Estonia. And while the US may have averted a Federal shutdown for now, the risk of a Moody’s downgrade remains.
Global Corporates vs. Global Financials vs. Global Sovereigns
Broad Negative Trends Continue
The following charts show global trends for average PDs and % balances between improving and deteriorating companies, for the past 12 months.
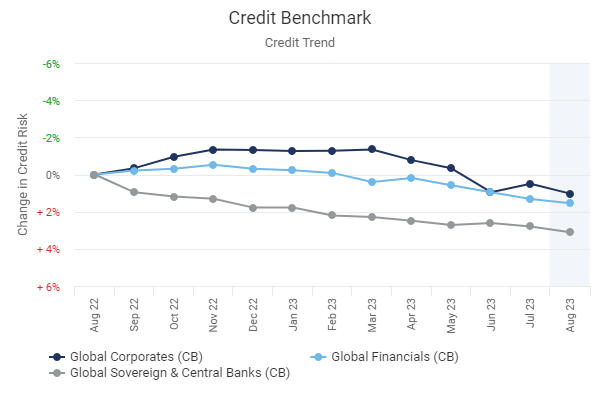
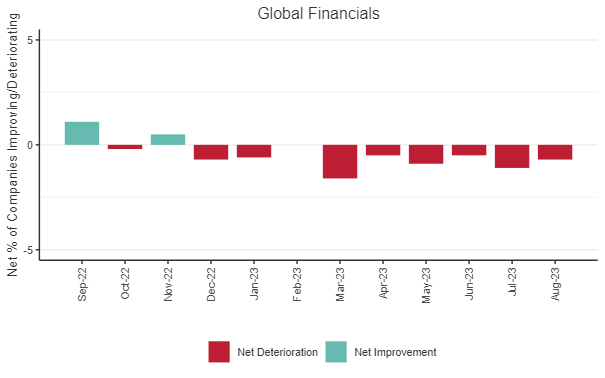
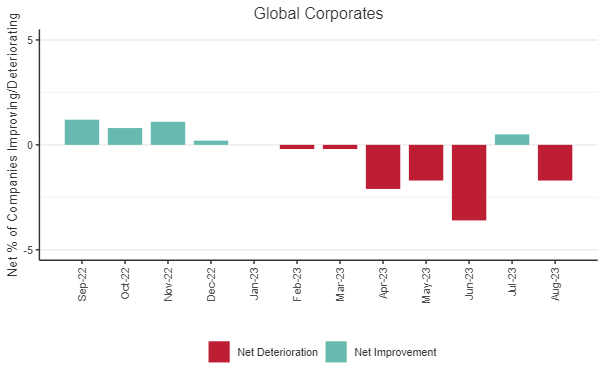
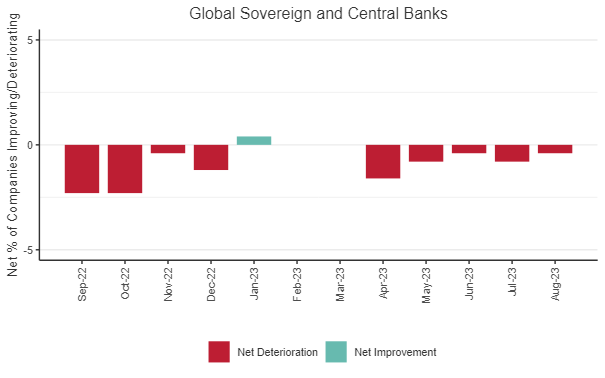
Globally, Corporates, Financials and Sovereigns all show negative credit outlooks (i.e. deteriorations outnumber improvements); for Financials this is the ninth month without a net positive.
Industry and Sector Turning Points
Many Sectors Showing Short Term Positive Bounces
The lists below show detailed global industries and sectors with recent possible credit trend turning points. These have either started to show a net bias to deterioration after a run of positives, or vice versa.
Positive Turning Point:
Previous 3M Negative, Current 1M Improving
- Global Technology Hardware and Equipment
- Global Computer Hardware
- Global Mobile Telecommunications
- Global Gas Distribution
- Global Banks
- Global Pension Fund
- Global NPO or Foundation
- Global Social Work and Charities
- Asia Construction and Materials
- Asia Heavy Construction
- Asia Utilities
- Asia Electricity
- Asia Conventional Electricity
- Asia Specialty Finance
- Hong Kong Banks
- Singapore Consumer Goods
- Singapore Industrial Suppliers
- Europe Industrial Suppliers
- Europe Technology Hardware and Equipment
- Europe Gas Distribution
- Europe Financial Services
- Europe Social Work and Charities
- Latin America Financials
- Chile Basic Materials
- North America Oil and Gas
- North America Technology
- North America Technology Hardware and Equipment
- North America Computer Hardware
- North America Alternative Electricity
- North America Asset Managers
- North America Pension Fund
- North America Real Estate Fund
- Canada Basic Materials
- Canada Technology
- Mexico Corporates
- Mexico Industrials
- United States Industrial Metals and Mining
- United States Iron and Steel
- United States Auto Parts
- United States Large Industrials
- United States Construction and Materials
- United States Large Technology
- United States Technology Hardware and Equipment
- United States Computer Hardware
- Pacific Mutual Fund
- Australia Mutual Fund
Negative Turning Point:
Previous 3M Improving, Current 1M Negative
- Asia Consumer Services
- EU Large Oil and Gas
- Netherlands Consumer Goods
- Netherlands Oil and Gas
- Netherlands Oil and Gas Producers
- North America Retail REITs
- Mexico Investment Services
- United States Hotels
- United States Retail REITs
- Pacific Corporates
These trend shifts are spread across diverse sectors and this month positives outnumber negatives by more than 4 to 1. Some of the positives look like a pause in a long string of negatives; it will be important to see how many of these are sustained in coming months.
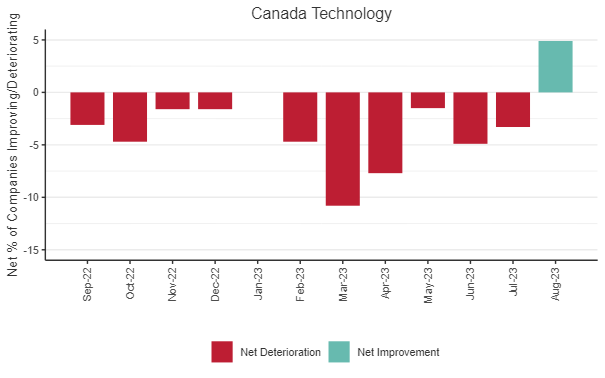
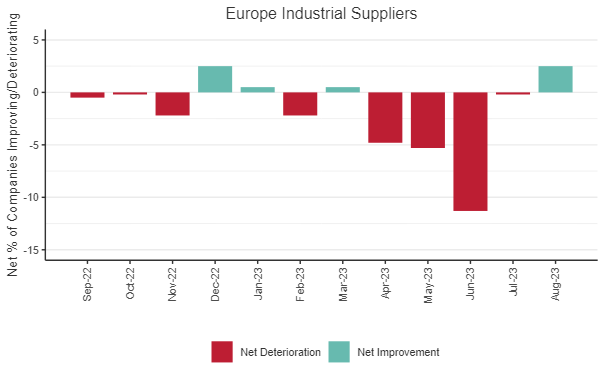
Technology features heavily in the positive turning point column (left), across US, Canada and Globally. Industrials also appear in the positive turning point column.
The UK shows no actual turning points this month, all sectors show continuation of previous trends.
Despite this long list of bouncing sectors, the previous section showed that global average default risks continue to rise.
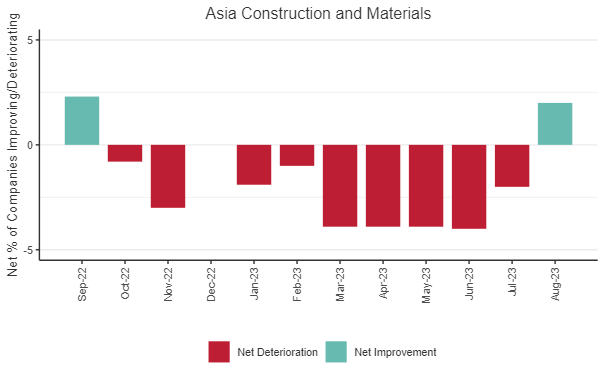
The charts below show highlights from the Industry and Sector Turning Points in the previous table – these are based on the % of improving vs. deteriorating credit estimates across each sector universe.
Positive Turning Point
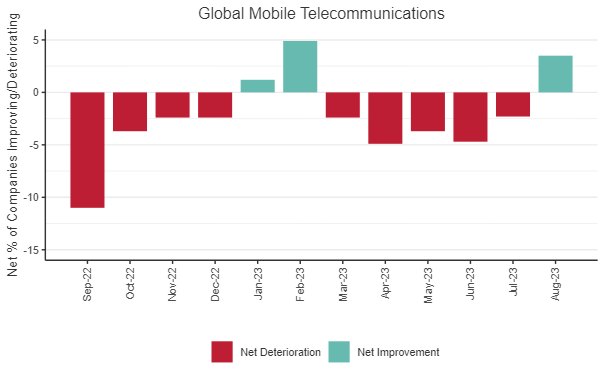
Telecomms regularly feature in these lists, both positive and negative. Global user saturation, slow revenue growth and low margins, plus the game-changing impact of satellite technology are persistent negatives; but the industry continues to defy some of the more pessimistic assessments.
As the satellite network grows and technology improves, there is a possibility of a revolution in the telecom and handset segments. The timing is still uncertain but there are signs of a disruptive free-for-all on the horizon – so default risks estimates are likely to remain volatile.
Negative Turning Point

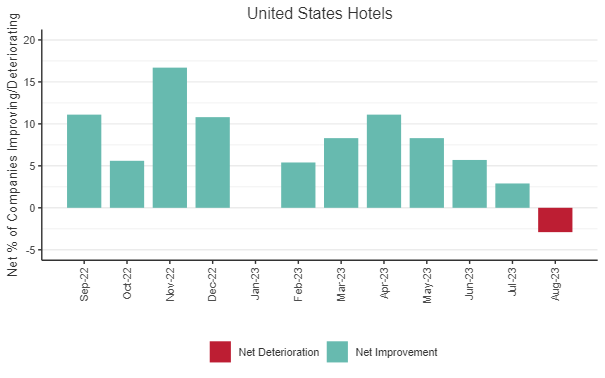
Hotels stand out; the sector has been heading towards negative territory for some time, despite a growing number of Air BnB bans (NYC is the latest). Heavy post-Covid debt loads and a difficult summer season (El Nino, wildfires, flight disruptions) mean that further negatives are likely.
US Sector PD Comparisons
Beverages Are Largest Monthly Drop
With economies and markets giving mixed signals, there is a lot of uncertainty about 2023 default risks. The table below compares average consensus default probabilities for a range of US sectors.
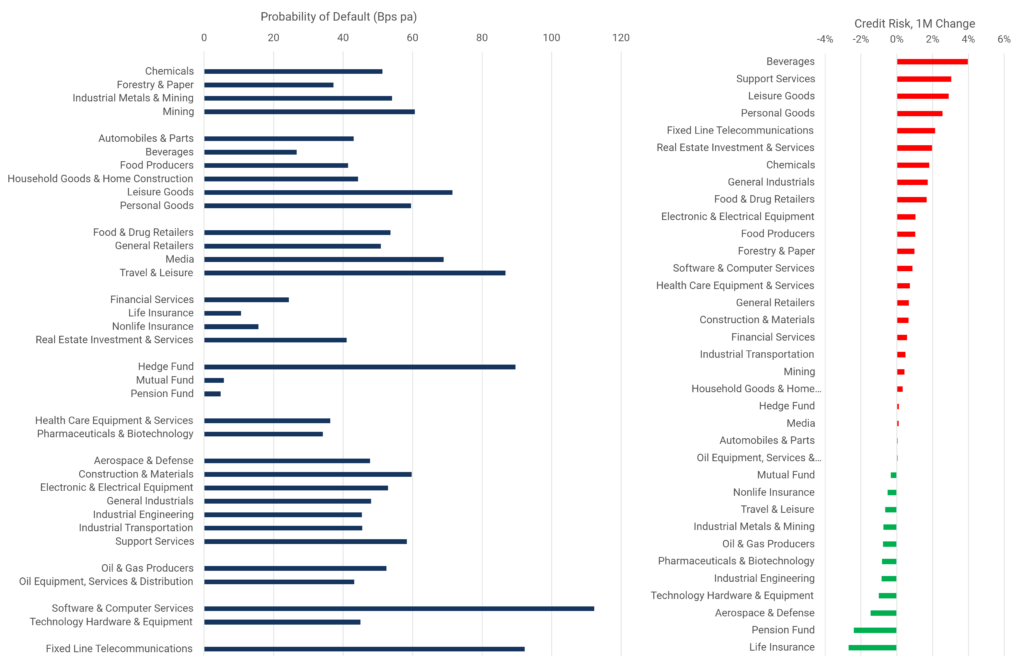
Insurance and Funds – apart from Hedge Funds – remain very low risk. Travel & Leisure, Hedge Funds, Software, and Fixed Line Telecoms are highest in the 80 -120 Bps range. The mid-range includes Mining, Leisure Goods and Media.
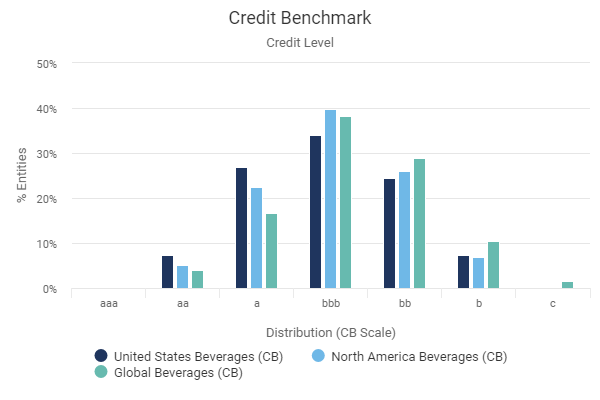
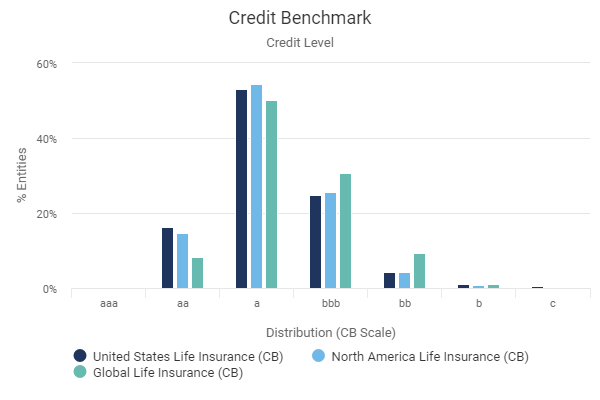
Beverages stand out as the largest monthly drop – reflecting the poor summer. Other large sector increases this month include Support Services, Leisure Goods, Personal Goods and Fixed Line Telecoms. Improvements include Life Insurance, Pension Fund and Aerospace & Defence.
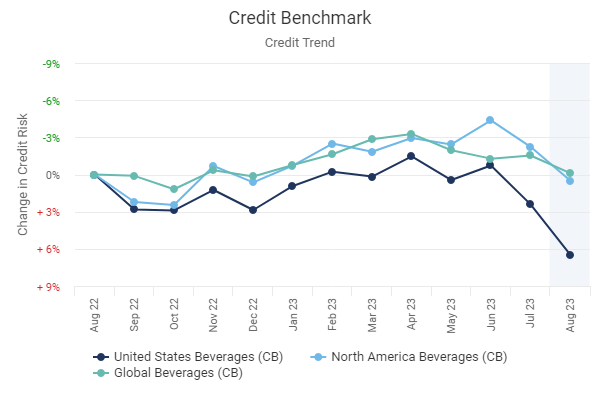
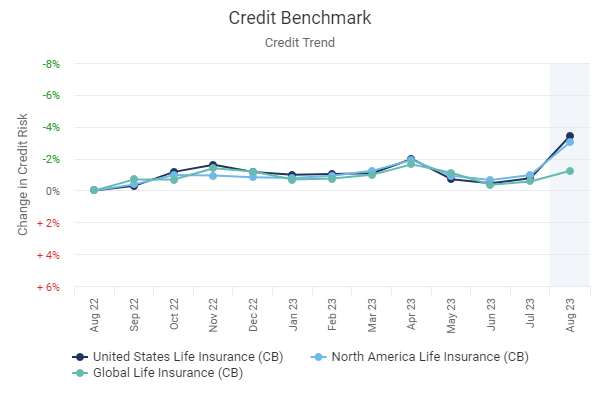
The charts below show recent trends for US, North America and Global Beverages and Life Insurance, plus default risk distributions.
Beverages Credit Trends
Life Insurance Credit Trends
Beverages Credit Distribution
Life Insurance Credit Distribution
Credit Volatility
Equity VIX Up, Credit Volatility Down
VIX
The chart below shows percentiles for credit index 6-month rolling volatility. For approximately 1,200 indices, rolling volatility shows the speed and scale of PD changes; these can give advance warning of changes in transition rates. The percentiles plotted here are the most sensitive to turning points in PD volatility.
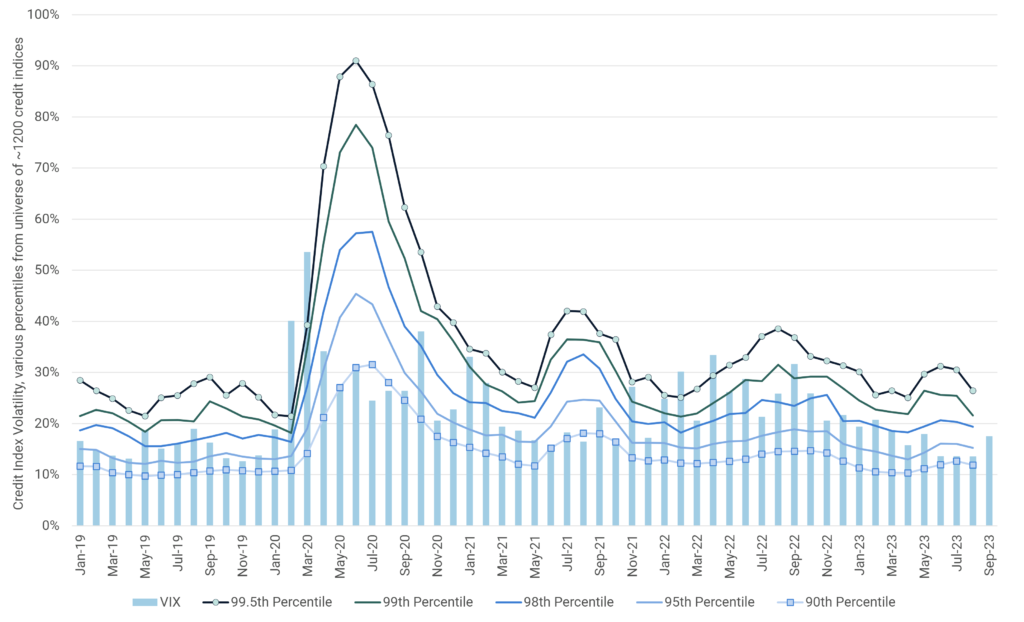
Across the CB index universe, all percentiles are turning down this month. The Equity VIX was stable at a near all-time low the previous 3 months but has ticked up in the latest month.
Dispersion
The next chart is based on cross sectional volatility (“dispersion”) i.e., the average range of estimates for single name estimates. (A high value implies widespread uncertainty about individual firm credit ratings, probably around a key turning point; a low value implies a tight consensus and probably indicates that current trends will continue.)
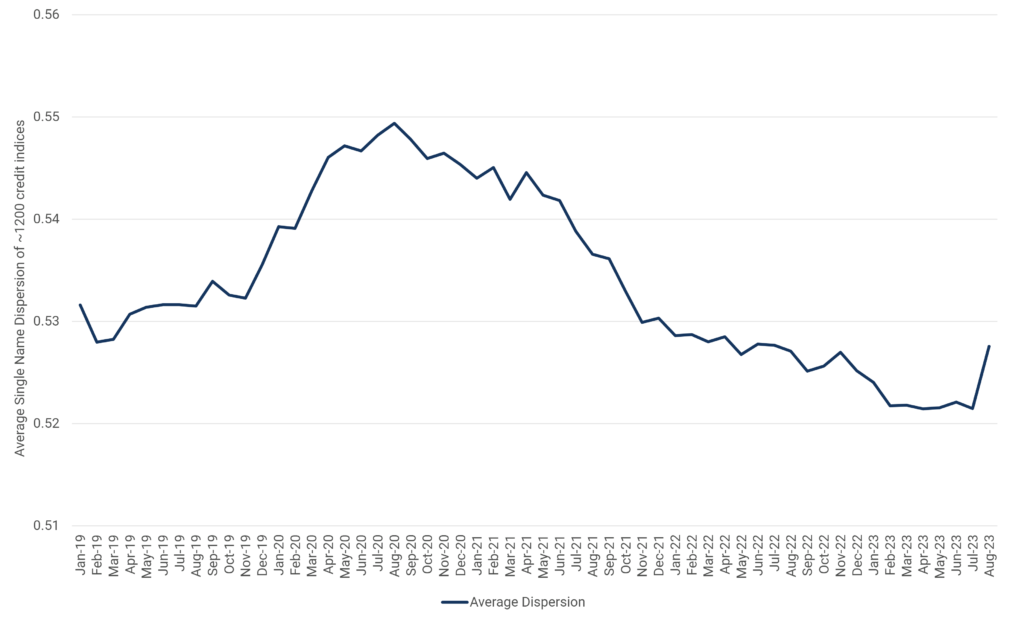
This shows a trend decline[1] since the start of the pandemic; latest data shows a significant uptick. If dispersion continues to rise it will indicate that the consensus is beginning to fray – rising uncertainty about default risk may be an early indicator of a spike in defaults in some high risk sectors.
[1] The actual plotted range is small (about 4% of the average value). Changes in dispersion are more marked at the single name level – for example, when a legal entity is downgraded, the range of PD estimates usually increases.
Leveraged Loans
Credit Downturn Undermines Positive Investment Return
The chart below plots the credit trend of the Credit Benchmark Leveraged Loan Index, made up of 598 issuers in the Credit Suisse Leveraged Loan Index.
The credit index tracked the Credit Suisse Leveraged Loan Total Return in 2021 to early 2022. However, credit has deteriorated by over 8% in the past year while total return is up nearly 9%, highlighting a difference in total return and credit outlook.
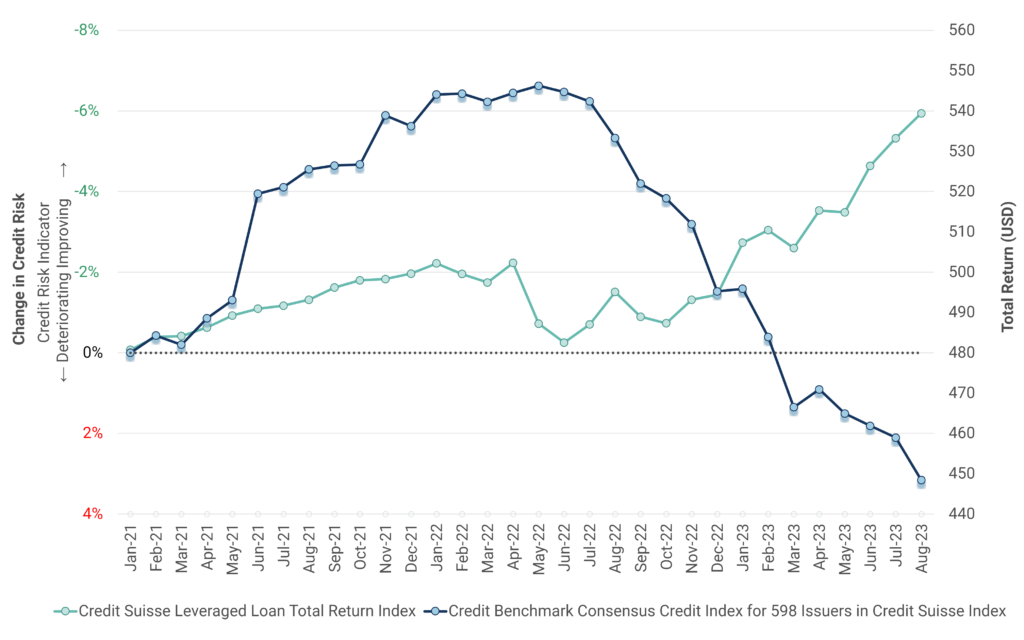
The widening gap suggests that investors believe that any impairment risks are more than covered by collateral. Given the continued weakness in commercial property, some loans may be much riskier than others. Regulators have also highlighted leveraged loan exposure as an area of concern.
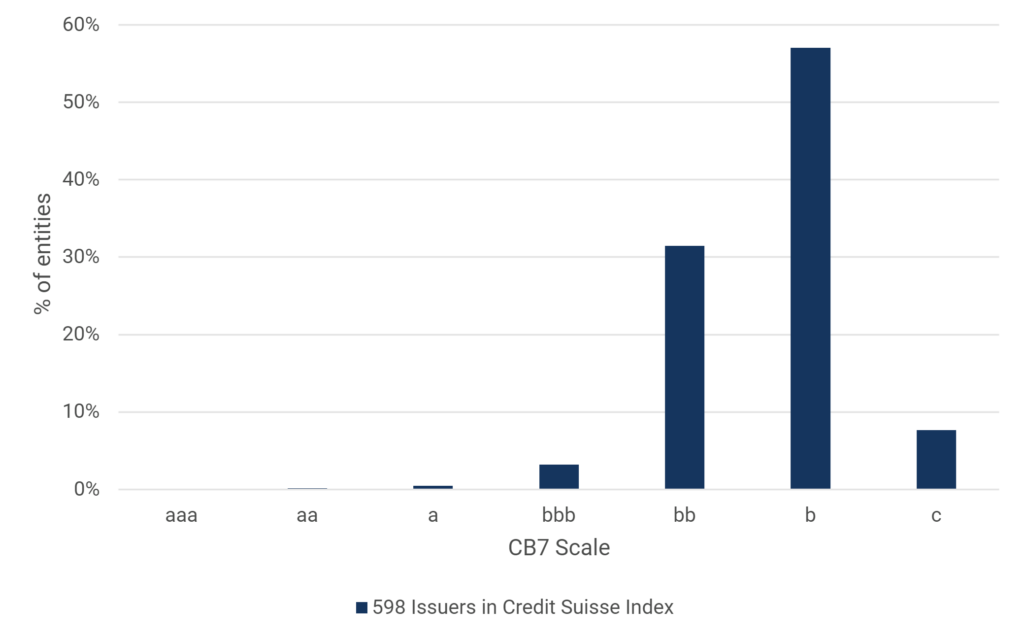
The current 7-category credit distribution chart, below, shows that well over 50% of the 598 issuers in the Credit Suisse Index are rated b; 4% are rated IG.
Food Producers
From Conflict to Climate Change; Africa Is Largest Impact
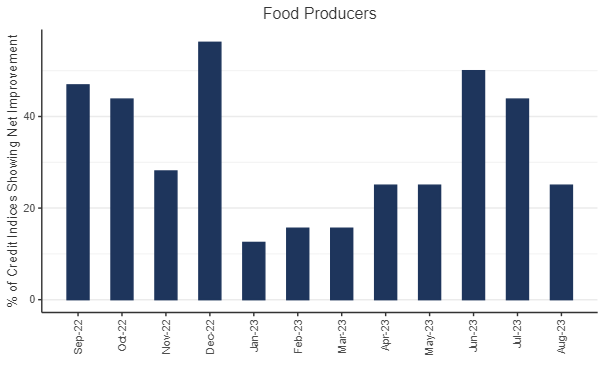
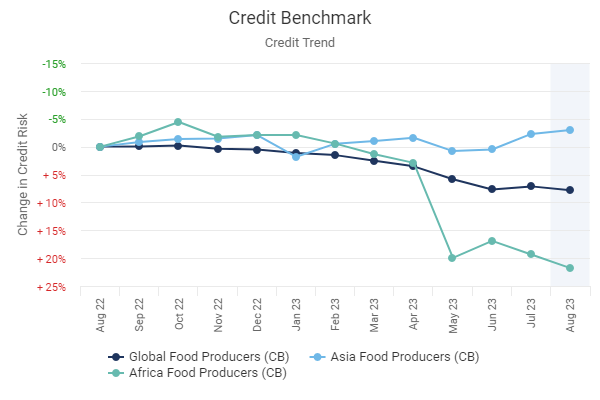
There are many threats to global food production ranging from armed conflicts and supply chain disruption to climate change. Erratic weather, temperature shifts and rising sea levels are a growing threat to global food production.
The chart below covers a universe of 30 Food Producer credit indices, tracking the proportion with net credit upgrades. This has been declining in recent months and currently sits well below the neutral 50% line.
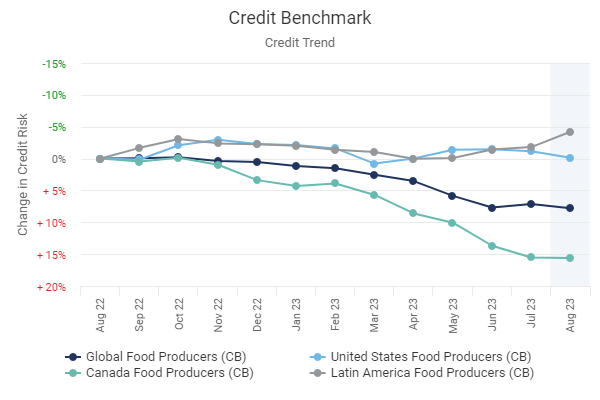
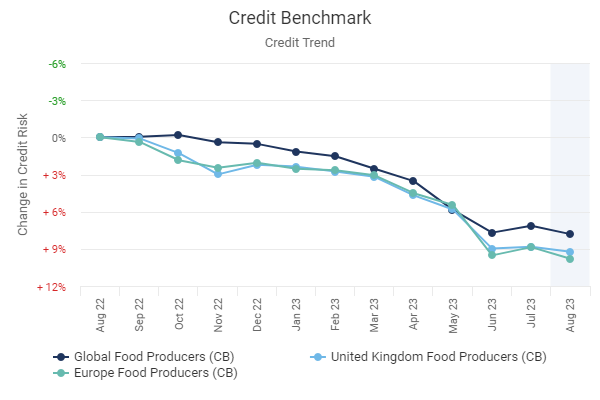
The next set of charts show how different countriy and region Food Producer credit indices have changed over the past year. Canada, UK/Europe and Africa stand out with particularly marked deteriorations.
Global, US, Canada, Latin America, UK, Europe, Asia and Africa Food Producers Credit Trend
Oil & Gas
Net Default Risk Improvement for Most Indices
Although climate change is dominating the news, crude oil production around the world is up. At the same time, gas prices are at their highest level in 11 months as Russia continues to weaponize energy ahead of winter; Saudi Arabia shows no appetite to provide any offset. This is an obvious headache for Central Banks looking for scope to stabilize or even cut short rates.
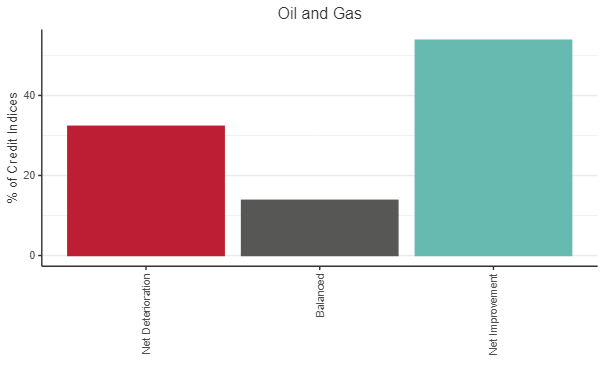
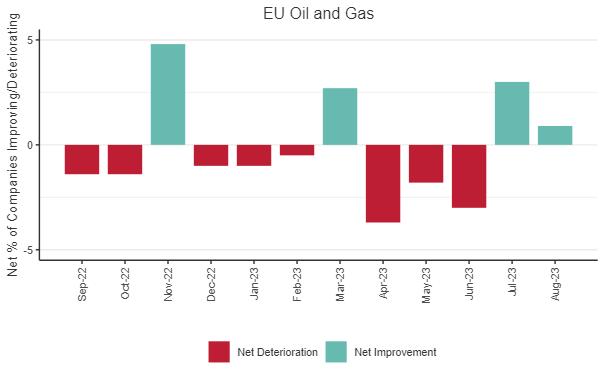
The following charts cover a universe of about 65 Oil & Gas credit indices, tracking the proportion with net credit upgrades. This has been increasing in recent months and currently sits above the neutral 50% line. Only about 30% of Oil & Gas credit indices show net credit deterioration.

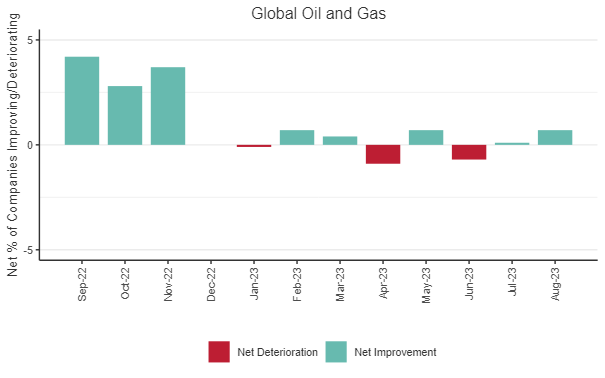
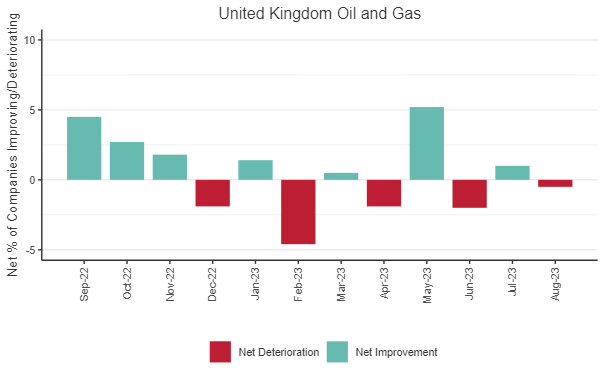
The charts below are based on the % of improving vs. deteriorating default risk estimates in each Oil & Gas country/region credit index.
Global and EU remain positive for another month. The US is still negative, now in its 5th month of deteriorations outnumbering improvements; but the net balance is now much closer to neutral. The UK is flip-flopping while a ramp up in North Sea E&P becomes a major political issue.

Ahead of COP 28, Credit Benchmark will be publishing a detailed look at the impact of climate change on credit across the global economy.
Sovereigns
Rising Sovereign Default Risk Mainly Driven by Africa
The chart below shows recent trends in Sovereign risk for various regions.
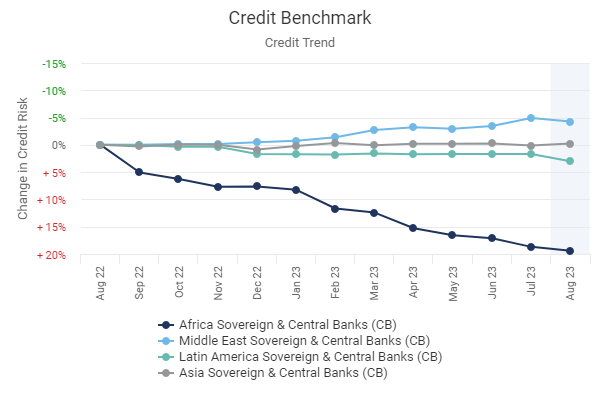
Deteriorating Sovereign credit is mainly driven by Africa, with a 20% increase in average risk over the past year. The Middle East has benefitted from high energy prices in 2023 but is turning down in the latest month; Latin America is also turning down in the latest month, whilst Asia is stable. Specific deteriorations in recent months include China (and Brazil).
A US Government shutdown may have been averted for now, but any further brinksmanship will overshadow Sovereign credit globally.
US Commercial Real Estate
Major Risk to Shadow Banking Sector
Commercial Real Estate woes, especially in the US, are front page news. Ecess capacity, new eco standards, Covid and WFH are all driving structural shifts in demand and supply. While US banks still provide more than half of US commercial real estate debt financing, the non-bank and “shadow banking” sectors are involved in either direct lending or in exposure to property as collateral. As all lenders shrink their balance sheets there is a risk of a doom-loop scenario where falling prices trigger distressed collateral sales.
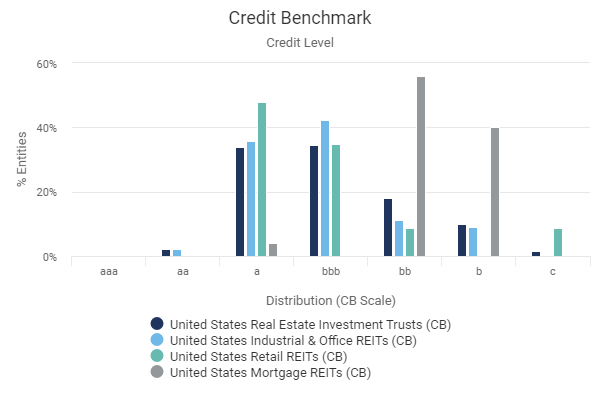
The consensus credit distribution chart below shows that the majority of US REITs are investment grade, with over two-thirds in the a and bbb categories. The exception is Mortgage REITs, representing secured CRE loans. The majority are in the bb category and 40% are in single b. Retail REITS are generally high quality but just under 10% are in the c category – i.e. significant risk of default.
The next chart shows recent credit trends for these sectors.
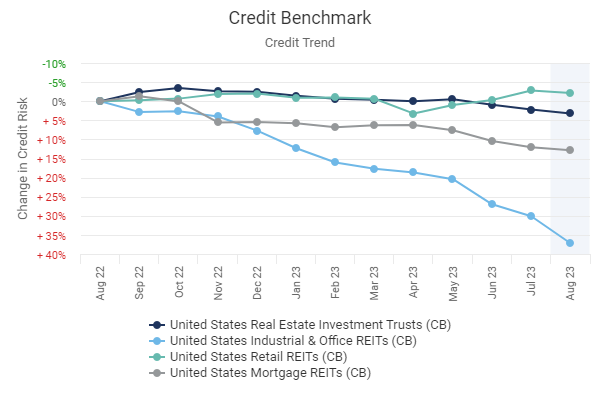
In the past year, the standout worst performer is the combined Industrial & Office category, with a 12M credit deterioration of over 35%. Mortgage REITs have also performed badly.
Portfolio Default Risk Report
Taiwan Semiconductor Customer Universe
Taiwan Semiconductor Manufacturing Co Ltd (TSMC) may postpone its planned production of 2nm chips due to a global semiconductor demand slowdown. In addition, periodic concerns about possible Chinese aggression have led the firm to make major investments in other parts of South East Asia, most recently in Japan.
The below chart shows the current credit distribution of the customers of TSMC, who would be most at risk from any supply interruptions.
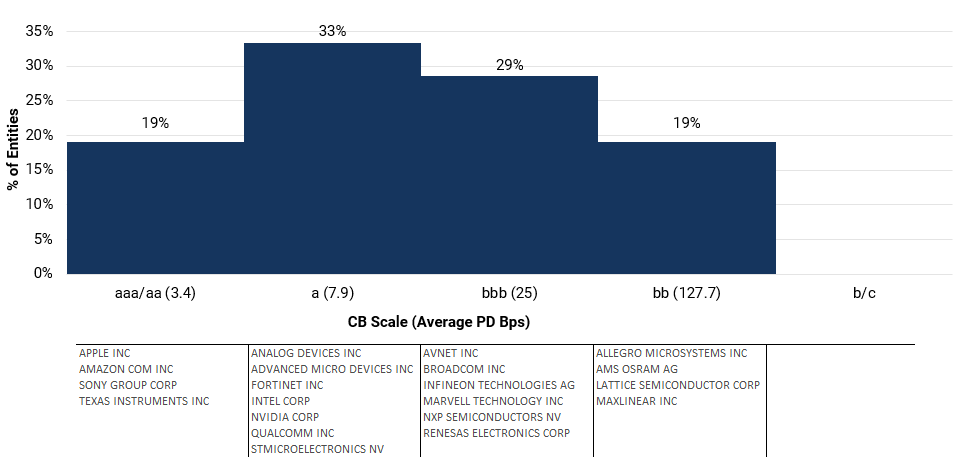
Although the majority of TSMC customers are investment grade, any operational issues at TSMC are likely to trigger knock-on effects for the companies listed here.
Credit Benchmark can provide a full Portfolio Credit Report on customers and/or suppliers of individual companies. Contact us to find out more.
Conclusion
The overall credit picture for 2023 YTD has been more benign than many feared, but global credit indices are still trending towards modest deterioration. This includes sovereigns, although this is mainly driven by Africa, China, and Brazil.
Credit data shows a mix of serious stress (food, leveraged loans) alongside some surprising buoyancy in energy, some tech, and a long list of previously declining sectors that are at least pausing or even turning decisively better.
However, default rates in 2024 will probably exceed the final scores for 2023, and the ongoing global property shakeout will continue to cause new casualties. Inflation has not been tamed, with higher energy and food prices in Q4 curbing any optimism about early rate cuts; and Jamie Dimon at JP Morgan has even raised the spectre of a 7% short rate…
Download
Please complete your details to download the full October 2023 Credit Outlook :