Download the latest Industry Monitor below.
Credit Benchmark have released the end-month industry update for end-January, based on the final and complete set of the contributed credit risk estimates from ~40 global financial institutions.
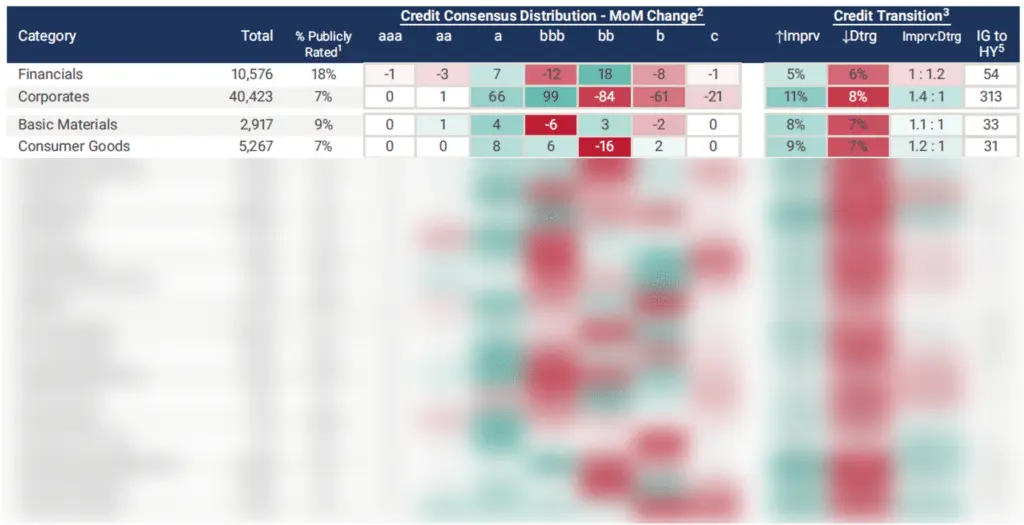
Credit Benchmark covers 40,423 non-financial corporate firms, 93% of which are not rated by a credit rating agency. These Corporates showed improving credit quality last month, with an improvements to deteriorations ratio of 1.4:1. Financial firms (of which we cover 10,576, 82% of which are not publicly rated), showed a slight bias towards deterioration, with a ratio of 1:1.2.
Industry Level Credit Movement:
At the industry-level, Industrial firms (covering 19,502 entities, 97% unrated) were the best performers last month, with a positive ratio of 1.6:1 improvements to deteriorations. Consumer Services (covering 6,376 entities, 93% unrated) was the next best cohort, showing a positive ratio of 1.3:1. Net deterioration amongst the industries was mostly mild, with Technology (1,470 entities, 85% unrated) and Telecommunications (456 entities, 77% unrated) each showing a negative ratio of 1:1.2 improvements to deteriorations. The worst performer of the group was Health Care (1,404 entities, 89% unrated), with a negative ratio of 1:1.7.
Sector Level Credit Movement:
Of the sectors, Construction and Materials (3,290 entities, 97% unrated) and Travel & Leisure (1,691 entities, 93% unrated) came out on top with positive ratios of 1.6:1. Again, deterioration was mild, with UK Oil & Gas (262 entities, 96% unrated) and US Oil & Gas (471 entities, 67% unrated) at the bottom of the group with negative ratios of 1:1.5 improvements to deteriorations.
In the update, you will find:
- Credit Consensus Distribution Changes: The net increase or decrease of entities in the given rating category since the last update.
- Credit Transition: Assesses the month-over-month observation-level net downgrades or upgrades, shown as a percentage of the total number of entities within each category.
- Ratio: Ratio of Improvements and Deteriorations in each category since last update, calculated as Improvements : Deteriorations.
- IG to HY Migration: The number of companies which have migrated from investment-grade to high-yield since the last update (known as Fallen Angels).
Credit Benchmark will continue to provide regular reports on these migration rates. If you have any questions about the contents of this update, please get in touch.