Download the End-November Industry Monitor infographic below.
Credit Benchmark have released the end-month industry update for November, based on the final and complete set of the contributed credit risk estimates from 40+ global financial institutions.
In the update, you will find:
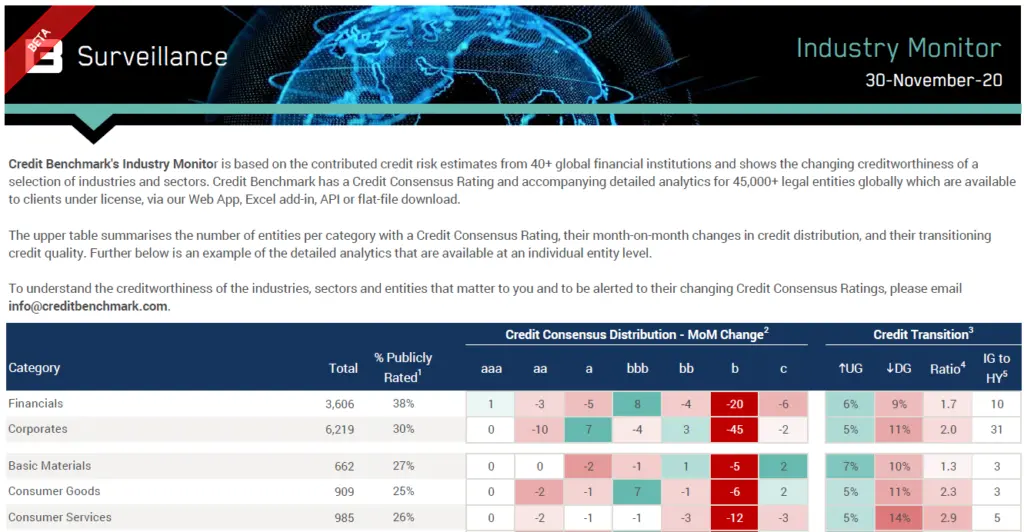
- Credit Consensus Distribution Changes: The net increase or decrease of entities in the given rating category since the last update.
- Credit Transition: Assesses the month-over-month observation-level net downgrades or upgrades, shown as a percentage of the total number of entities within each category.
- Ratio: Ratio of Deteriorations and Improvements in each category since last update, calculated as Deteriorations / Improvements
- IG to HY Migration: The number of companies which have migrated from investment-grade to high-yield since the last update (known as Fallen Angels).
Compared to the figures seen in the October End-Month Industry Monitor, the November End-Month Industry Monitor shows:
- Financials and Corporates have both seen an improvement in the deteriorating/improving ratio since the last update (the ratio for Financials has dropped from 2.1:1 to 1.7:1, and the ratio for Corporates has dropped from 2.2:1 to 2:1). Both groups remain biased towards deterioration, however.
- Almost all Industries and Sectors show a bias towards deterioration this update, with the exception of Utilities which shows an equal weighting between upgrades and downgrades. The severity of the deteriorations is modest. The industry with the largest, or worst deteriorating/improving ratio this update is Consumer Services (2.9:1, up from 2.1:1 last update).
- Apart from Utilities which has a neutral ratio, the industries with the lowest, or relatively ‘best’ deteriorating ratio this month are Basic Materials (1.3:1, unchanged from the last update), and Telecommunications (1.4:1, down from 2.5:1 in the last update).
- Within the sectors, Travel & Leisure shows the highest rate of deterioration, at 7.9:1; a slight worsening since last update’s ratio of 6.1:1.
- The next worse performer amongst the sectors is UK Oil & Gas, at 3:1 – though this is an improvement from last update, when the ratio was 10:1.
- Corporates show a higher proportion of Fallen Angels (companies migrating from Investment Grade to High Yield) with 31 Fallen Angels (0.5% of total), compared to Financials, with 10 Fallen Angels (0.3% of total. Both groups saw fewer Fallen Angels than in the last update.
- Within the industries and sectors, the worst affected were Industrials (12 Fallen Angels; 0.8% of total) and Oil & Gas (8 Fallen Angels; 1.2% of total).
Credit Benchmark will continue to provide regular reports on these migration rates. If you have any questions about the contents of this update, please get in touch.