Download the April Industry Monitor infographic below.
Credit Benchmark have released the end-month industry update for end-March, based on the final and complete set of the contributed credit risk estimates from 40+ global financial institutions.
The trend of credit quality improvement seen in Global Corporates continues, with net positive movement across the board this month. That said, the ratio difference in most industries and sectors is marginal, indicating a pattern of balance – though with an optimistic bent.
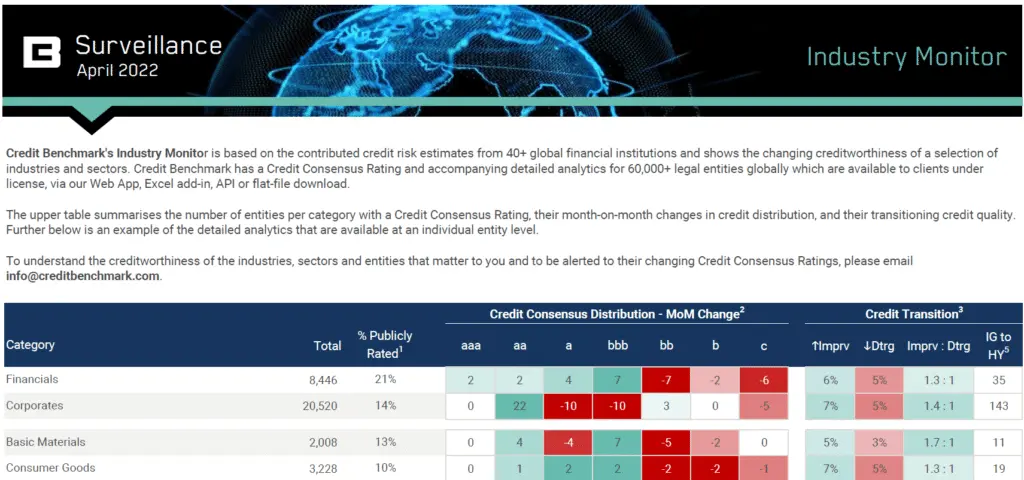
Corporates outperformed Financials by a slim margin, with an improvements to deteriorations ratio of 1.4:1, to Financials’ 1.3:1.
Among the industries, the best in class was Oil & Gas, with a ratio of 2.6 improvements for every deterioration. With oil and gas prices soaring as a result of the Russia-Ukraine conflict, companies are seeing record profits and a resultant healthy credit risk performance. Basic Materials followed by a distance, with a ratio of 1.7:1, with Healthcare close behind at 1.5:1 improvements to deteriorations. The rest of the industries maintained slim positive ratios of 1.3:1 or lower, with Technology and Utilities showing the comparatively lowest ratios, at 1.2:1 and 1.1:1 respectively.
The strong performance from Oil & Gas was evident at the sector level, with all three regions showing a heavily weighted bias towards improvement. US Oil & Gas led the pack at 3.8:1 improvements to deteriorations, followed by Canadian Oil & Gas at 3:1, and close behind was UK Oil & Gas at 2.9:1. US Corporates overall reflected this positive bias, with a ratio of 2.1:1, while UK Corporates had a weaker ratio at 1.1:1.
In the update, you will find:
- Credit Consensus Distribution Changes: The net increase or decrease of entities in the given rating category since the last update.
- Credit Transition: Assesses the month-over-month observation-level net downgrades or upgrades, shown as a percentage of the total number of entities within each category.
- Ratio: Ratio of Improvements and Deteriorations in each category since last update, calculated as Improvements : Deteriorations.
- IG to HY Migration: The number of companies which have migrated from investment-grade to high-yield since the last update (known as Fallen Angels).
Credit Benchmark will continue to provide regular reports on these migration rates. If you have any questions about the contents of this update, please get in touch.