Executive Summary
Key Findings
- Default rates for US and UK Speculative Grade bonds are expected to rise each quarter to a peak in Q3 2024 (S&P project Q2 2024).
- For US Speculative Grade, consensus credit data implies a mid-2024 median default rate of 4.4% (S&P projection recently revised up to 4.5% from current level of 3.2%)1.
- For UK Speculative Grade the median projection from consensus data is 3.65%, from an assumed current level of 2.8%.
- S&P forecast for Europe is 3.75% by Q2 2024, up from 3% in June 20232.
- US default rate distribution: 1 in 3 chance of default rate > 6%, and 20% chance of > 7% Small (sub-5%) chance of reaching 9% or higher (NB this is significantly above the current S&P pessimistic scenario of 6.5%). There is an estimated 1 in 6 chance that the default rate drops below 4%, and a sub-5% chance that it drops below the S&P optimistic scenario of below 2%.
- UK default rate distribution: 40% probability of 4% to 5% range (similar to US). Maximum projected default rate <7% (lower than the US). Lower bound likely to be 3%.
J.P. Morgan CEO Jamie Dimon recently raised the specter of 7% US short rates in an interview on Bloomberg. This reflects the continued underlying pressures on inflation, and a more cautious outlook following some very mixed corporate results and rising interest rate costs. These factors have also prompted some upward revisions in corporate default risk projections from major agencies and banks.
S&P will report provisional Q3 default rates soon. The June 2023 default rate for US speculative grade (“High Yield”) corporate bonds is 3.2%[3] (+74Bps from 2.5% in March) – this is in line with the long run median rate from 1991-2022. S&P now project this to hit 4.5% (revised up from 4.25%) by Q2 2024[4],[5]. They also project a pessimistic scenario where defaults hit 6.5% (revised up from 6.25%), and an optimistic scenario where they drop back to 2% (revised up from 1.75%.)
The equivalent consensus-based estimates reported here are derived from the Deterioration/Improvement Ratio (“DIR”) – a metric based on monthly credit risk estimates from 40+ banks globally covering thousands of issuers across a wide range of sectors. A DIR of 1 means that deteriorations and improvements are in balance. The median DIR is close to 1 over the period 2017-23, but the upper quartile has reached 2 at some points in the credit cycle and was close to 8 during the Covid crisis.
The following chart shows the distribution of the US Corporate DIRs for Q2 and Q3 (Q3 provisional).
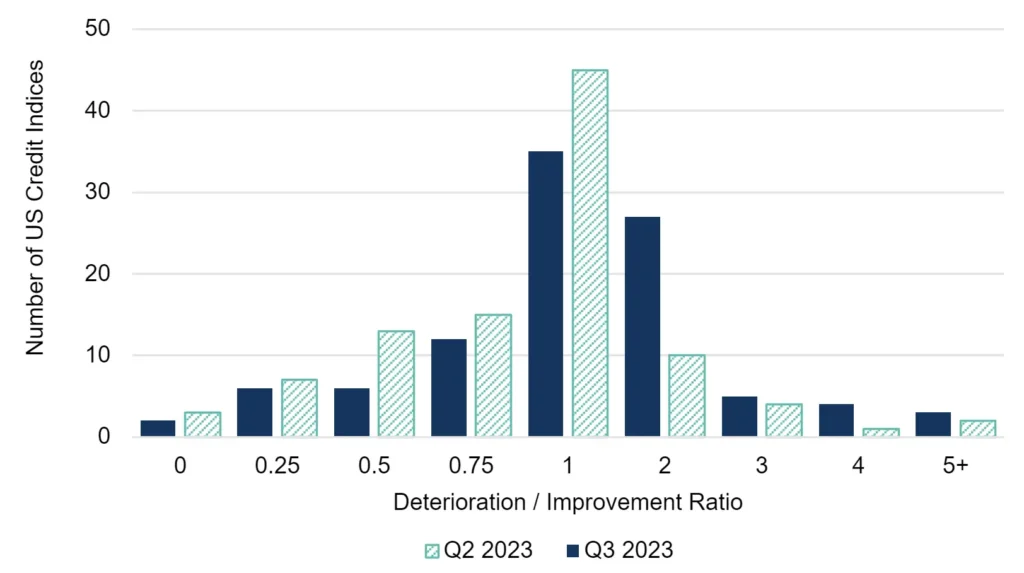
Source: Credit Benchmark
The DIR metric is very similar to the S&P Downgrade/Upgrade Ratio (“DUR”), which is closely correlated with aggregate default rates. However, the consensus-based DIR is more granular than the DUR because it captures deteriorations in credit quality that may precede a full notch downgrade, and it is based on a larger borrower universe.
US Projections
Based on a universe of more than 100 US Industry and Sector indices (covering around 5,000 Corporate borrowers) the chart below shows the proportion of those consensus credit indices with a DIR greater than 1 since 2017. This measure has a range of 0% (all DIRs below 1) to 100% (all DIRs above 1, i.e., all indices have more deteriorations than improvements across their constituents). The chart also shows the 12-month rolling default rate for S&P US Speculative Grade Corporate Bonds.
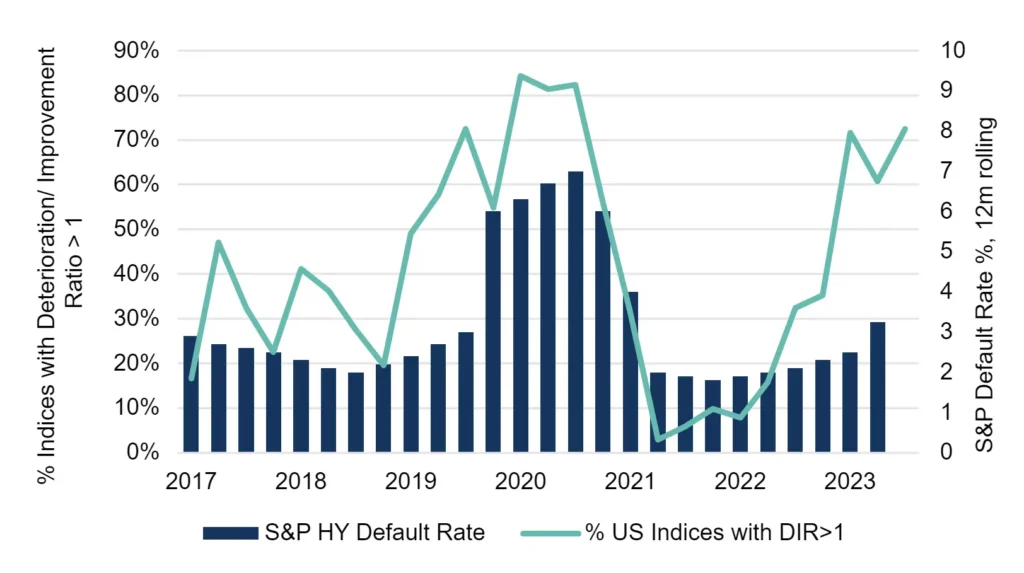
Sources: Credit Benchmark, Standard & Poor’s Inc[6].
The US DIR continues to rise steeply, consistent with the upward revisions from S&P. This metric currently stands at around 70%. The DIR series is positively correlated with the S&P default rate, although the various series diverge in some quarters[7]. Combining “signal” (the DIR / S&P correlation) with “noise” (the divergences) it is possible to simulate probable paths for US Speculative Grade / High Yield (“HY”) default rates out to Q3 2024. The chart below shows the simulation results.
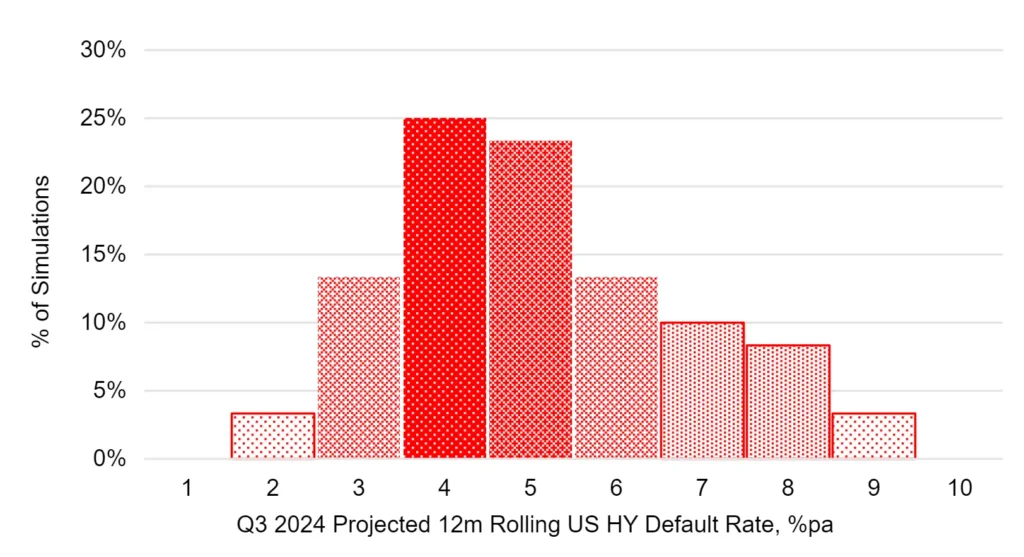
Sources: Credit Benchmark
The most likely outcome for US speculative grade default rates is in the 4%-5% range, but a significant number of simulations are above 5%. Nearly half of all simulations are in these two categories. There is a 1 in 3 chance that the default rate is above 6%, a 20% chance of exceeding 7% and a small possibility (3%) – of reaching 9% or higher. This means that the upper tail of the simulation distribution is significantly above the current S&P pessimistic scenario of 6.5%. However, there is also a 1 in 6 chance that the default rate is less than 4%, and a 3% chance that it is less than 2%, aligned with the S&P optimistic scenario.
UK Projections
Compared with the US, actual default data for the UK is sparse due to a smaller number of rated issuers; and as a result, the historic default rate is more volatile[8]. The DIR universe is much larger, so it is a more robust metric for forecasting. The UK DIR is plotted for here for 100 UK indices (covering more than 5,000 borrowers), in addition to US DIR and US HY Default Rate data.
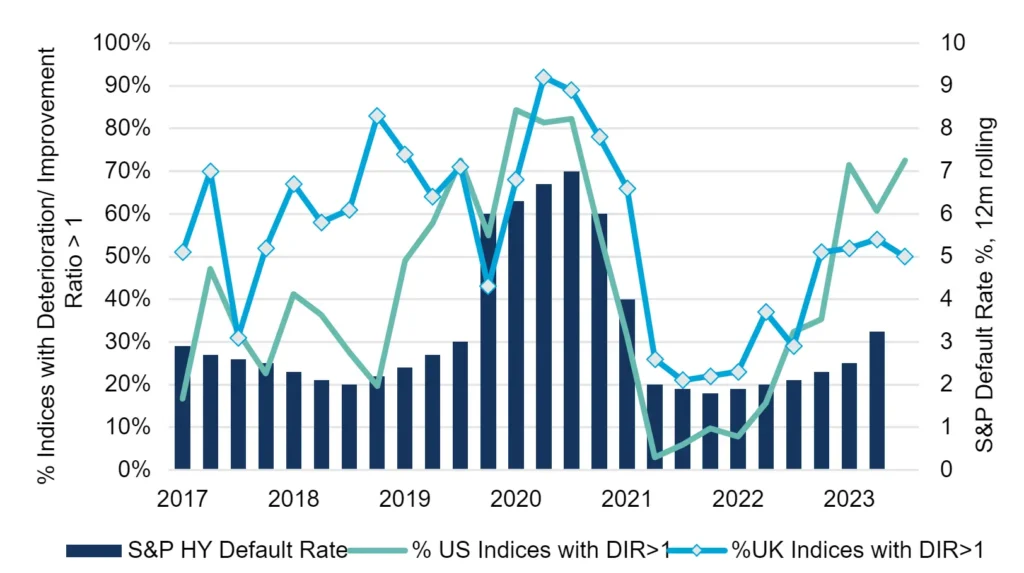
Sources: Credit Benchmark, Standard & Poor’s Inc[9].
The UK DIR series is more synchronized with the US series during and after Covid; but in recent months the two have diverged. Both show an increase during 2022, but the rate of increase in the UK slowed in 2023 and the latest data shows a decline.
The chart below shows the range of possible default risk outcomes for the UK, with a narrower range reflecting the recent downward trend in UK DIR; this increases the chances of a lower peak in default rates compared with the US.
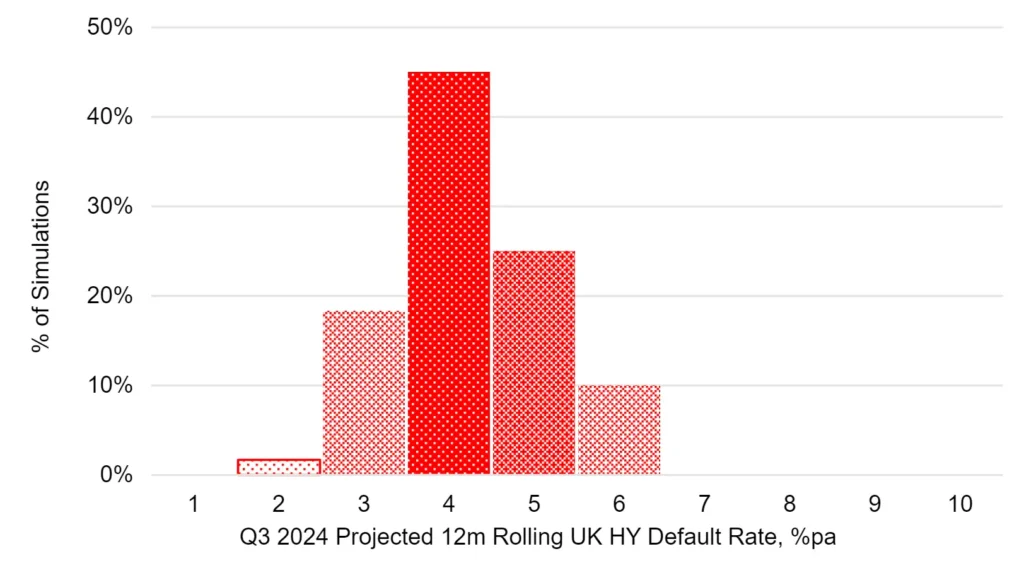
Sources: Credit Benchmark
The most likely outcome, with a more than 40% probability, is in the same 4% to 5% range as the US. However, the highest projected default rates are in the 6%-7% range with a 10% probability – lower than the US. Although there is a very small probability of a 2% default rate in the UK, 3% looks like a more realistic lower bound.
Conclusion
Various monetary support measures during and after Covid have held post-Covid default rates below the long run median. But interest rates have increased to levels that few predicted, and they look set to increase significantly above their long run median rates. Monetary tightening has had less immediate impact on economic growth than many feared, but the next twelve months are expected to be more difficult. Credit conditions are likely to stay tight, costs are likely to continue rising and growth is likely to slow across the G20 economies. Recent trends in consensus data suggest that corporate default rates will rise, but the trends are not clear cut. The UK, for example, shows some recent improvements in the DIR ratio and if these continue there is scope to revise the 2024 default rate down. The US DIR is on a much steeper trajectory so there is less scope for downward revisions.
Download
Credit Benchmark can produce bespoke and confidential portfolio credit reports on request. To download this full whitepaper, including appendix with sample portfolio credit report on United States High Yield Corporates, please complete your details below:
[1] The Ratings View: Sep 7, 2023 | S&P Global Ratings (spglobal.com)
[2] Default, Transition, and Recovery: The European Speculative-Grade Corporate Default Rate Could Rise To 3.75% By June 2024 | S&P Global Ratings (spglobal.com)
[3] Default, Transition, and Recovery: Quarterly Defaults Reach Highest Level Since 2020 | S&P Global Ratings (spglobal.com)
[4] 101585931.pdf (spglobal.com), The Ratings View: Sep 7, 2023 | S&P Global Ratings (spglobal.com)
[5] Default, Transition, and Recovery: Growing Strains Will Push The U.S. Speculative-Grade Corporate Default Rate To 4.25% By March 2024 | S&P Global Ratings (spglobal.com), The Ratings View: Sep 7, 2023 | S&P Global Ratings (spglobal.com
[6] S&P 2022 Default and Transition Study for US Bonds; additional data from S&P quarterly press releases.
[7] The rate of growth of the DIR metrics is likely to slow, since it is very rare for ALL indices to be deteriorating simultaneously.
[8] UK Default, Transition, and Recovery: 2022 United Kingdom Corporate Default And Rating Transition Study | S&P Global Ratings (spglobal.com)
[9] S&P 2022 Default and Transition Study for US Bonds; additional data from S&P quarterly press releases.