
Credit risk is on the move, and not where you’d expect. Analysis of UK regional default risk shows sharp divergence across regions, sectors, and credit categories post-Covid.
Credit Benchmark’s UK Default Risk Regional Trends analysis reveals powerful regional and sectoral fault lines in default risk across the country. Drawn from forward-looking consensus credit data on over 11,000 corporates, financial institutions, and funds, the analysis highlights where pressures are building fastest — and where resilience remains. From post-Covid rebounds and interest rate aftershocks to region-specific slowdowns, the data maps a shifting economic landscape with clear indicators of where credit events are most likely to emerge next.
Key Takeaways
- North West leads in risk — London stays safest. Default probabilities are highest in the North West, while London, Scotland, and Northern Ireland remain the most stable.
- Wales flags trouble: most vulnerable borrowers concentrated here. With nearly 3% of entities in the critical ‘c’ category, Wales shows the highest concentration of names most likely to default.
- Financials under pressure — sharpest risk surges in Wales and Scotland. Financial institutions in these regions have seen the steepest 12-month deterioration, pointing to deeper structural stress.
- High Yield borrowers driving the risk — but Investment Grade cracks are forming. While High Yield names continue to push risk levels higher, some Investment Grade segments, particularly in the South East and East of England, are starting to deteriorate.
- Regional shake-up reflects deeper shifts in the UK economy. Credit trends suggest lasting effects from Covid, Brexit, and evolving government policy — with clear winners and losers emerging.
- County-level hotspots reveal sector stress clusters. Heavy Construction in Essex, Industrial Transport in the North West, and Consumer sectors in Dorset and Gloucestershire all show high concentrations of default-prone borrowers.
Credit Benchmark’s Credit Consensus data, based on the credit risk views of 40+ major banks, gives unprecedented insight into UK default risk with 2,012 indices covering more than 11,171[1] UK corporates, financials and funds, spanning 12 regions and 134 sectors, with history available from 2018.
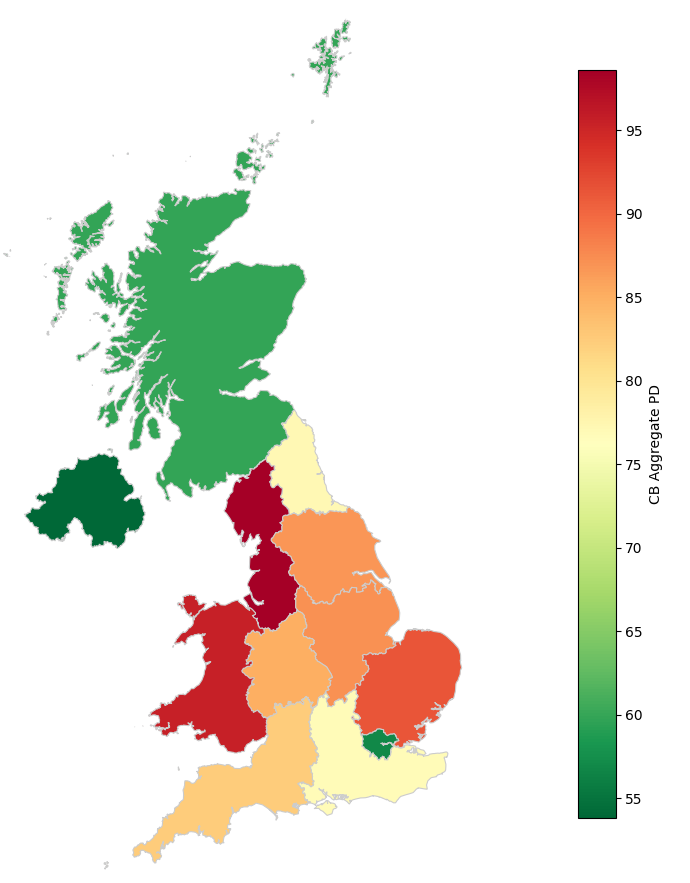
The below map shows the UK regions by average 1-year ahead default risk. North West is the highest, London, Scotland and Northern Ireland are the lowest.
UK Regional Heat Map - By Aggregate Probability of Default (PD)
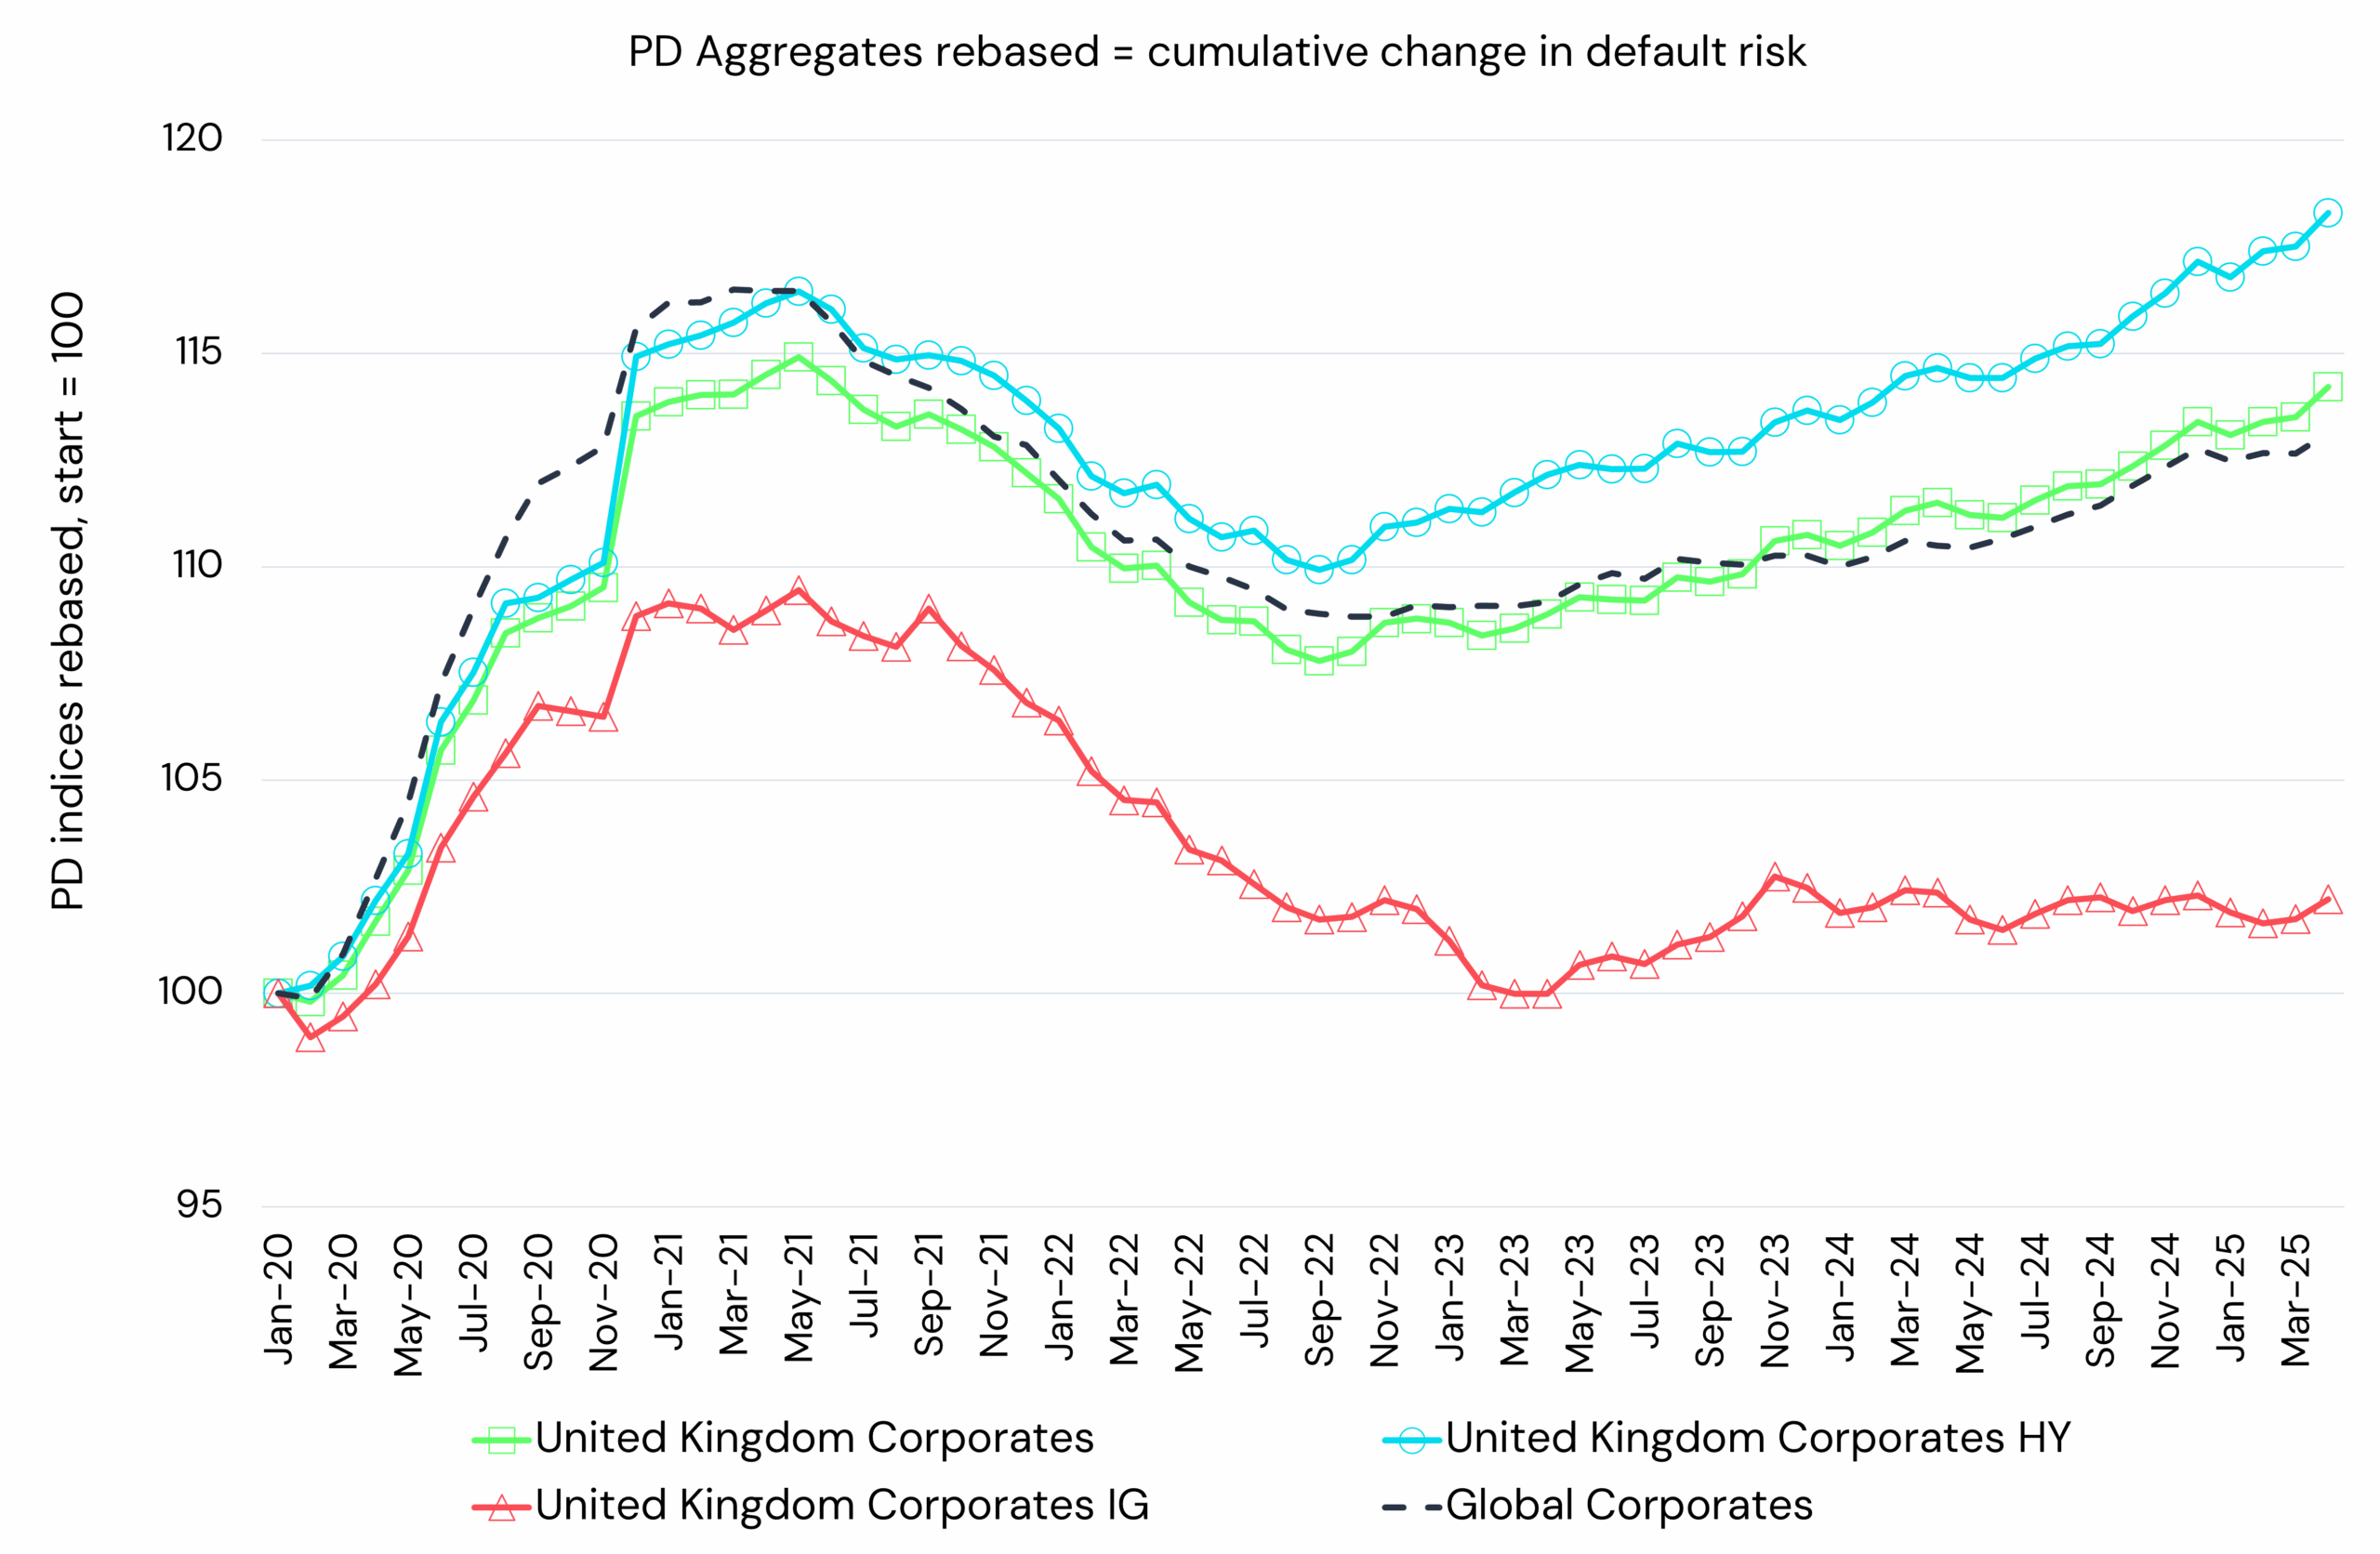
The following charts show 1) recent trends for Corporates split into UK HY and UK IG, with Global Corporates for comparison and 2) the same for UK Financials.
Credit Trend: UK Corporates (High Yield & Investment Grade vs. Global Corporates)
Credit Trend: UK Financials (High Yield & Investment Grade vs. Global Financials)
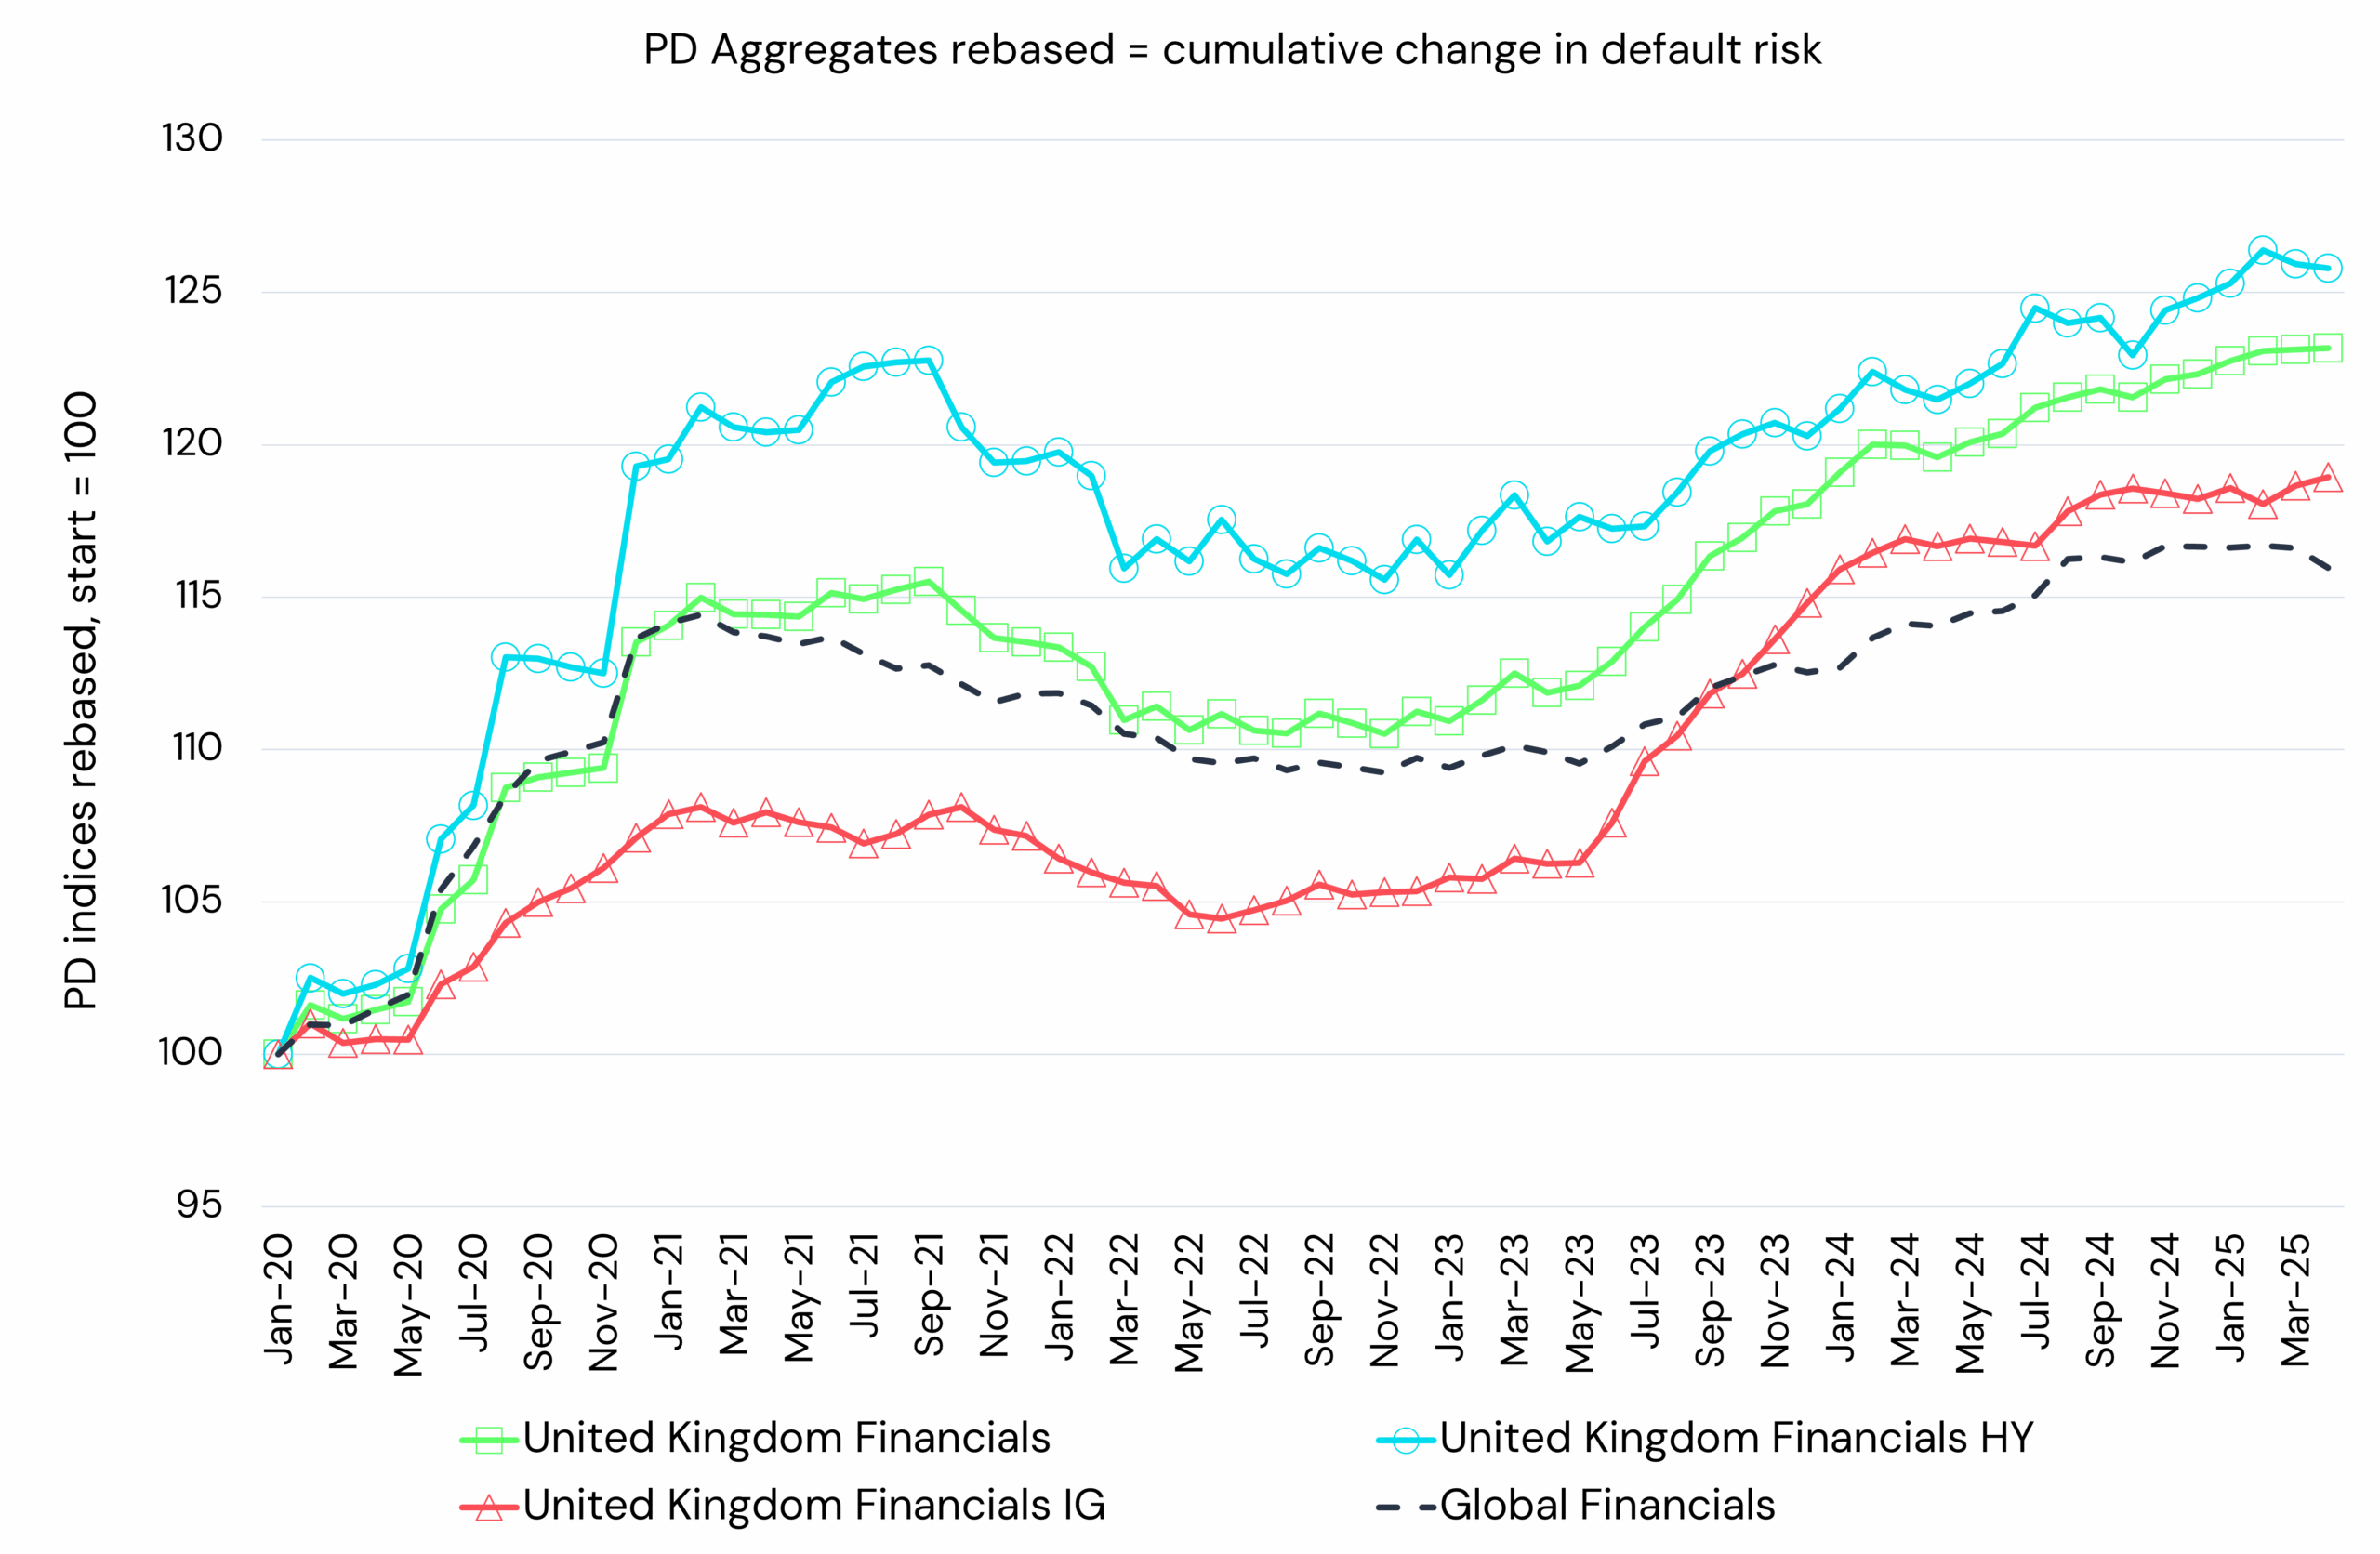
The UK Corporate aggregate has followed the Global aggregate very closely. Following the Covid-driven waves of downgrades and upgrades, overall Corporate risk has risen by about 5% since 2022. This has been driven by rising probabilities of default for High Yield borrowers (up nearly 10%) in response to Ukraine and rising interest rates; Investment Grade risk has been stable over the same period. Global Financials show a similar pattern to Global Corporates, but UK Financials have deteriorated by an additional 5%. High Yield and Investment Grade Financials default risk has moved together over this period.
Regional Trends
The following chart shows combined Corporate and Financial default risk trends for the South East, South West, East of England and Yorkshire & Humberside [2].
Credit Trend: East of England vs. Yorkshire and the Humber vs. South West vs. South East
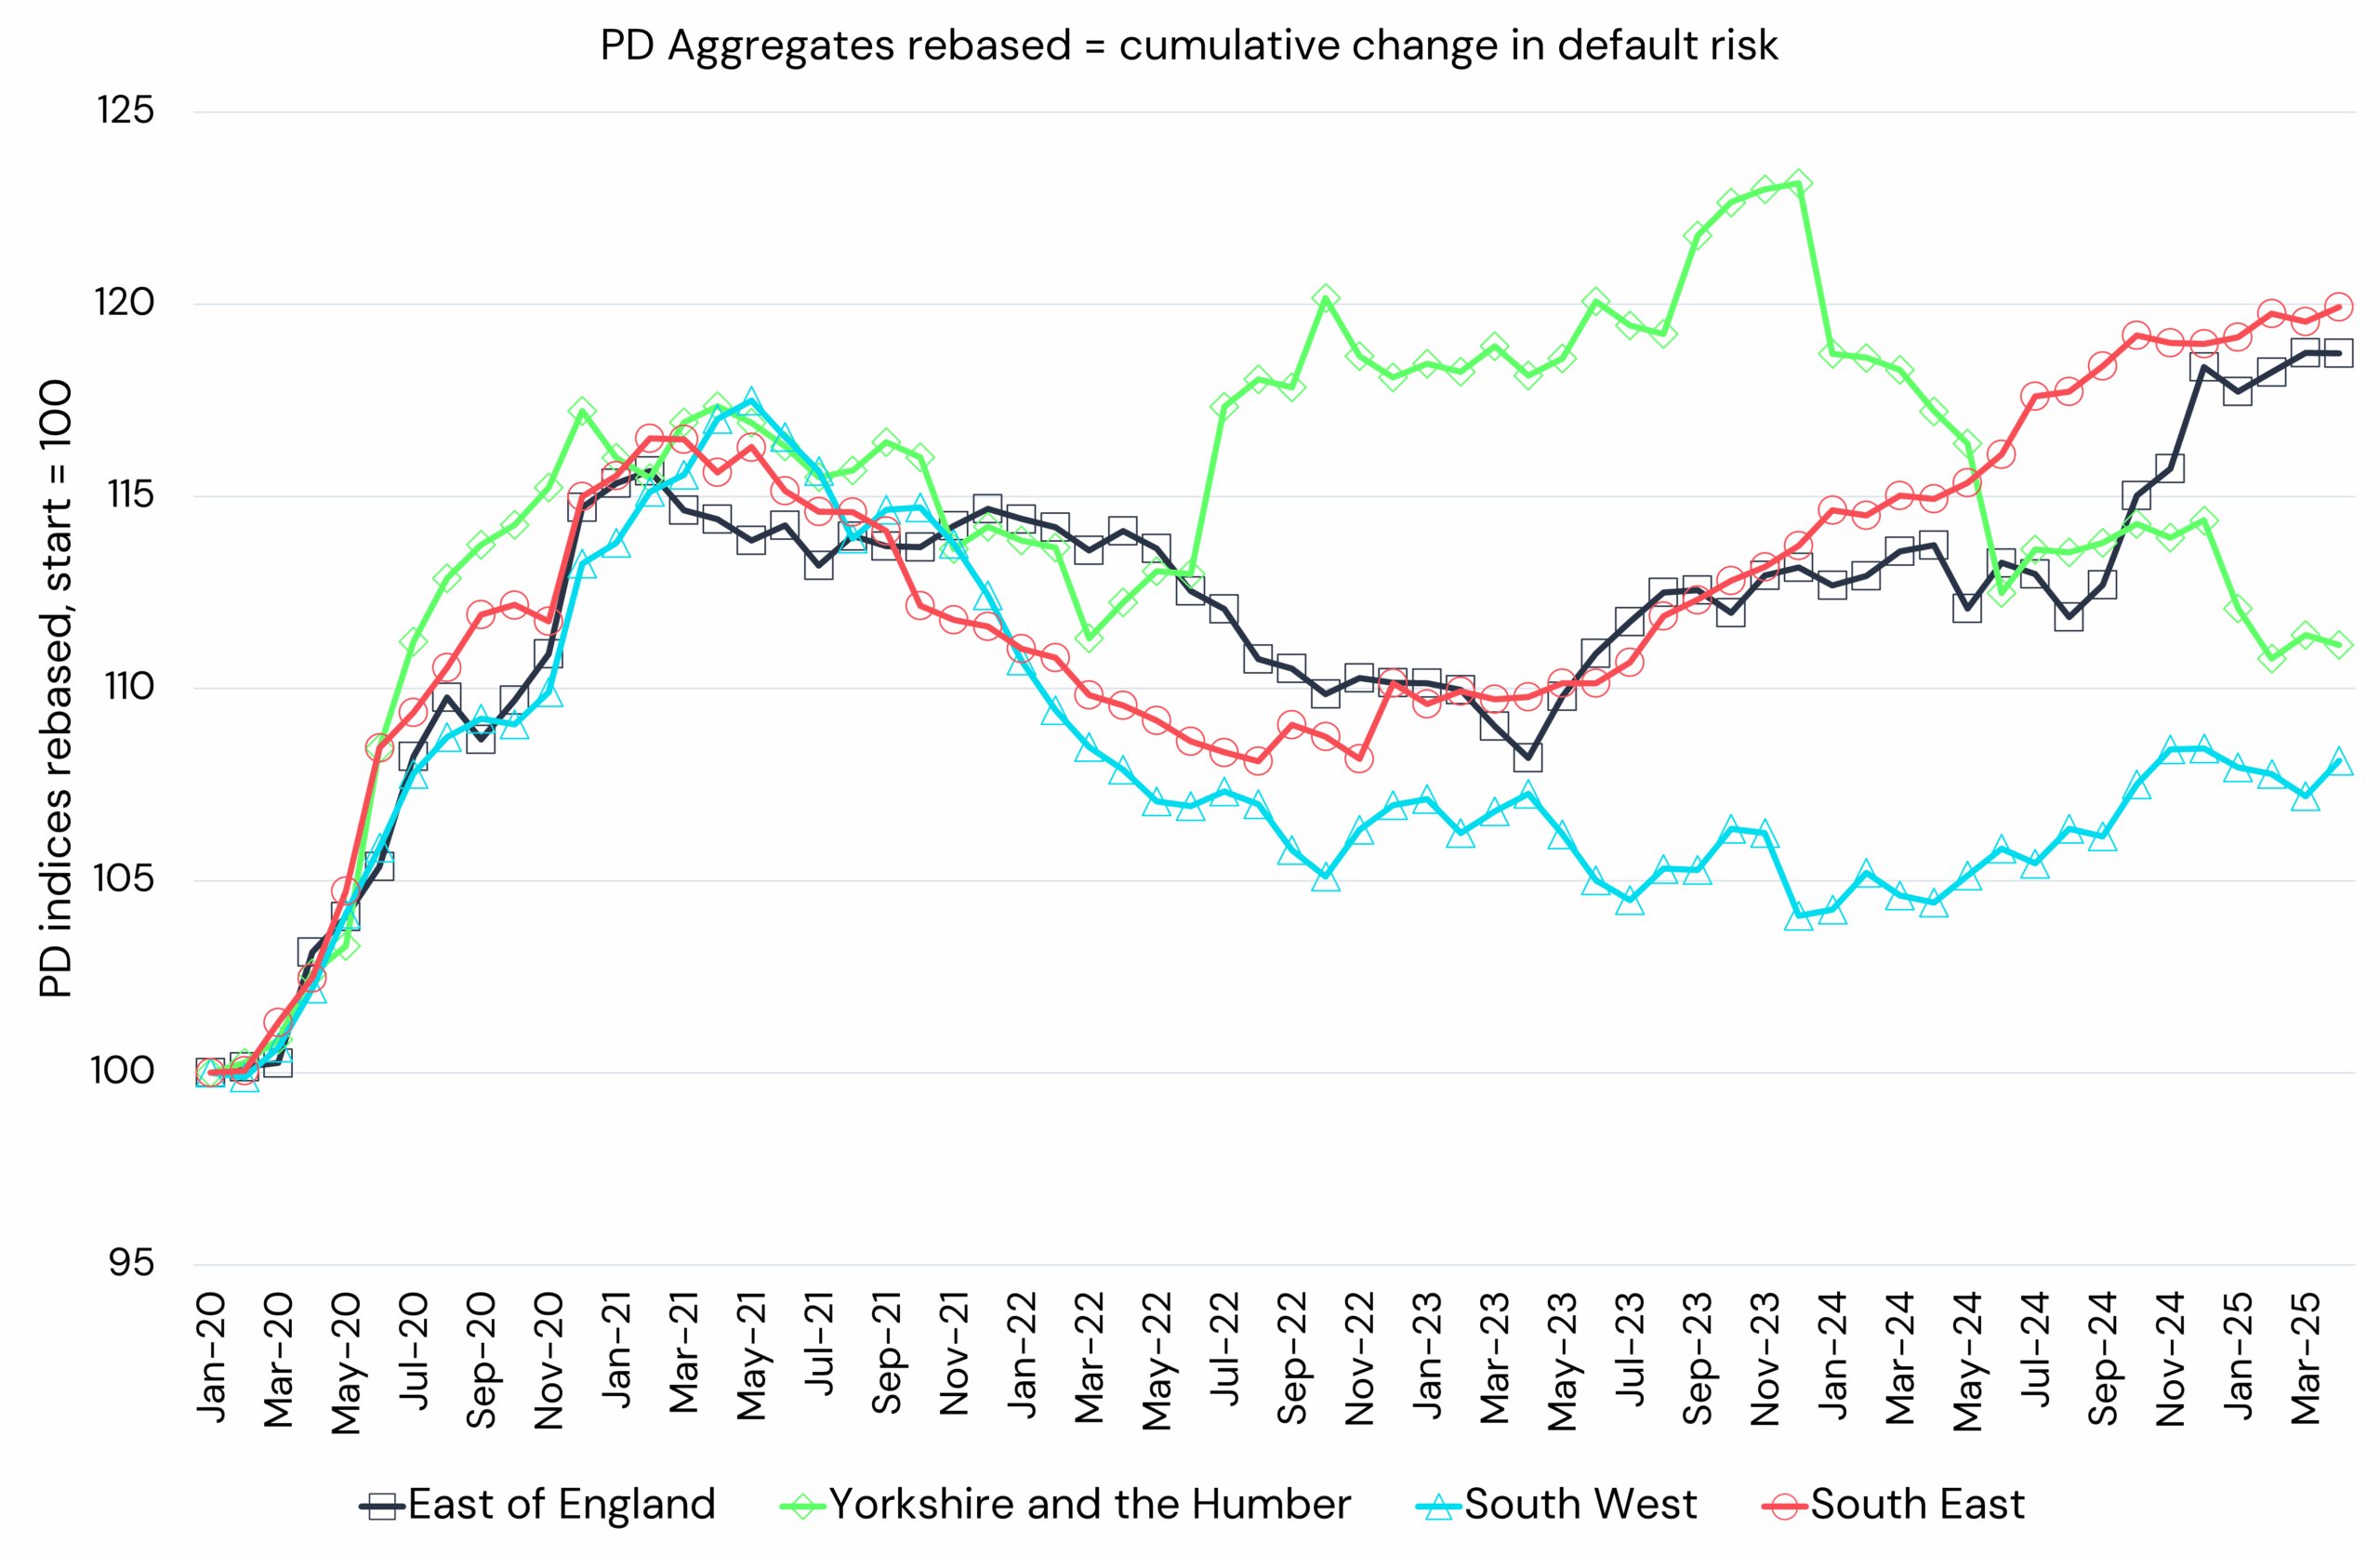
The South East follows a similar pattern to UK Corporates but with a higher deterioration since 2022. The East of England has tracked the South East (although it is more volatile) while the South West has maintained its post-Covid improvement. Yorkshire & Humberside has diverged since 2022, deteriorating to a peak of nearly 25% deterioration since Covid but recovering rapidly in the past 2 years.
The next chart shows West Midlands, East Midlands, North East and North West
Credit Trend: West Midlands vs. North West vs. East Midlands vs. North East
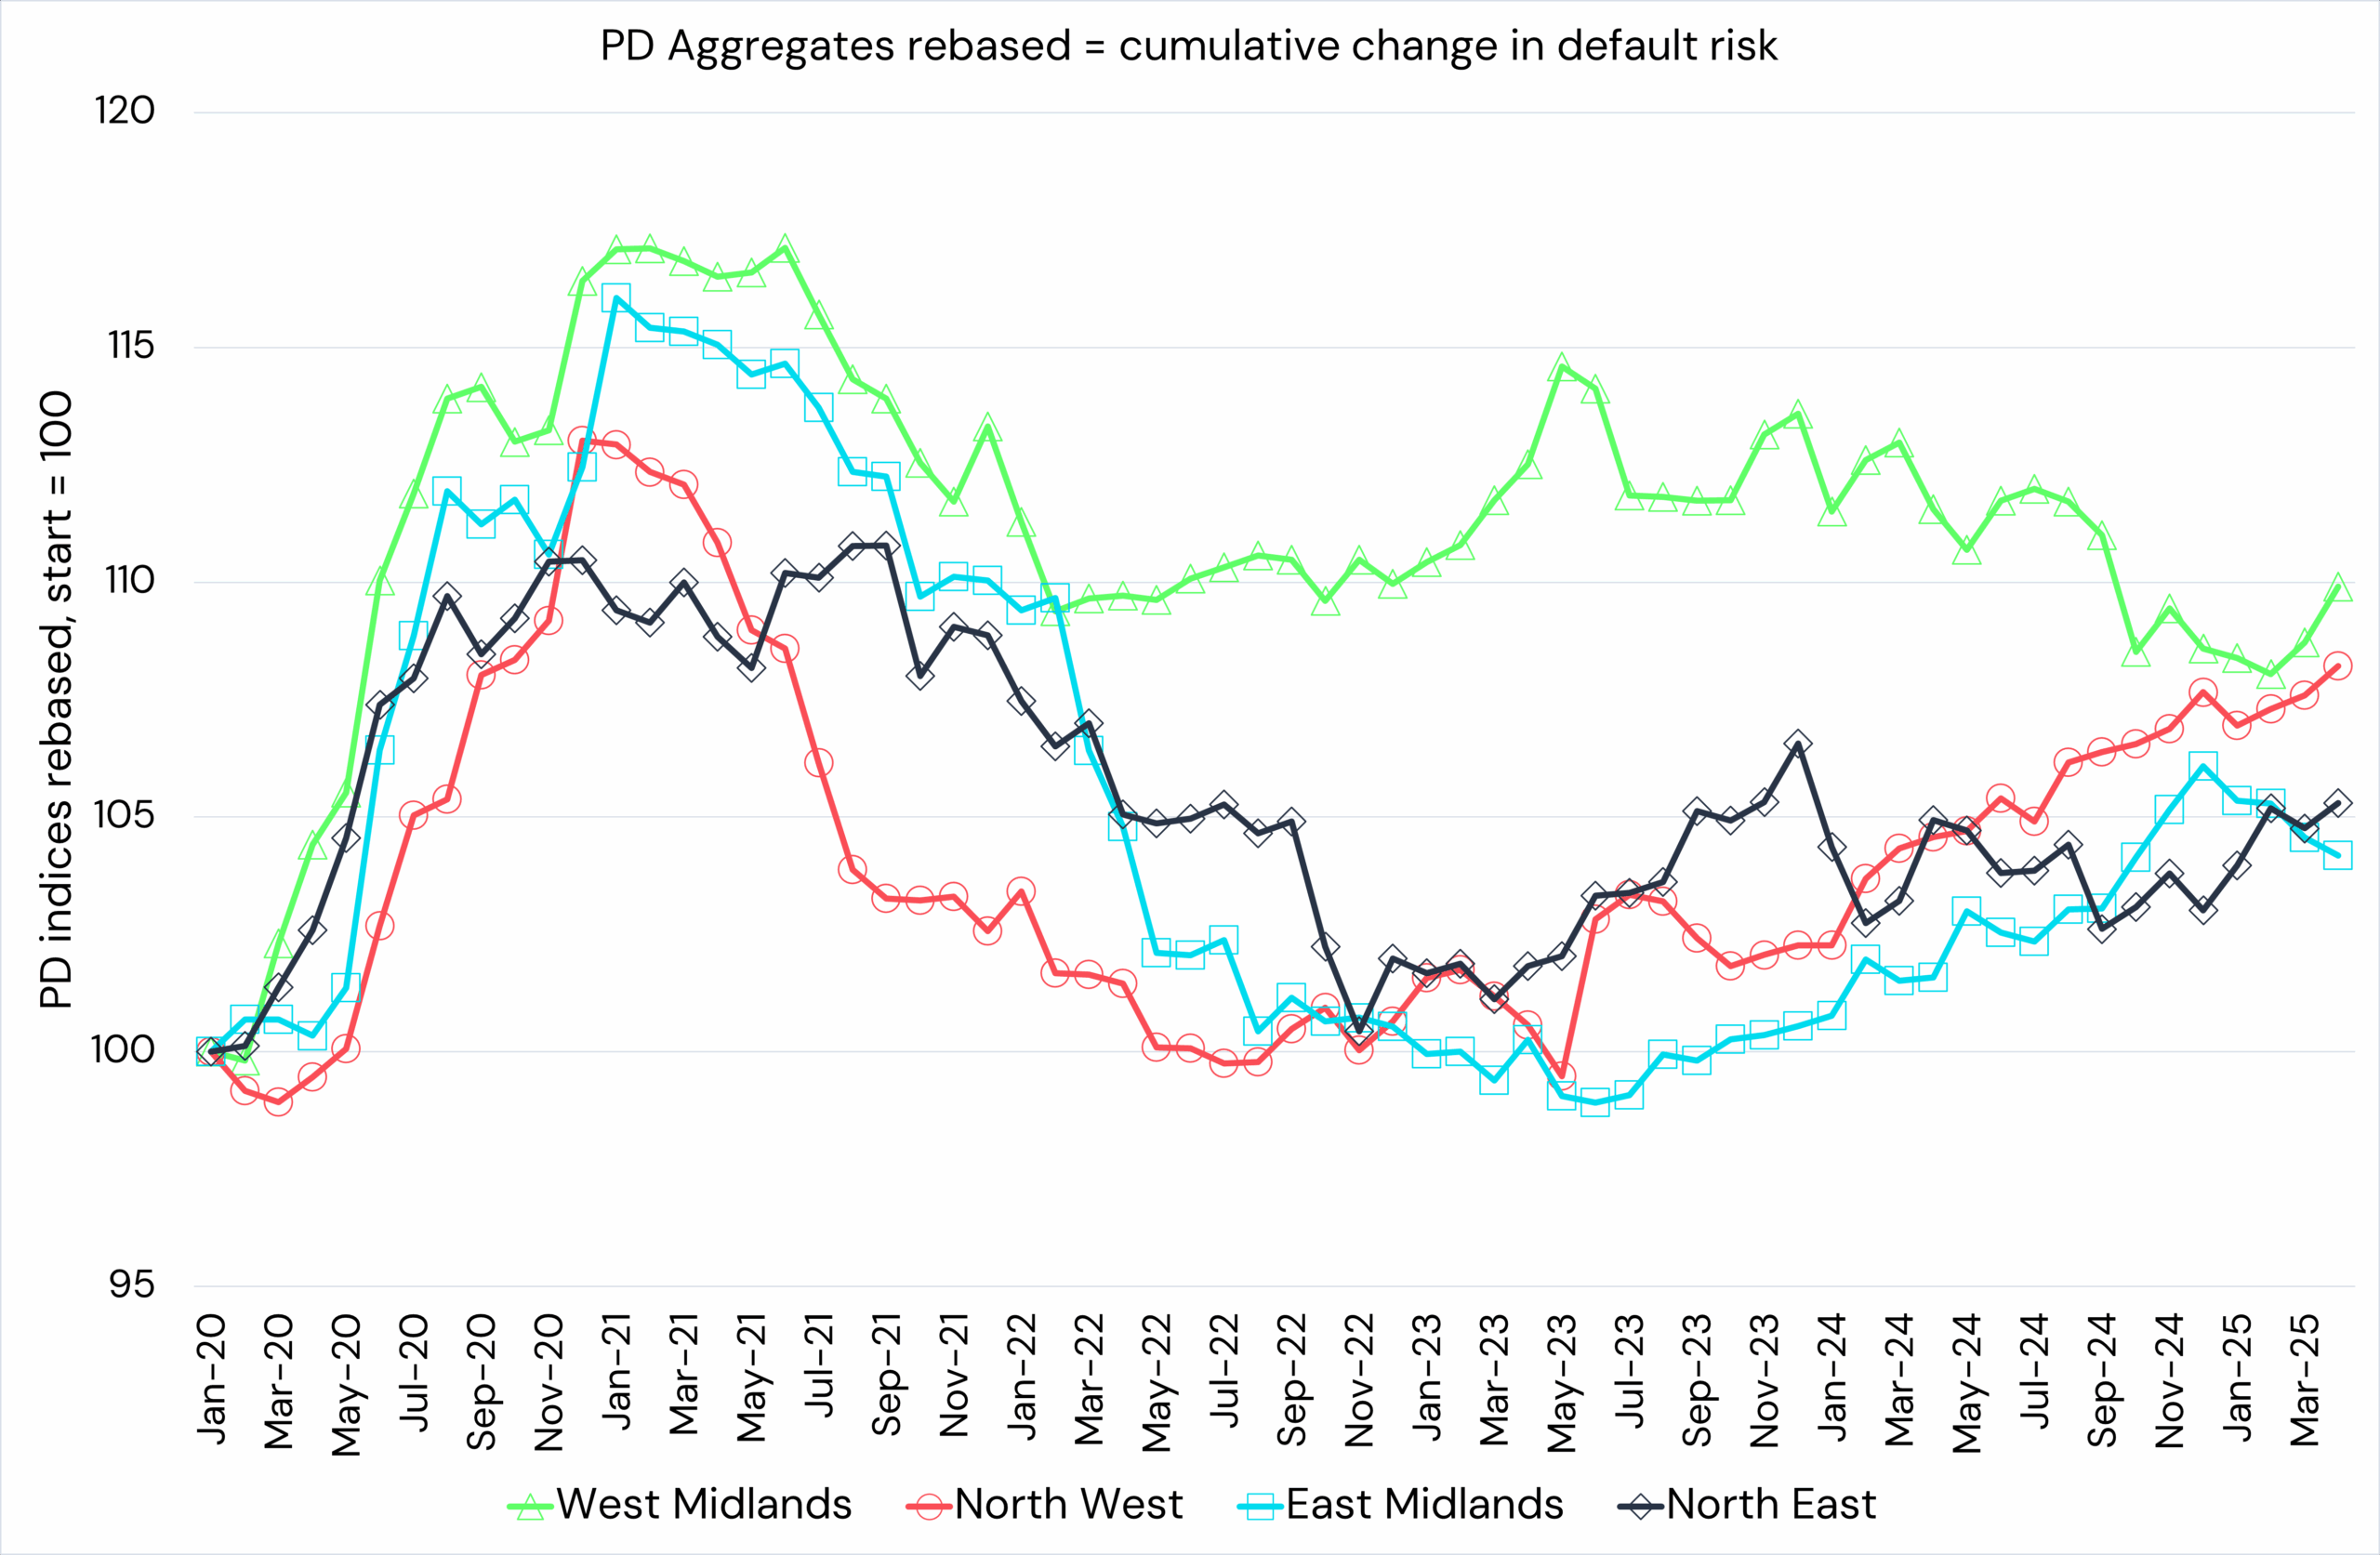
Further North, the North East and North West have tracked one another closely with a full post-Covid recovery and a modest 5% deterioration since the Ukraine invasion. East Midlands shows a similar pattern but West Midlands has diverged, with a stark deterioration and equally dramatic recovery to rejoin the other aggregates.
These trends suggest some restructuring of the UK economy following Covid, Brexit and the regional policies of a new Government, bringing some notable shifts in regional default risks.
Recent UK Regional Trends by Type and Credit Quality
The next chart shows Corporate vs. Financial regional PD changes over the past 12 months.
Corporates vs. Financial Default Risk % Change, 12M - By Region
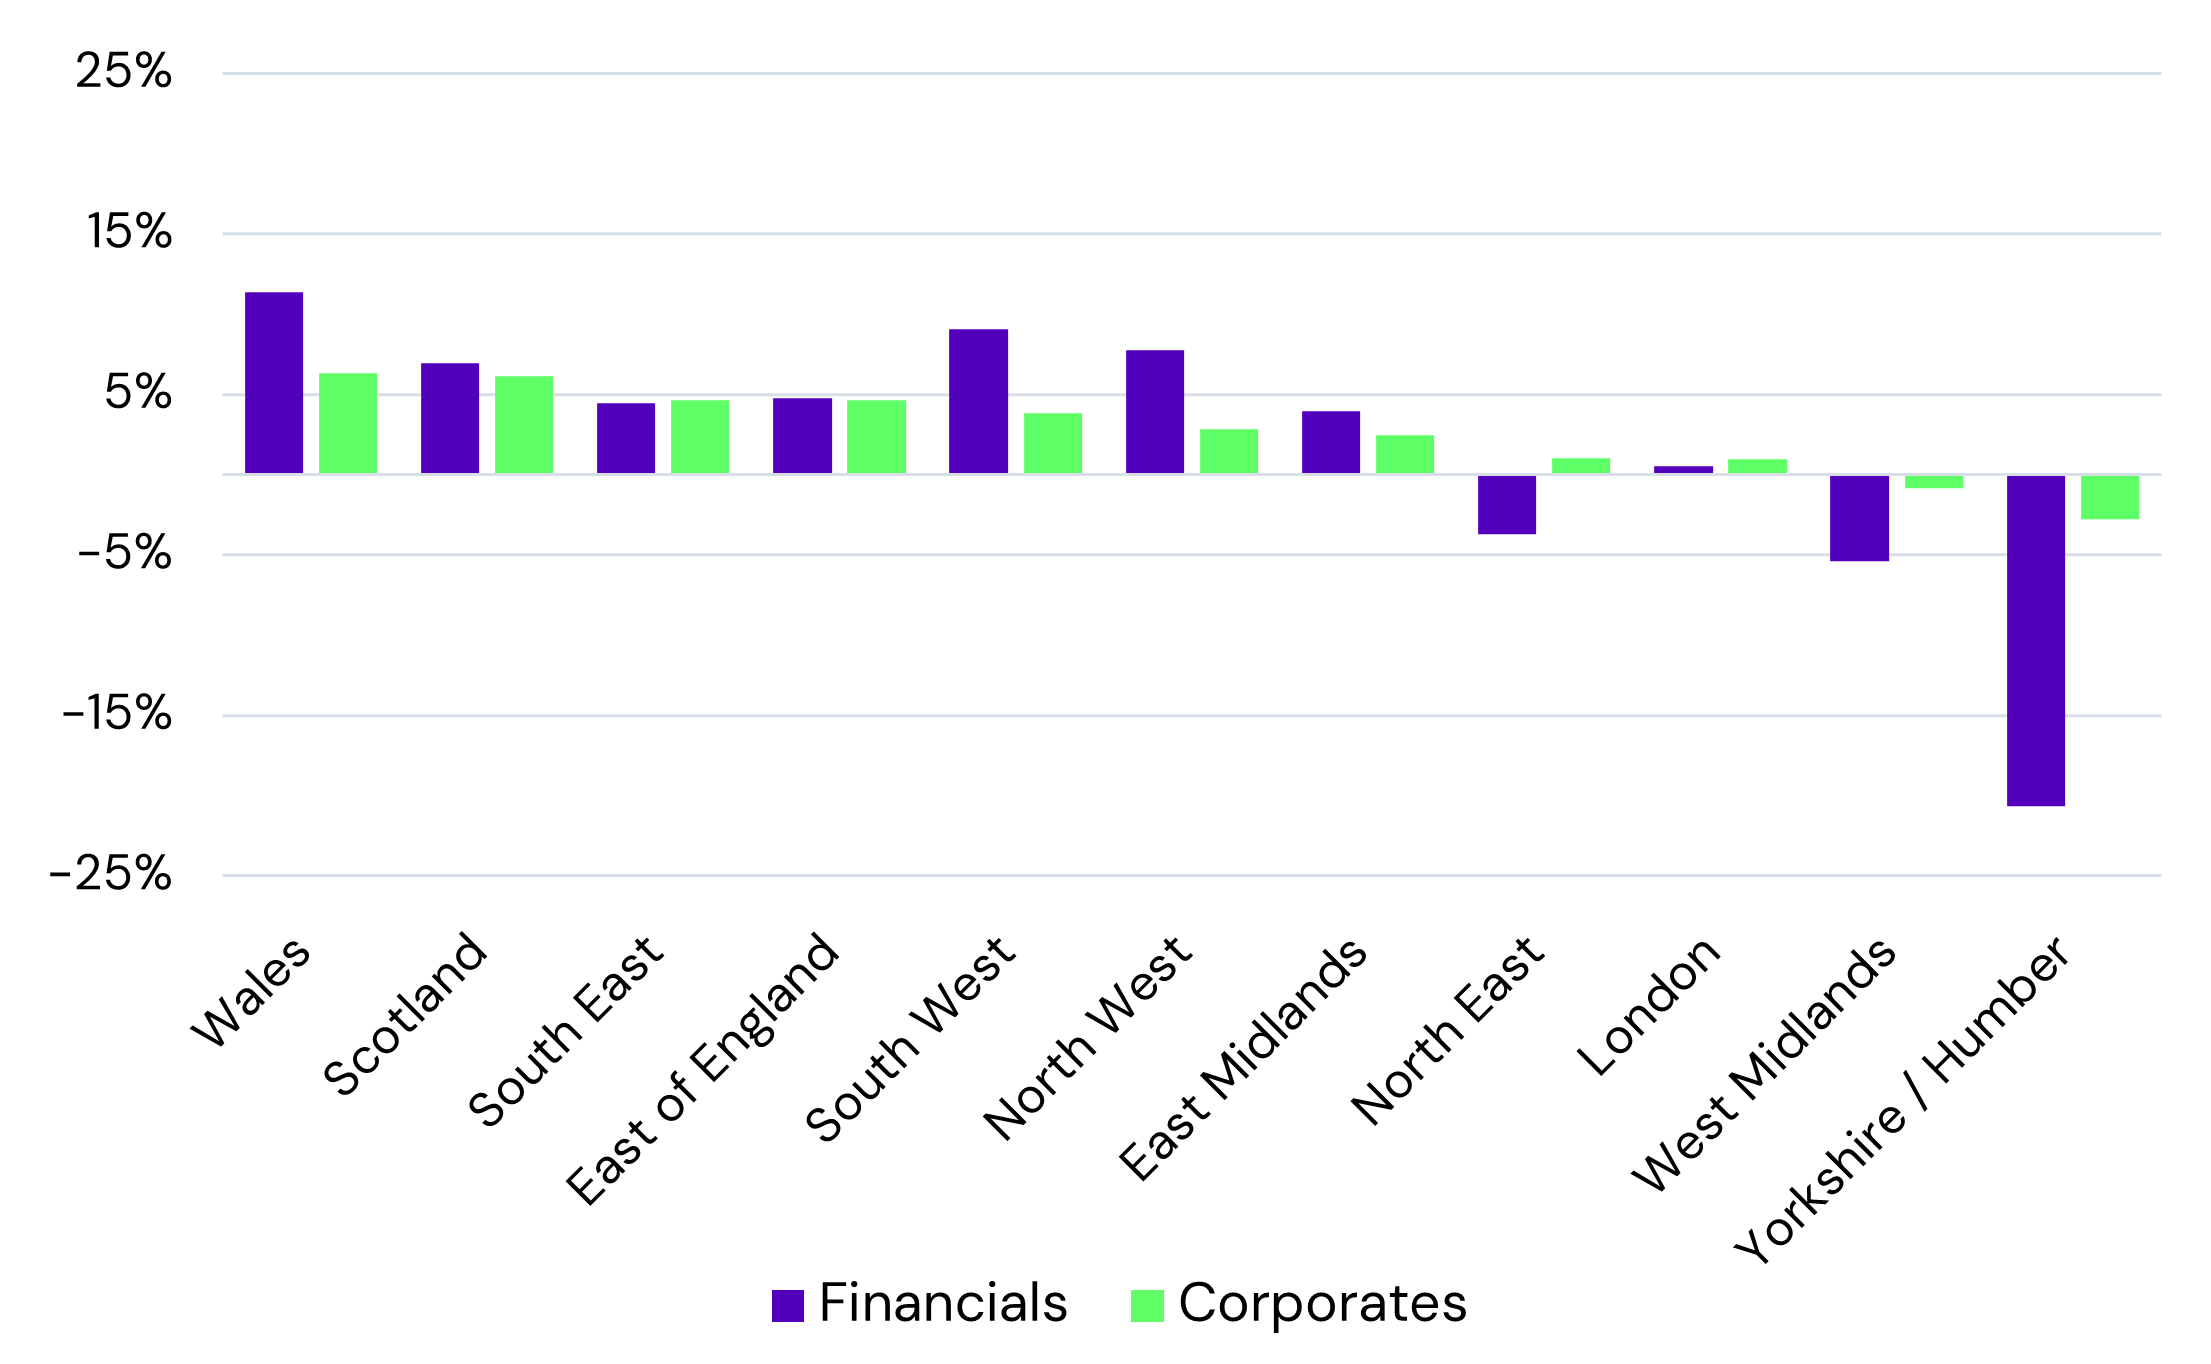
These are sorted by regional changes in Corporates, but the rank order of Financial changes is very similar. Financials show a wider divergence, with the largest deteriorations in Wales and Scotland. In England the South West and North West show the largest increase in risk, with the largest improvements in West Midlands and Yorkshire / Humber. The Corporate range is much narrower, but four of these six regions appear in the tails. In England, the South East and East of England show the largest Corporate credit risk rise. The North East is only region where the two borrower types move in opposite directions. This suggests that regional economic trends affect Corporates and Financials in similar ways, but Financials are more volatile.
Within Corporates, the 12m regional PD changes split by High Yield and Investment are plotted on the following chart.
Corporates High Yield vs. Investment Grade Default Risk % Change, 12M - By Region
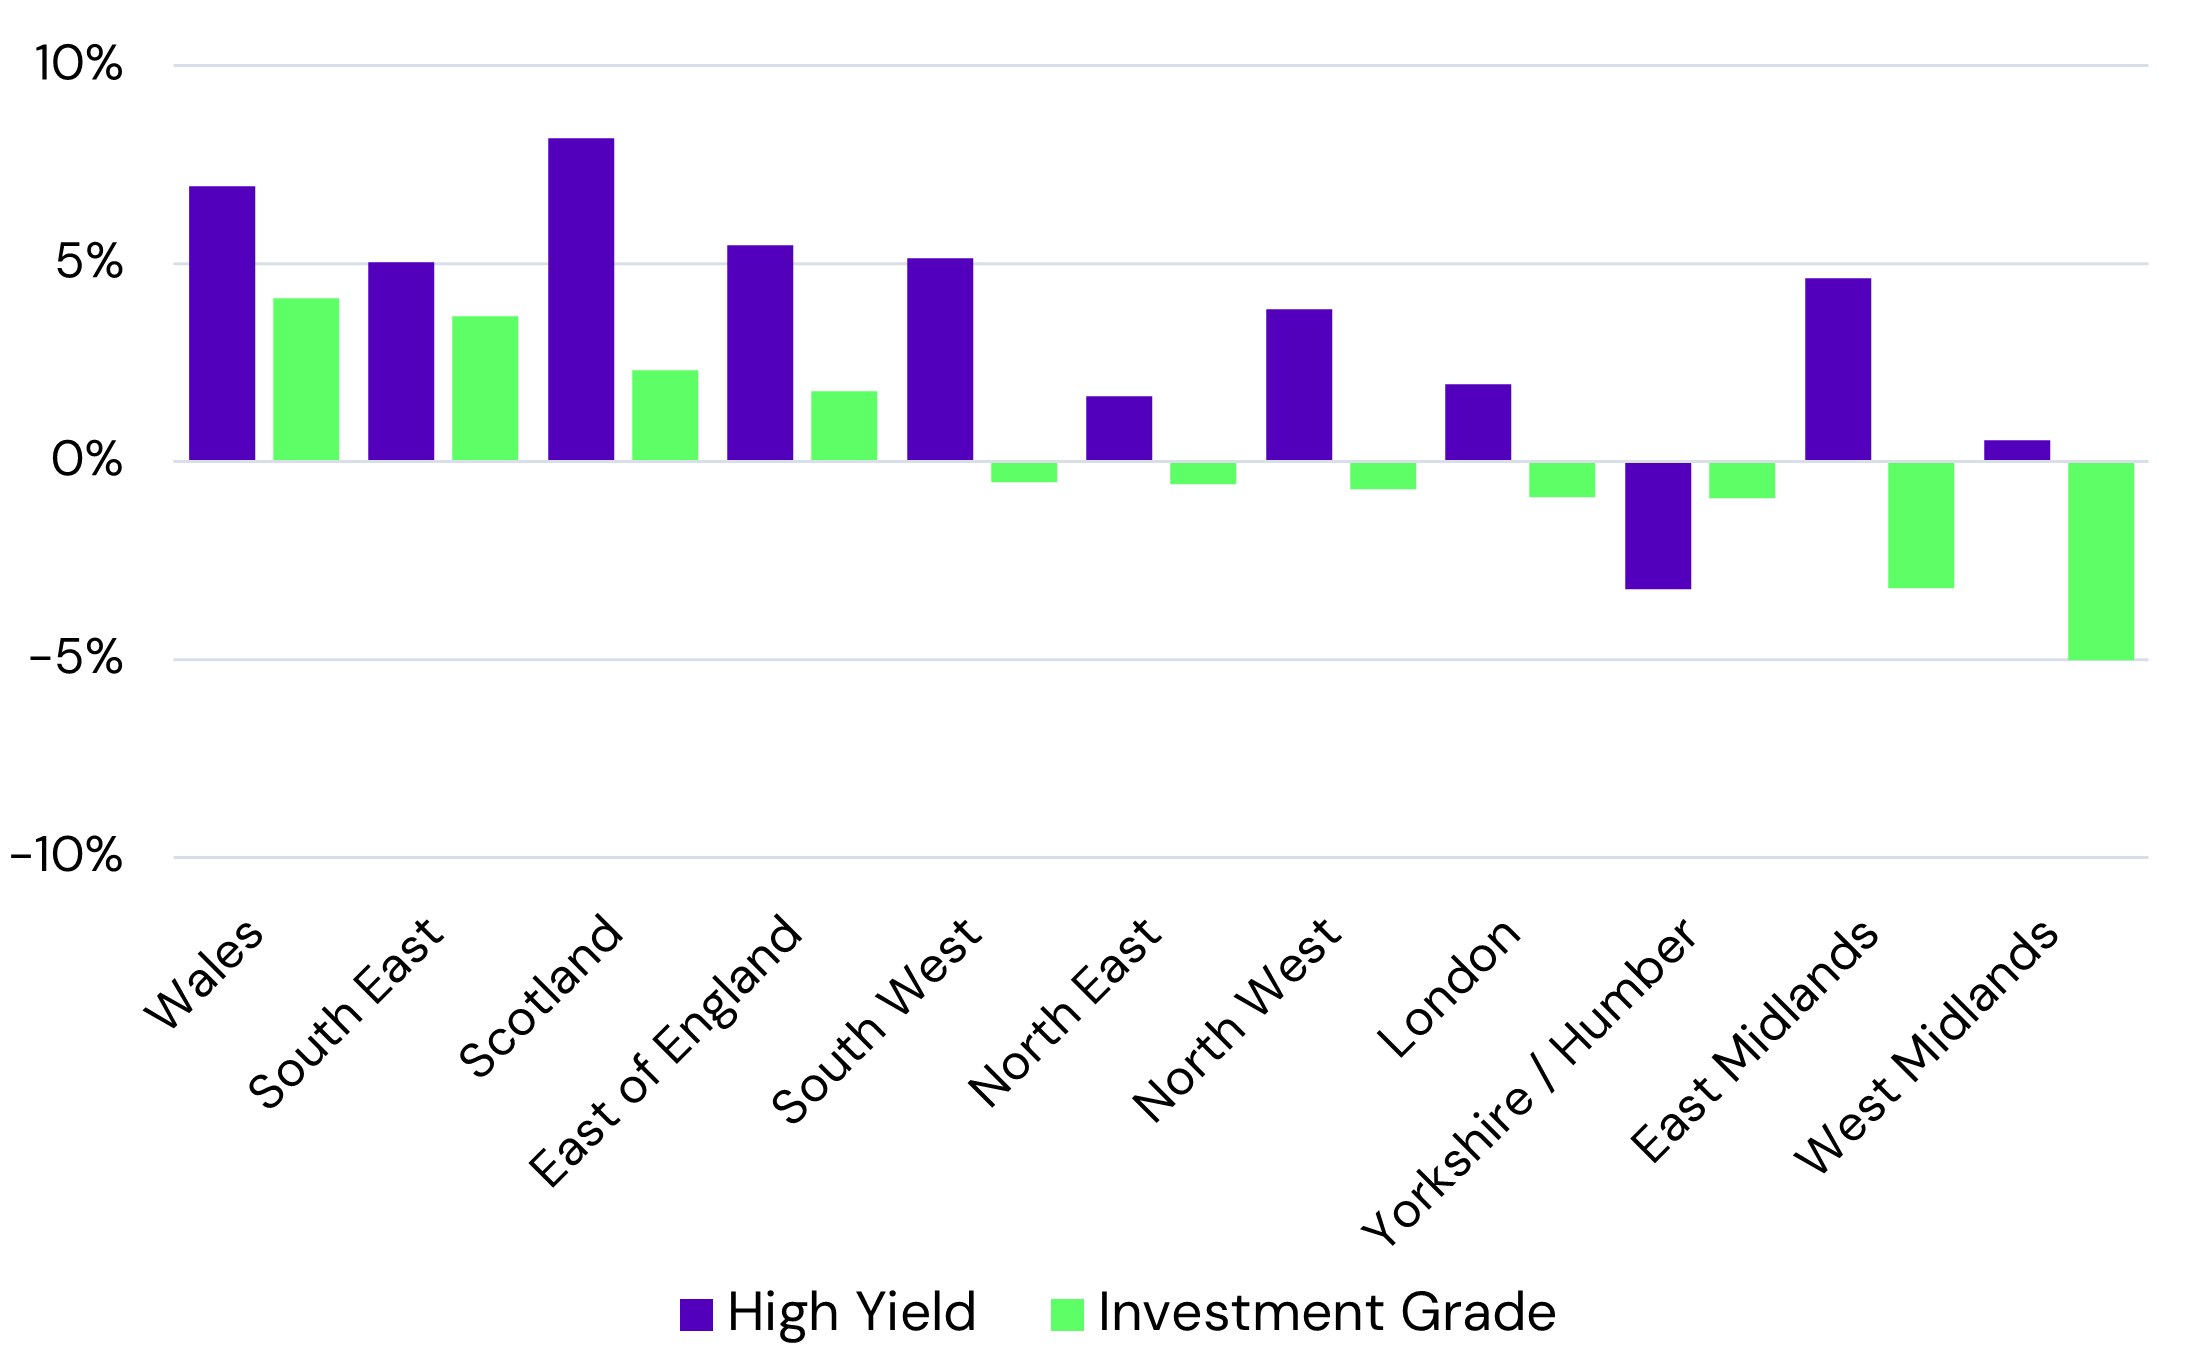
Sorted by Investment Grade, Wales and the South East show the largest deterioration with East and West Midlands showing improvements by a similar magnitude. Scotland is ranked 3rd but shows the largest increase in High Yield risk. East Midlands shows the largest divergence between Investment Grade and High Yield. Overall, 5 of the 11 regions show divergent directions between the two credit categories, with High Yield showing slightly more volatility. Combined with the previous charts, this suggests that regional economic effects may be offset by national or inter-nation credit trends which will be more industry-driven.
The table below shows credit profiles and average default risks by region, across Corporates and Financials, plus recent PD changes and borrower numbers.
Credit Profile Table: Corporates & Financials by Region
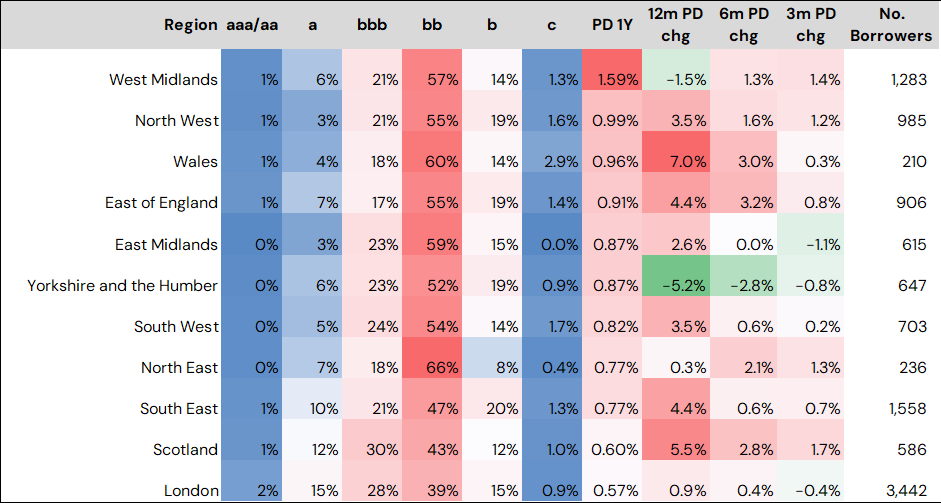
Average[3] default risks in every region are in the High Yield category, with the ‘bb’ category dominating, especially in the North East, Wales, and the East Midlands. West Midlands has the highest default risk, 60% above the North West, ranked 2nd. London and Scotland are the lowest, with the latter possibly reflecting a disproportionate impact of the UK’s 2nd largest capital city.
Wales has the highest proportion (2.9%) in the ‘c’ category, which is the source of most (60%+) of actual defaults. North West and South West are also high, with more than 1.5% in the ‘c’ category.
The PD changes show increasing risk in all regions over 12, 6 and 3 months except Yorkshire & Humber (all periods), West Midlands (12 months) and East Midlands (3 months). Wales, Scotland, South East and East of England show the largest increase over the past 12 months.
The table below shows the balance between Deteriorating and Improving Credit Consensus Ratings (Corporates and Financials combined) by region. This give some indication of future trends in default risks.
Net Downgrades % By Region
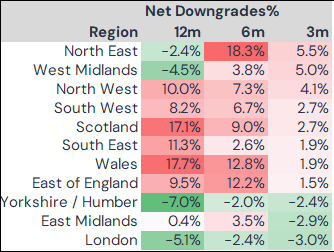
In recent months, the North East shows the highest bias towards rating downgrades (it also has the highest 6-month total) followed by West Midlands. Both are positive over 12 months so the downturn is recent. North West and South West are next highest and have been consistently biased to downgrades. South East, East of England, Scotland and Wales are also biased to downgrades over each period but previous high totals are easing. London and Yorkshire are improving over all periods and East Midlands has recently turned positive.
The final chart looks at counties as well as regions in sector detail. Sample sizes are generally smaller so the focus here is on 18[4] sectors with a high ‘c’ category measure, which indicates vulnerability to spikes in default rates. The ‘c’ category is typically the source of two-thirds of annual observed defaults and any borrower in the ‘c’ category has on average a 1-in-4 probability of defaulting in a typical year.
County Sectors with highest % in ‘c’ category (Elevated risk of defaults next 6-12 months)
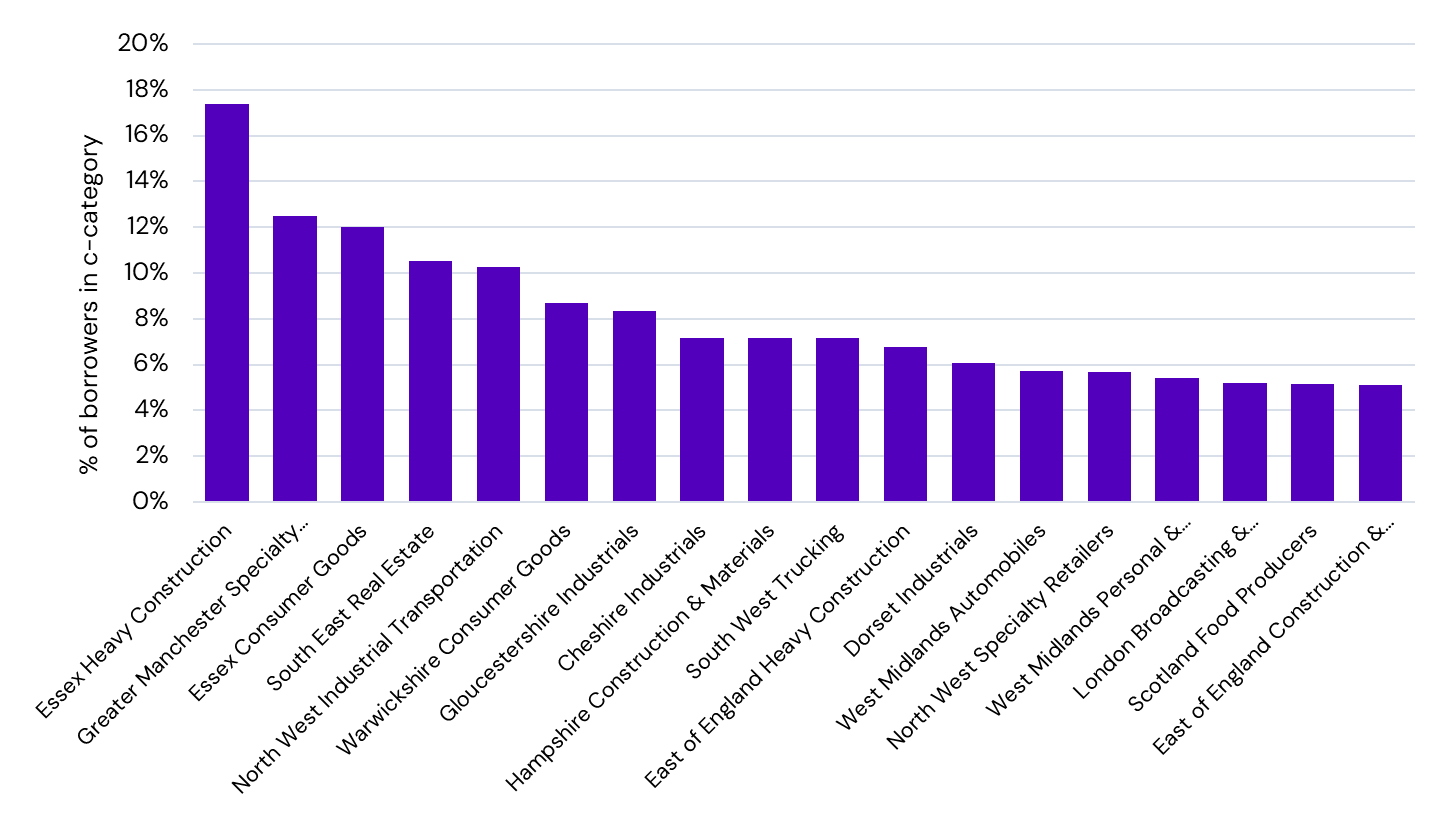
Two of the highest risk sectors are in Essex – Heavy Construction and Consumer Goods. Hampshire and East England Construction also appear, with South East Real Estate a high related risk. Trucking in the South West and Industrial Transportation in the North West are also high risks. Industrials in Gloucestershire, Cheshire and Dorset also feature. The other sectors in this chart are mainly in consumer-focused segments, but London Broadcasting and Scotland Food Producers also make the list.
Conclusion
UK economic growth and employment are expected to be higher than the EU bloc in 2025, but volatile inflation plus the budget deficit are obstacles to rapid rate cuts while the current account remains a challenge. While the trade deal with the US means that the UK avoids a major tariff hit, global economic trends suggest that default risks will continue to rise. However, the data in this report show that within the UK, the regional impact will vary.
Appendix 1 - PIT / Impairment Benchmarking Service
The PIT / Impairment Benchmarking service is published quarterly, providing consensus company-level and sector level impairment PD term structures.
The Credit Benchmark impairment dataset enables you to compare your PD term structure performance against the other banks contributing to the Credit Benchmark dataset.
Comprehensive data output is provided in a set of data files along with an accompanying report summarising high level analysis.
The output can be used to analyse whether your impairment curves:
The output can be used to analyse whether your impairment curves:
- Change in-line with other banks
- Are more conservative or aggressive compared to the other banks
The output can also be used to:
- Benchmark quantitative stage allocation rules
- Benchmark the impact of scenarios
- Identify anomalies in PD term structure behaviour
This service is delivered via our WebApp inbox or via Standard Secured Channel.
PIT Coverage Tree Map
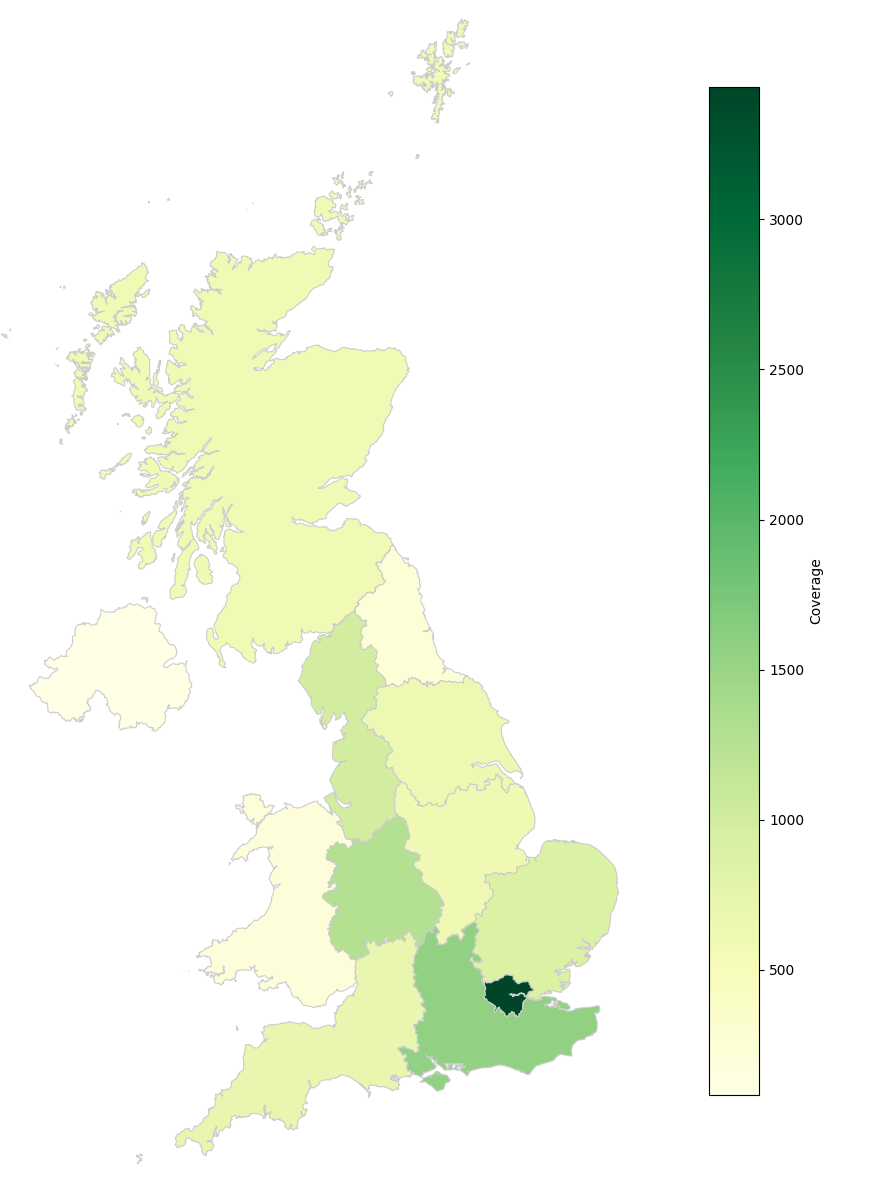
Appendix 2 - UK Credit Consensus Coverage Map by Region
Download
[1] Total CB UK Credit Consensus universe covers 17,700 obligors, with history dating back to 2015.
[2] Regional Trend data is also available for London, Scotland, Wales and Northern Ireland. Northern Ireland is excluded from the subsequent tables due to small sample size.
[3] Geometric average. Midpoint PDs arithmetically weighted by Credit Profiles will give a higher 1-year PD.
[4] Followed by a long tail of sectors with similar levels.