As insurance companies operate in an increasingly volatile environment, where do the credit risks lie?
With the prospect of lighter regulation, bank share prices have outperformed insurance in 2025. And while insurance companies remain exceptionally good credit risks, they operate in an increasingly volatile environment. How will credit be affected?
Executive Summary
The global insurance sector remains a strong credit performer but faces mounting pressures from market volatility, climate risk, and shifting asset strategies. While insurers are adept at managing long-term obligations, current macro and sector-specific dynamics are altering default risk profiles, investment opportunities, and capital allocation priorities.
Key Insights
- Credit Gap – Insurers are lagging Banks; Life Insurers’ rebound has recently stalled.
- Regional Risk – Europe is riskier than North America; UK Life and Non-Life skew lower quality.
- Life vs. Non-Life – Life has led for a decade, gap is narrowing, but Non-Life risk premium rises in “risk-off” markets.
- Event Containment – Losses from the Jan 2025 LA wildfires were absorbed by public insurance/local government programs.
- Asset Shift – Rising allocations to illiquid private assets (~$2.5T) boost yield potential but may increase credit and liquidity risk.
Implications for Leaders
- Closely monitor changes in regional and subsector default risks.
- Monitor spread changes between Life and Non-Life during market stress.
- Assess default risks embedded in private credit assets.
- Track competitor climate risk transfers to local government programs.
Outlook: Short-term negatives – softening premiums, climate and geopolitical risks – will pressure weaker balance sheets. Stronger firms are improving asset-liability resilience; dispersion across regions and subsectors will persist, requiring granular risk assessment.
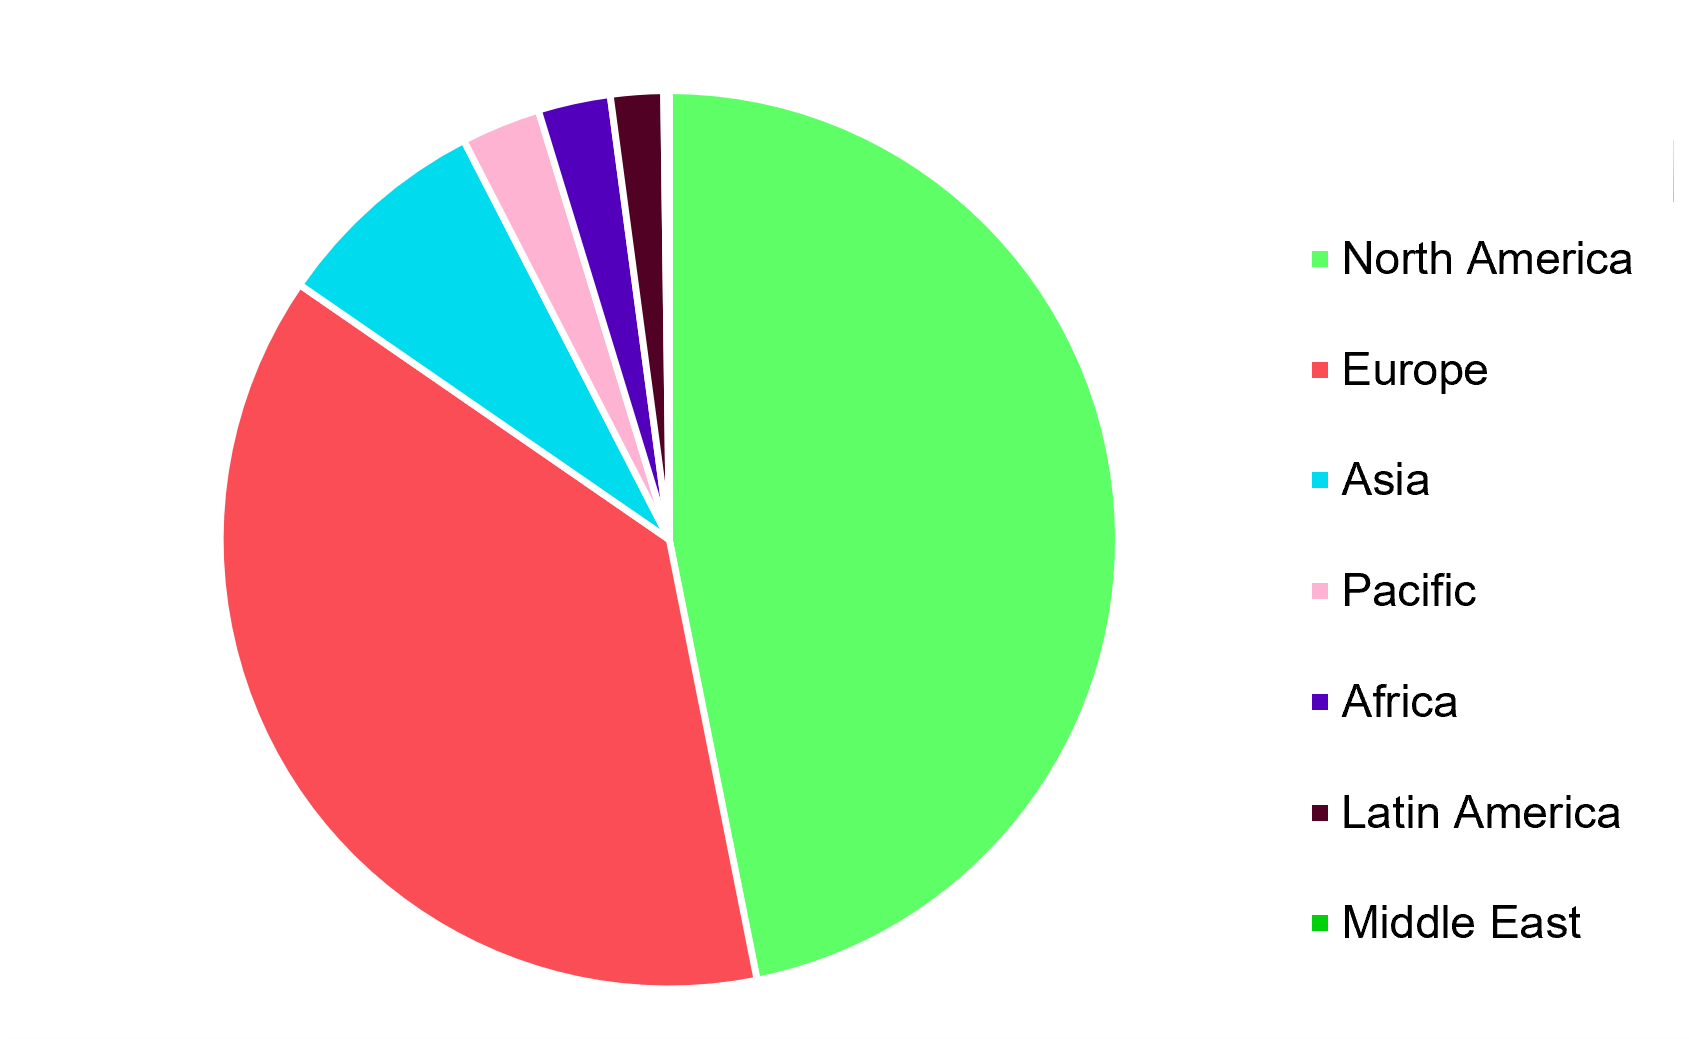
Credit Benchmark (“CB”)’s Consensus dataset covers nearly 2,000 Insurance companies globally. The geographic split is below.
Insurance Consensus Coverage by Region
Insurance Credit Consensus Ratings by Region
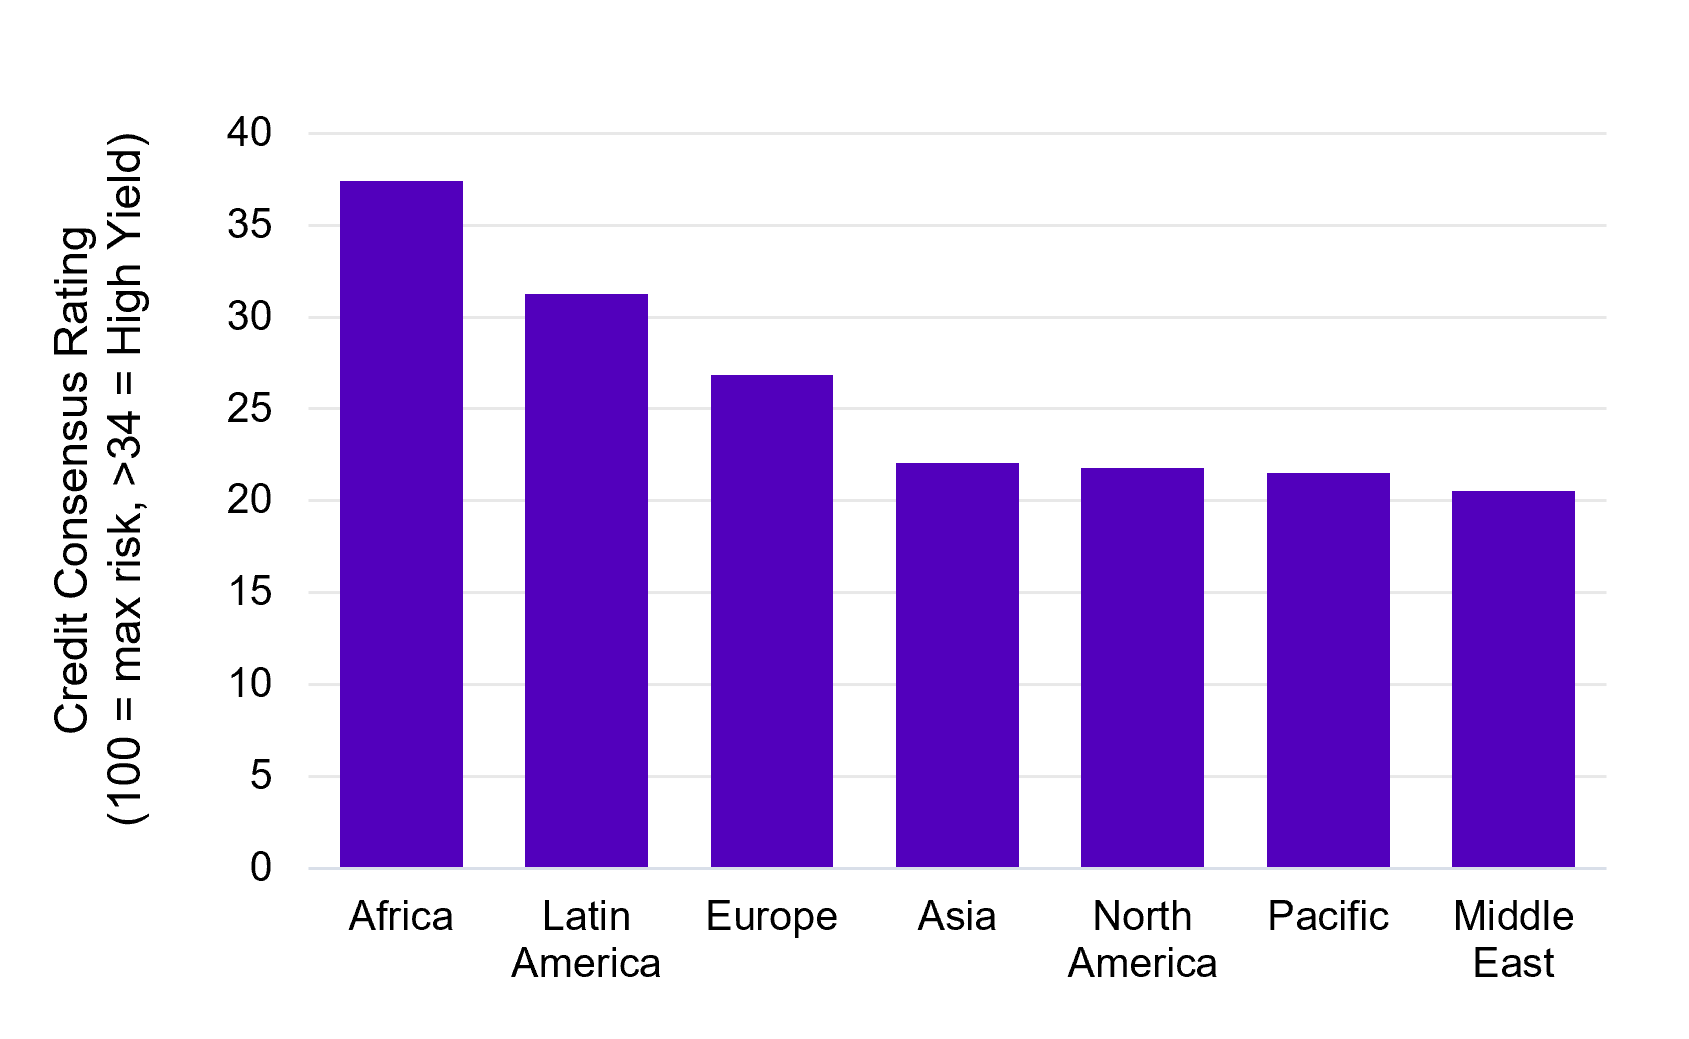
CB’s Consensus coverage of Insurers is concentrated in North America and Europe. European Insurers are noticeably higher risk than in North America; Africa is the highest and Middle East (albeit a small sample) is the lowest.
Insurance Consensus Coverage by Sub-Sector
Insurance Credit Consensus Ratings by Sub-Sector

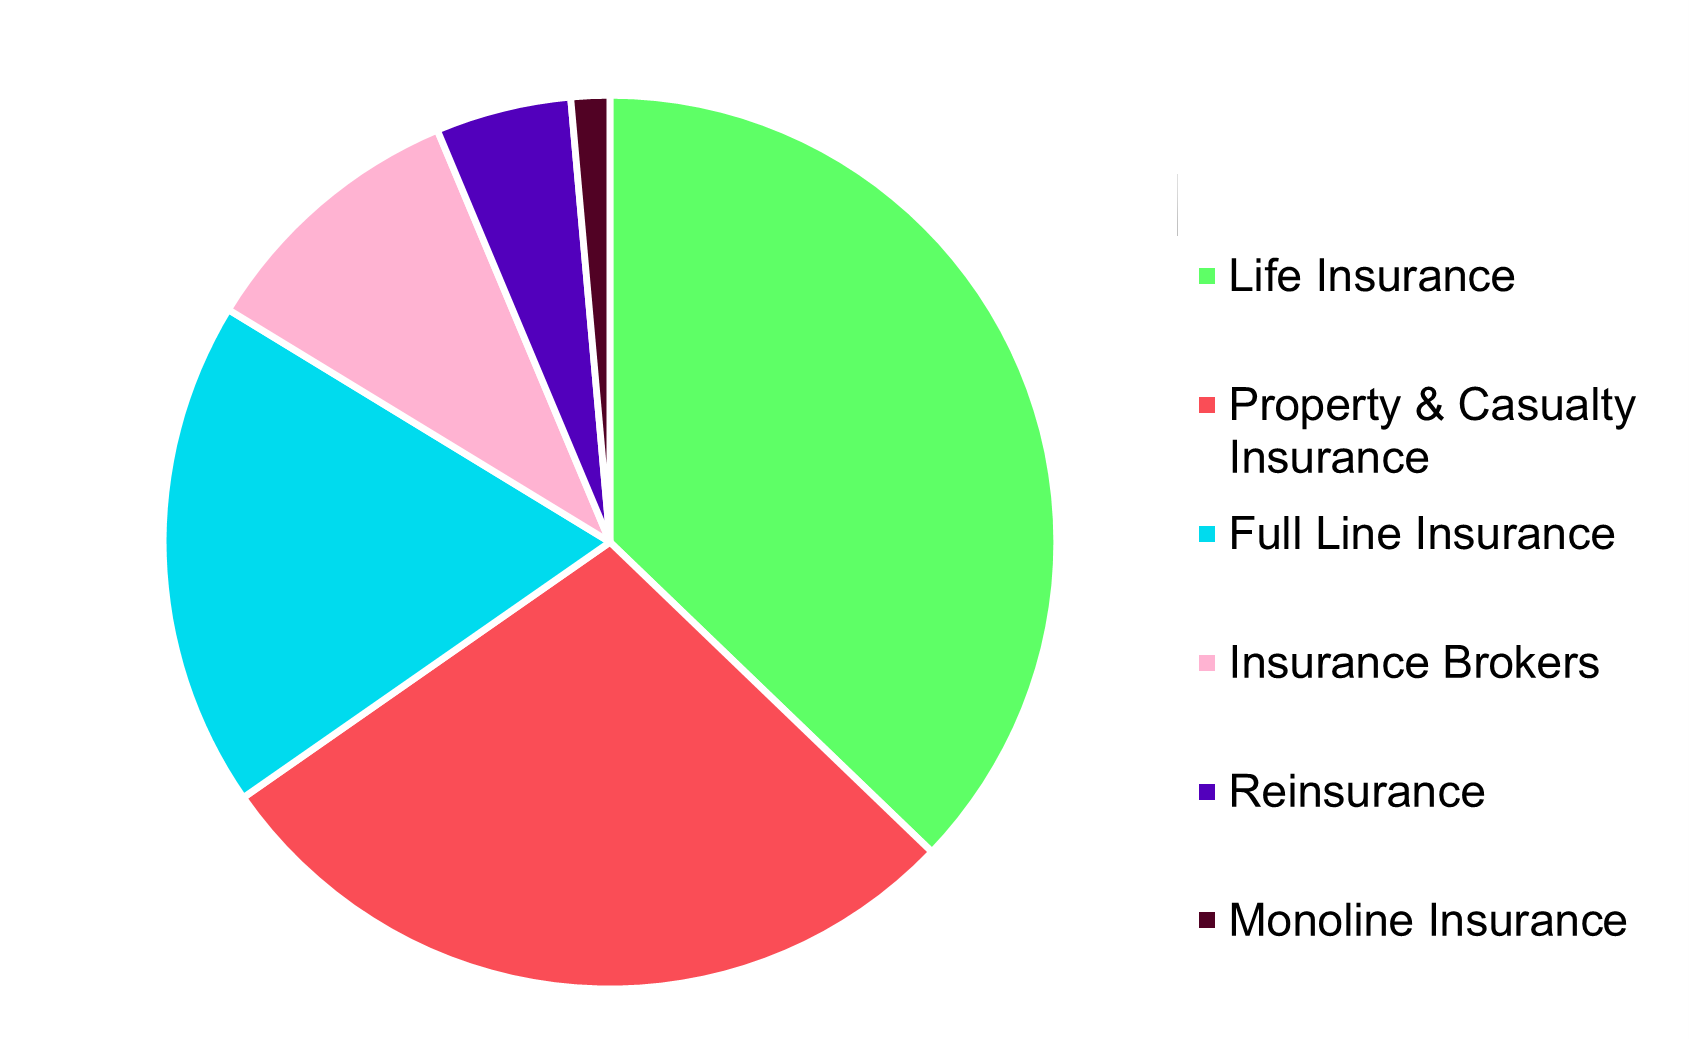
Life, Property & Casualty, and Full Line Insurance firms make up 80% of Credit Benchmark’s Consensus coverage. Insurance brokers are, on average, sub-investment grade, with Monoline the next highest risk but the average default risk remains narrowly inside the investment grade boundary. Reinsurance firms are the lowest risk. Life Insurance is slightly higher risk than Property & Casualty Insurance.
Detailed aggregates for the insurance industry are available in Credit Benchmark’s Web App. Contact [email protected] to arrange a demo.
The chart below shows the 2-year credit trend comparison for Insurance vs. Banks.
Credit Trend: Global Banks vs. Global Life Insurance vs. Global Non-Life Insurance
Banks show steady credit improvement, but Life and Non-Life Insurance sectors deteriorated in 2024.
Both Insurance sectors showed signs of recovery in 2025, but the Life sector has faltered.
Insurance performance drivers have been mixed: asset returns & interest rates (recently positive), insurance market volume and pricing (recently negative), claims / losses (recently mixed). The chart below plots Global Insurance default risk changes vs. the US 2-year Treasury Yield.
Global Insurance Default Risk vs. US Treasury 2-Year Yield
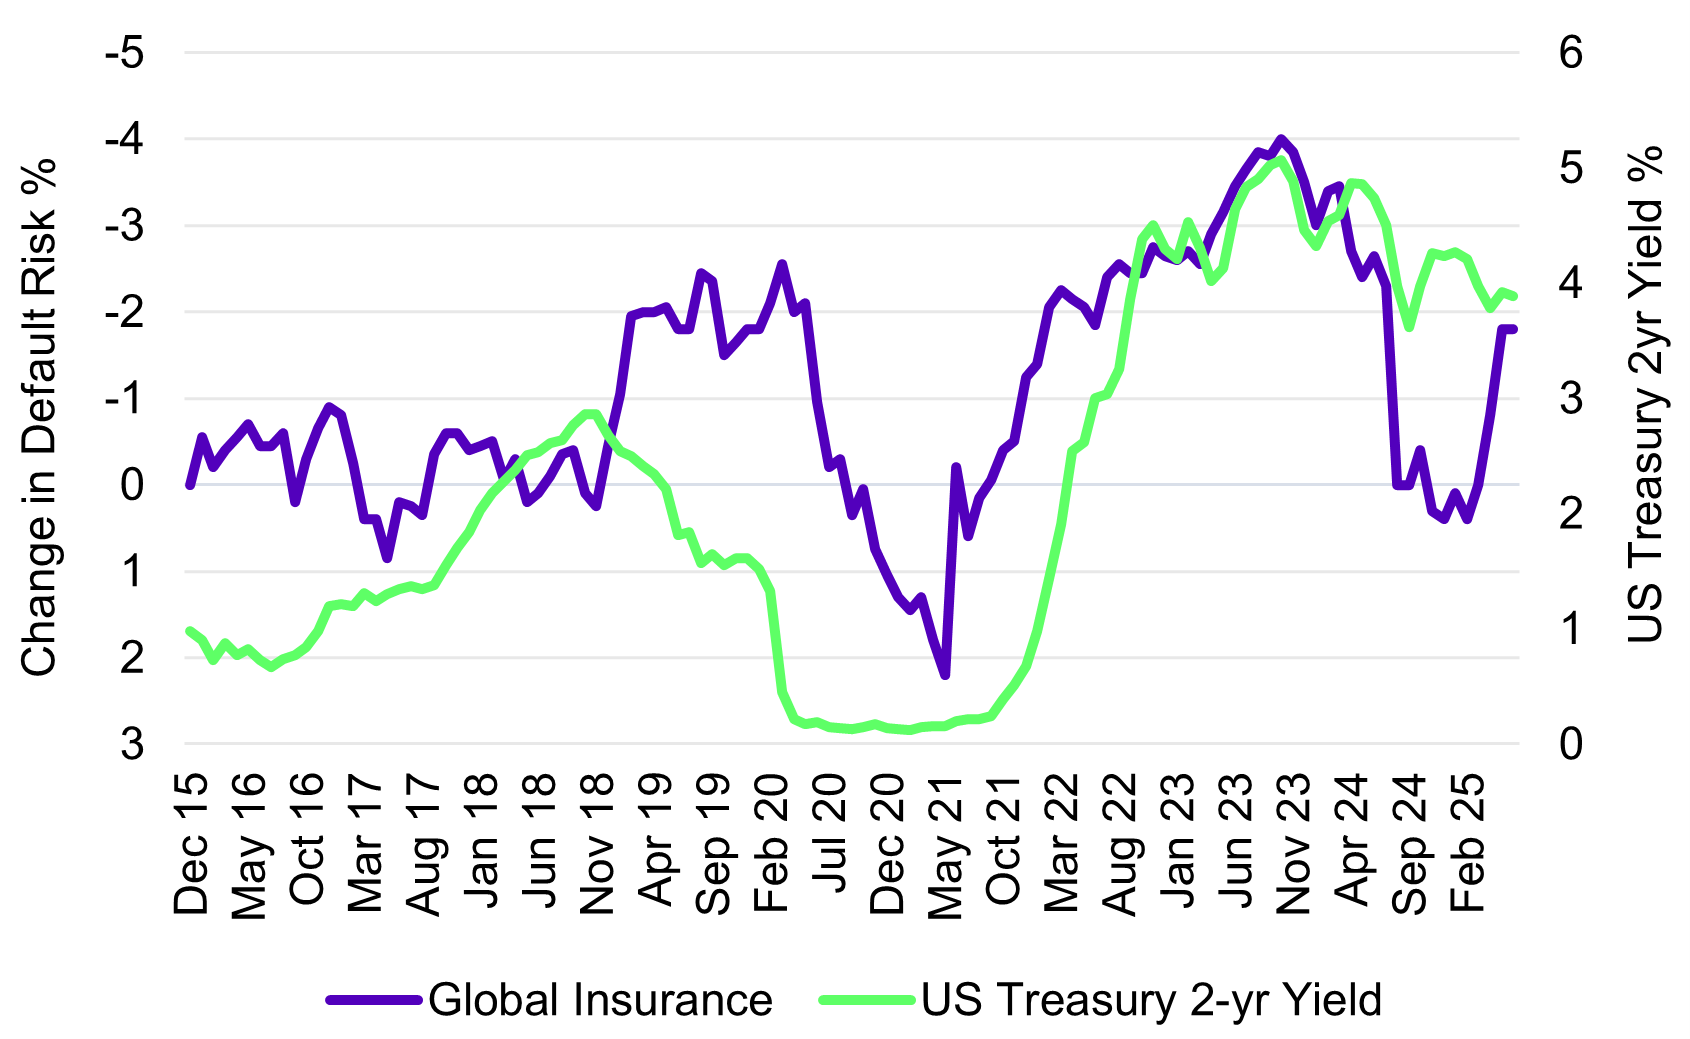
Insurance companies usually benefit from higher interest rates (lower liability valuations and higher returns on float cash).
The above chart shows periods where higher interest rate levels lead improving credit, but the exception – the 2021 credit improvement – probably reflects the post-Covid recovery.
Credit Profile: Public Insurance Firms (165) vs. Private Insurance Firms (1,830)
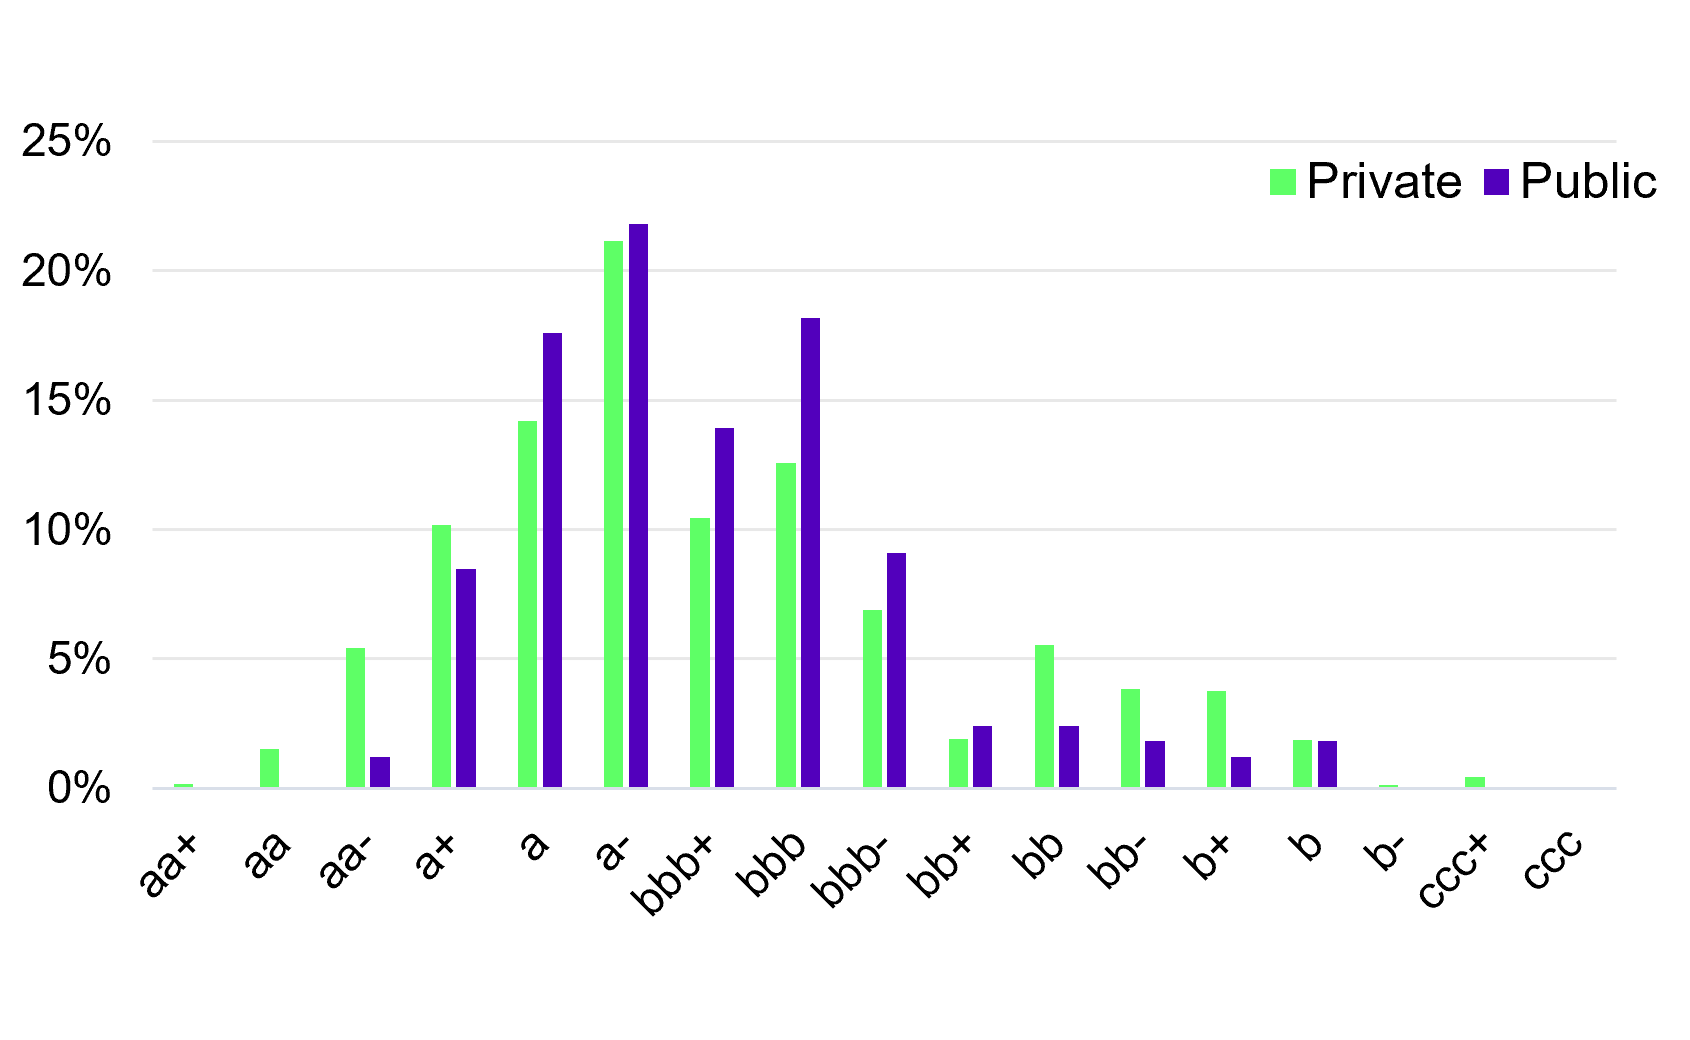
Most insurance borrowers are private (i.e. no equity listing).
The credit profile of the private obligors is broader and flatter, with a higher % in the ‘aa’ and ‘a’ categories, and higher % in the ‘bb’ category as well.
Public firms are clustered in the middle range.
Life vs. Non-Life Credit Trends
In credit terms, Life has moderately outperformed Non-Life over the past 10 years:
Global Life Insurance vs Non-Life Insurance Cumulative Probability of Default (PD) Changes 2015-2025
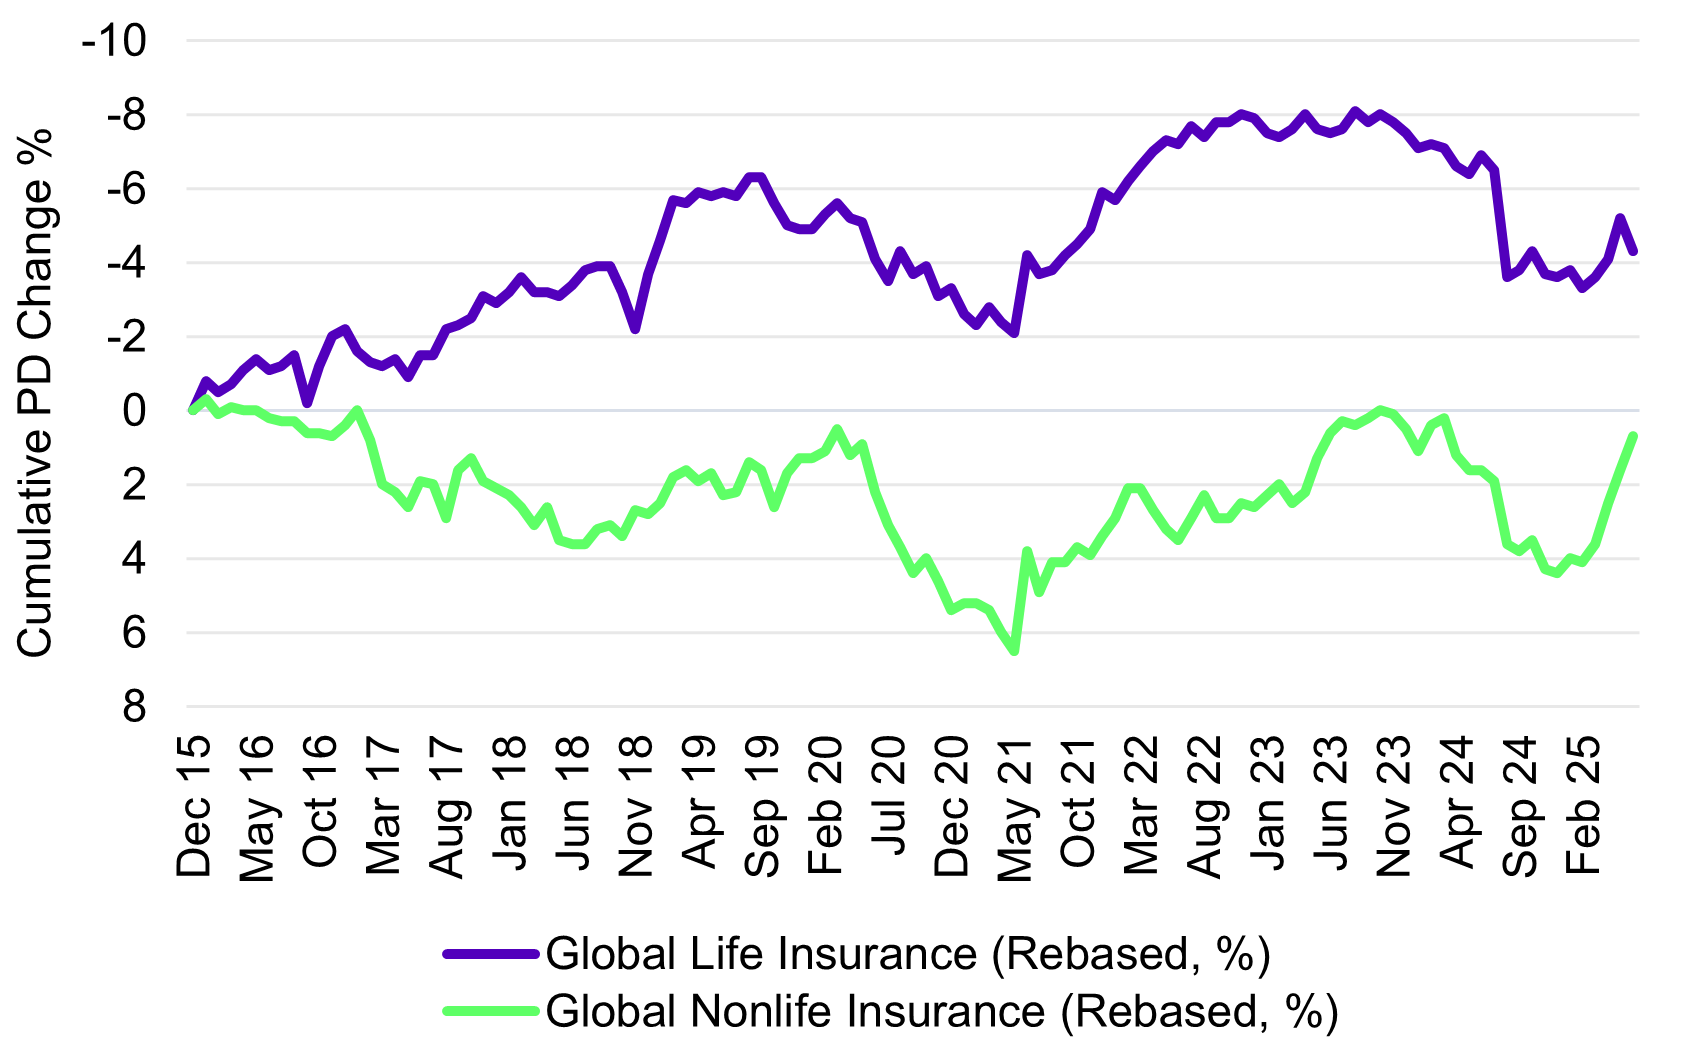
The histograms below plot regional and UK credit profiles for Life and Non-Life:
Life Insurance: Credit Profile by Region

Non-Life Insurance: Credit Profile by Region

Compared with other geographies, the UK stands out: UK Life insurance has fewer firms in the ‘a’ category and more in ‘bbb’; UK Non-Life has more exposure to non-investment grade.
Globally, Non-Life companies are slightly but consistently higher risk, but the risk premium varies over time. During Risk-Off phases, the Non-Life risk premium increases.
Global Non-Life Insurance vs. Life Insurance Default Risk Premium
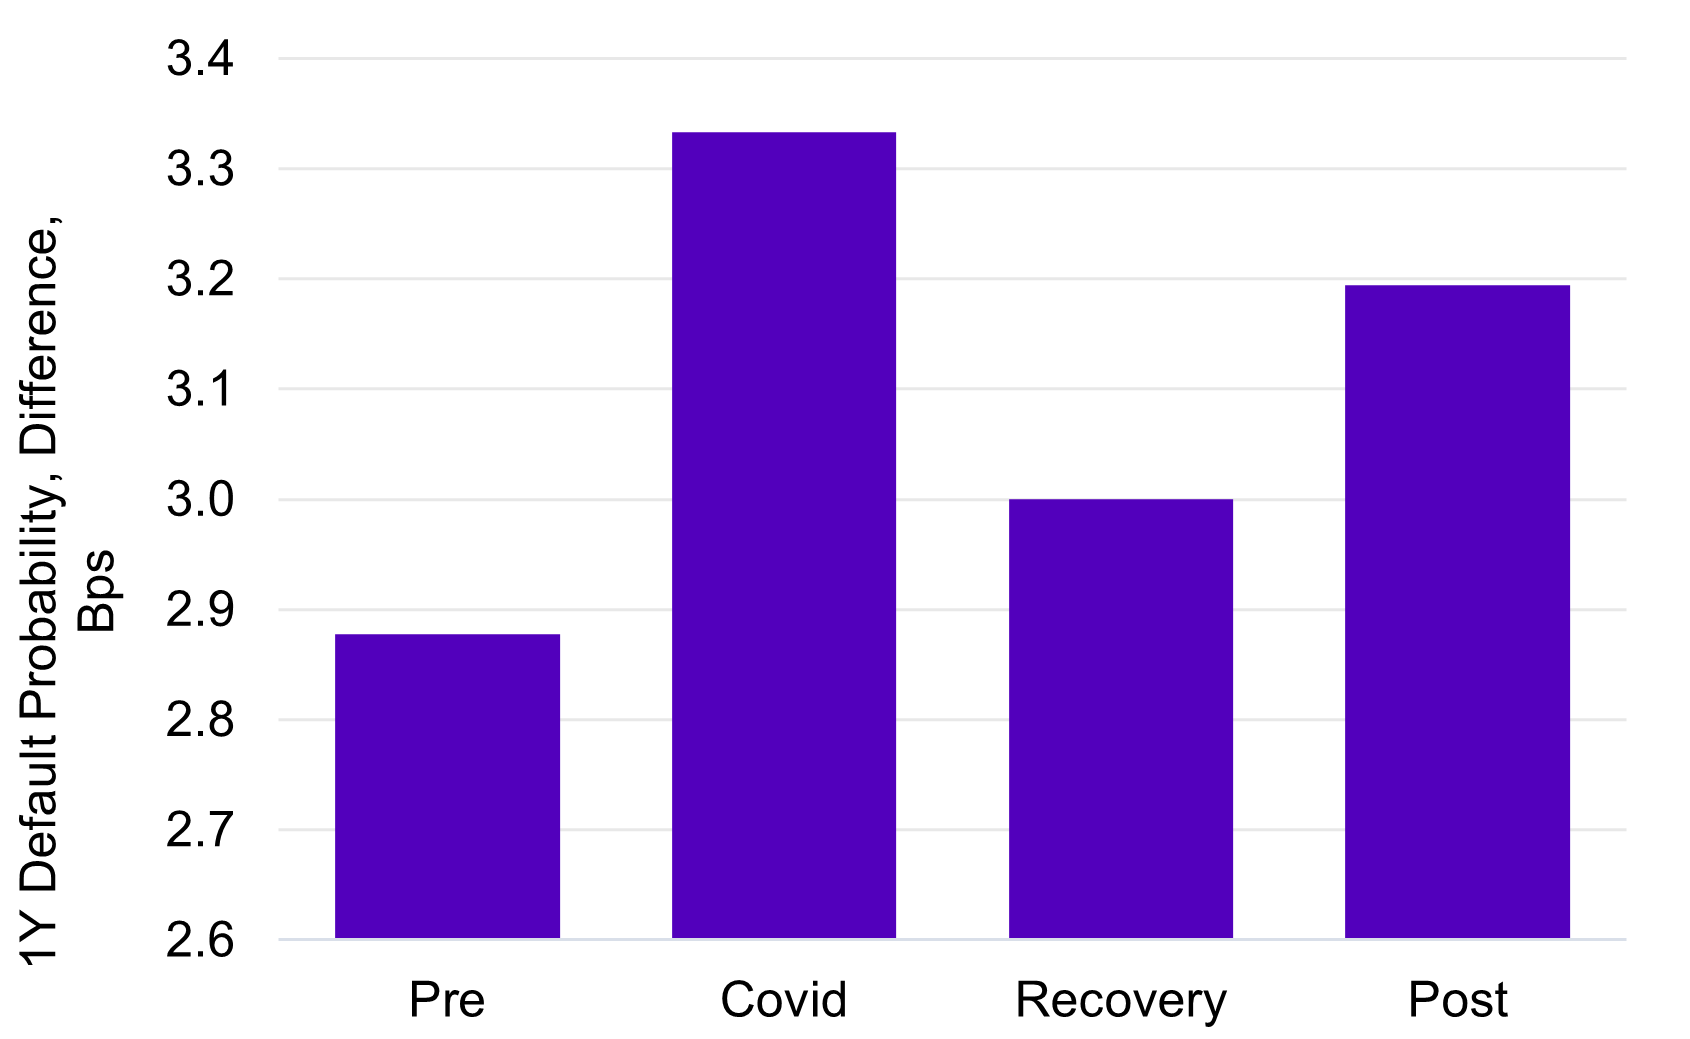
During Covid, the Non-Life / Life spread increased by 10%, and spiked again after the Ukraine invasion.
It has not returned to Pre-Covid levels and geopolitical tensions have kept it high.
As a general rule, the Non-Life risk premium is higher when financial markets are in “Risk-Off” mode.
Credit Migration Rates
Global Life Insurance - Full History Transition Matrix (June 2018 - June 2025)
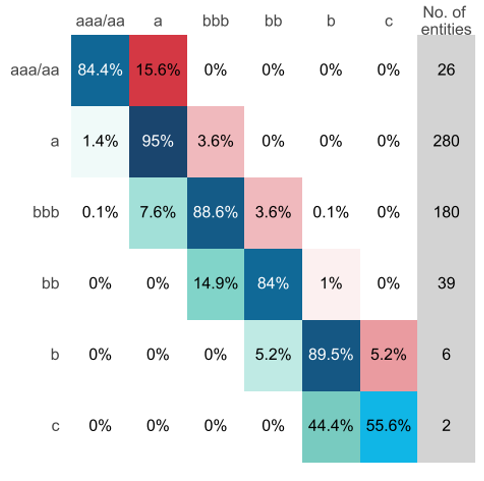
Global Non-Life Insurance - Full History Transition Matrix (June 2018 - June 2025)

Despite its relative credit improvement, Life Insurance sector downgrades show a migration rate from ‘aaa’/‘aa’ to ‘a’ at twice the rate of Non-Life Insurance, albeit for a small sample of 26 firms. The ‘a’ to ‘bbb’ and ‘bbb’ to ‘bb’ downgrade rates are very similar for both sectors, but the ‘bb’ to ‘b’ downgrade rate for Non-Life has been more than three times the Life equivalent.
Upgrade rates have been higher for the Life sector in all credit categories except (marginally) for ‘b’ to ‘bb’ migration. Both sectors have seen significant upgrade rates (55.6% and 60.4%) from the ‘c’ category to the ‘b’. However, the long run default rate for firms in the ‘c’ category is in the 20% – 30% range, so those that do not upgrade are at significant risk of default.
Credit Benchmark’s consensus rating dataset includes 1,700 transition matrices with history of up to 10 years for multiple obligor types, regions, countries, industries and sectors. See Credit Risk IQ for more details and latest 1-year matrices. These are available for 7 or 21 credit categories.
LA Wildfires
The financial impact of the January 2025 LA wildfires is a good example of the transfer of risk from the private to the public sector (i.e. local government bearing the burden). The chart below shows that US Property & Casualty Insurance default risk improved significantly in the following 6 months.
Credit Trend: US Life Insurance vs. US Non-Life Insurance vs. US Property & Casualty Insurance
And a recent report on the LA fires from Moody’s estimates actual insured loss at $30bn against economic losses of $250bn. The bulk of the “insured” damage was covered by the State-run FAIR system, which now underwrites $450bn of property and related risks. It was also met directly by uninsured households.
The map below shows that other State Agencies may also have to provide public insurance as wildfire prevalence spreads eastwards.
Change in Annual Burned Acreage by State Between 1984-2002 and 2003-2021

Source: US EPA (Climate Change Indicators: Wildfires) Retrieved 15 August 2025
Insurance Company Assets: Role of Alternatives
The role of insurance companies in the financial system is changing. Insurance companies (and pension funds) are natural hold-to-maturity investors for the expanding pool of illiquid private instruments currently valued at around $2.5trn and likely to grow further.
If credit risk rules are relaxed, insurers may be able to offset some of the impact of lower interest rates, but that may take the form of a transfer of risk to the asset side of the balance sheet.
It is possible that the growth of alternative assets in the hands of long-term investors will give scope for better overall investment risk sharing, provided there is a transparent understanding of the underlying credit and other risks to balance the potentially attractive headline returns.
Current trends in default risk drivers
- Asset returns and interest rates (strongly positive): Rate cuts will underpin asset returns, but push yield-hungry insurers into increasing investment risks, within the boundaries set by regulators. Some regulators may allow more hold-to-maturity investment in private assets.
- Liabilities and interest rates (slightly negative): Real rates are low, so cuts in short rates my steepen the yield curve (i.e. higher inflation expectations), negating recent benefits of lower liabilities.
- Life Insurance risks: demographics (neutral): Aging populations are long term negative for Life Insurers, but post-Covid life expectancies are changing. Life Insurers are also partnering with alternative asset managers to reduce direct exposure to Life-related risks.
- Property & Casualty risks (less negative than expected): Climate change and rising geopolitical tensions are not independent, and some Monolines may be vulnerable. But overall Non-Life insurers are increasingly selective about underwriting climate related risks. In some jurisdictions this may transfer risk to Government Agencies.
- Insurance rates and volumes (short term negative): Marsh report that most general commercial rates have been softening for the past few quarters.
Conclusion
The combined effect of these various drivers are probably short-term negative for insurance default risk, but have a disproportionate effect on those with the weakest balance sheets.

