This blog reports on the volatility of credit estimates measured by Credit Benchmark, compared with equity market volatility measured by the CBOE Volatility Index (the ‘VIX’). The two measures have recently shown a sharp divergence.
This week, S&P Global Ratings reported that U.S. companies are as vulnerable to defaults and downgrades as they were leading up to the 2008 financial crisis. But this week the S&P equity index also made a fresh high, supported by a strong jobs report, a recovering oil price, further Quantitative Easing from the U.K. and the VIX index at a one-year low. The VIX is derived from the implied volatility of options on the S&P500 index, so it is a market-implied view of the 30-day future range of equity index values. In the past 12 months, it has fallen from 22% to 15%, although this partly reflects the drop in the VIX after the extreme bout of volatility in August 2015, when it peaked at 41%. The equivalent for short interest rates – the SRVIX – is also very close to a one year low.
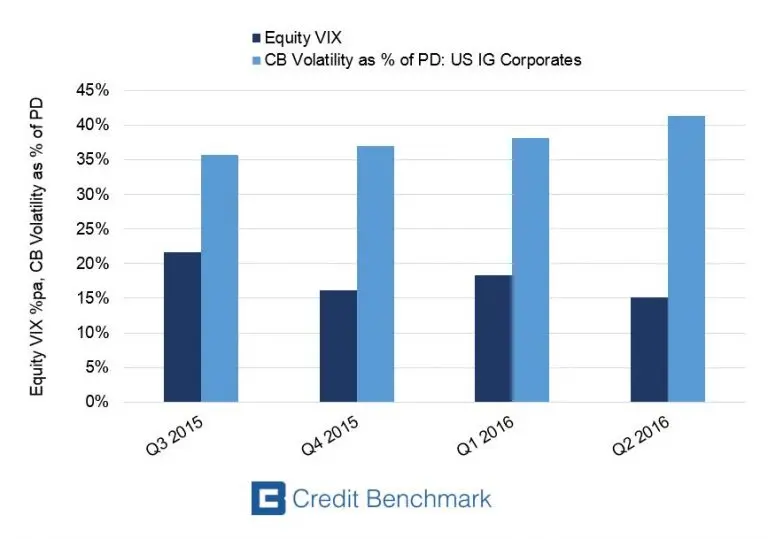
There is no direct equivalent for credit, but Credit Benchmark calculate the range of bank credit risk estimates for their universe of individual borrowers. The graph below plots the median quarterly range for the US Corporate Investment Grade universe, plotted as a proportion of the median credit risk level. This shows that the range of credit risk estimates (“credit volatility”) has been increasing every quarter, and this range has crept up from 36% to 41%.
These measures are not strictly comparable – the equity VIX and interest rate SRVIX measure systematic market risk, whereas the credit volatility measures borrower-specific risk. But the chart suggests that while equity and short rate volatility are both very low, the current credit environment is a source of considerable uncertainty. A major driver here is ongoing global QE, which has pushed equity values up and short rates down, but has simultaneously encouraged corporations to issue large volumes of debt, especially in the form of long term bonds.
Equity and credit markets are notorious for being out of step, but this chart shows that the current divergence in views is particularly large.