
- Executive Summary
- Introduction
- Public vs. Private Credit Ratings in Current Bank Exposures (The Listed Security IG Waiver)
- US Sector PD Comparisons
- Default Risk Correlations and Volatilities
- Volatility of Market-Implied Measures vs. Real World Consensus
- Credit Value Adjustments: Real World Estimates Complement Market Measures
- Mean Reversion
- Conclusion
- Download
Executive Summary
The Basel “Endgame” proposals aim to reduce risk across the regulated US banking system. The 1,000+ page document is mainly focused on market and operational risk, but the credit risk sections propose the removal of internal rating models; leading to a significant increase in the collective capital requirement for the largest banks. This report uses default risk estimates from global banks to highlight potential fault lines embedded in the new rules.
Key Findings
- Public and private US Corporates show near-identical default risk profiles – security listing rule looks arbitrary.
- S&P default data shows that each credit crisis has a different sector profile.
- Default risk volatilities as well as correlations between industries, sectors, and credit categories change over time.
- Market-based measures of credit risk are more volatile than bank analyst estimates.
- Consensus estimates cover many unrated private companies – essential for accurate xVA pricing.
- No evidence of material mean reversion in default risk estimates widely used by the global banking industry.
The report draws on consensus default risk estimates from more than 20,000 analysts in 40+ banks globally (including 17 Global Systematically Important Banks (GSIBs)). These are updated twice-monthly, cover 100,000+ borrowers (most of them unrated by main credit rating agencies) plus 1,200 derived credit-tracking indices. This dataset is increasingly used by banks and regulators to manage credit portfolio risk and economic capital.
Introduction
Endgame rules use broad “exposure classes” with specific risk weights, rules and procedures for some categories. Part of the aim is to encourage lending in some areas (eg Real Estate with low LTV).
A key example of the new exposure classes is the hybrid category “specialized lending”, which is also a possible bridge to the shadow banking sector (see below). As the chart shows, regulator concerns reflect a sustained deterioration in credit in this area over the past 5 years.
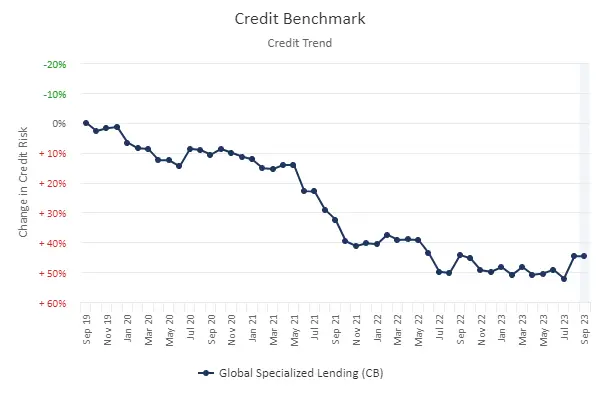
A regulatory shift to fixed weights and exposure classes makes it easier to compare risk profiles across different banks, and – in theory – manage systemic risk.
Public vs. Private Credit Ratings in Current Bank Exposures (The Listed Security IG Waiver)
A positive feature of the latest proposals is the reduction in credit risk weights from 100% to 65% for investment grade1 corporates has a security issued on an exchange. This is a form of doubling down on market views of credit risk; if the instrument does not trade, then any bank view without a direct market input becomes irrelevant2.
The chart below shows credit distributions for US corporates across public and private names.
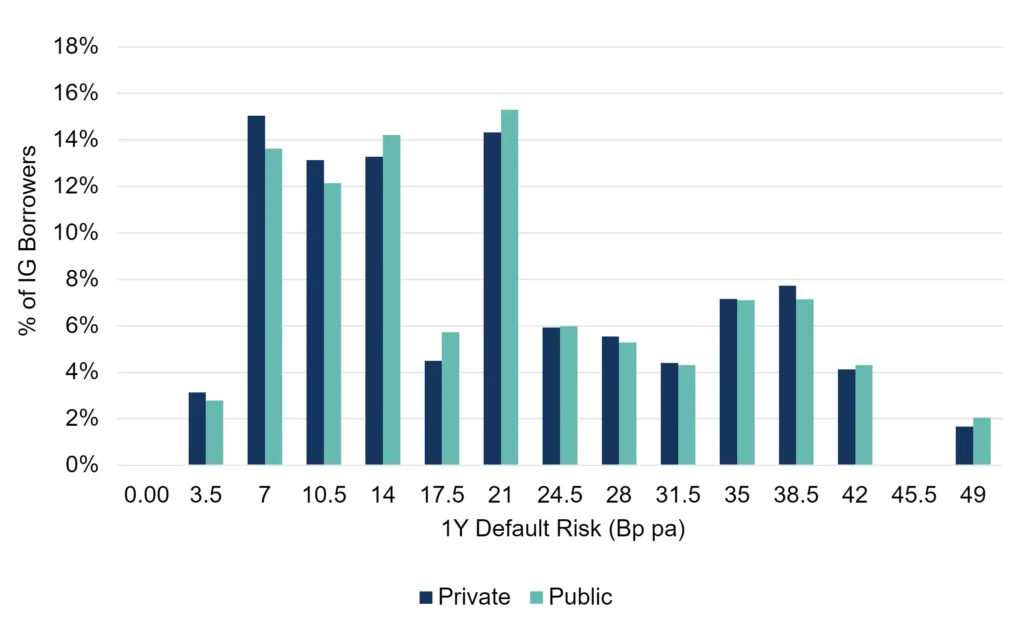
This implies that banks see no need to differentiate between traded and untraded: the distribution of consensus default risk estimates for Public and Private IG borrowers look almost identical.
US Sector PD Comparisons
The role of regulatory capital is to diversify risk and absorb losses that are typically heaviest during economic downturns, and fixed RWA weights imply that downturns have similar characteristics. The chart below shows which industry had the highest observed default rate in every year since 1981.
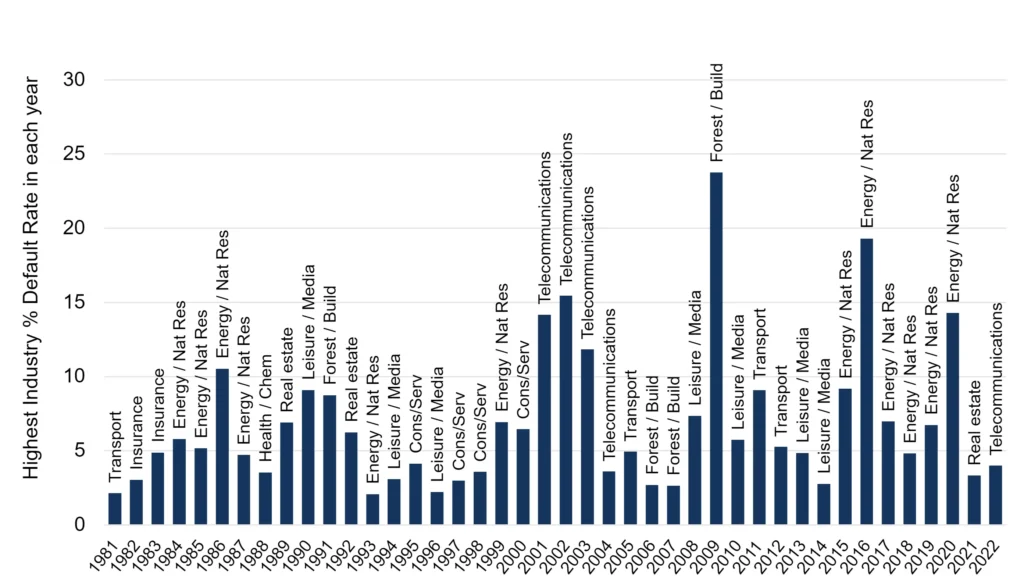
Source: Standard & Poor’s Financial Services LLC.
Some sectors – like Oil & Gas and Real Estate – tend to feature heavily in every default rate cluster. Other industries appear in clusters, suggesting that default rate spikes are partly industry-specific.
Default Risk Correlations and Volatilities
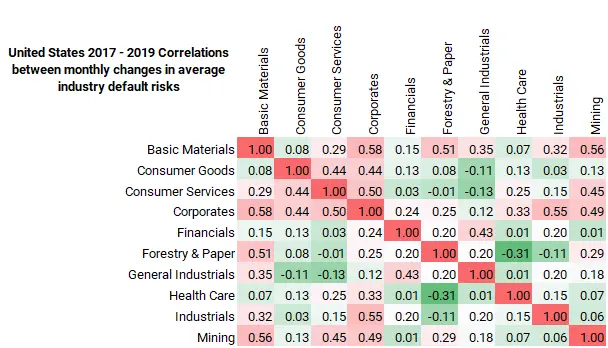
It is not just the sector mix that is problematic3. The “credit cycle” is not well-behaved: the timing and frequency of downturns is difficult to predict. In late 2022, defaults were expected to rise sharply by mid-2023 – but economies have generally proved to be far more resilient than many expected. Even the recent past shows major shifts in the pattern of default risk correlations. The matrices below show the pattern of correlations between US industries before, during and after Covid.
Pre-Covid
Covid (2020-21)
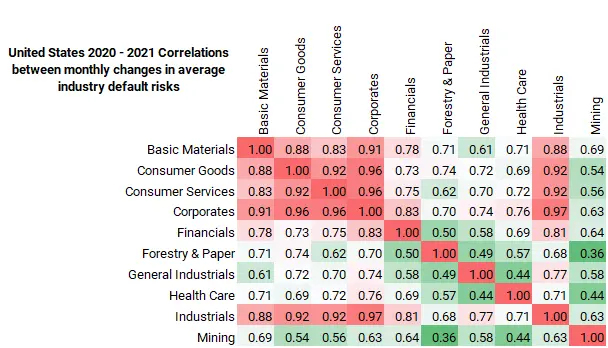
Post-Covid
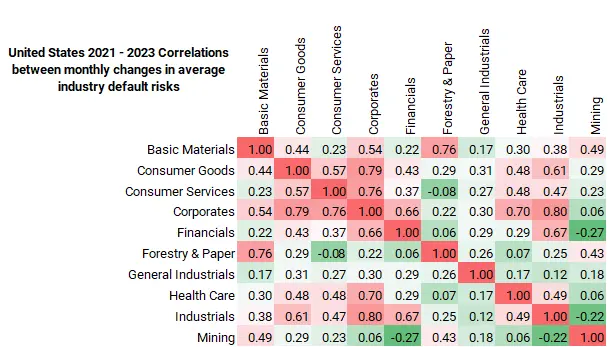
Some correlations rose sharply during Covid; despite easing in the past two years they remain above the pre-Covid level. As correlations rise, scope for diversification narrows and systemic risk rises.
The chart below shows the rolling 12m correlation between the US Corporate IG and HY indices.
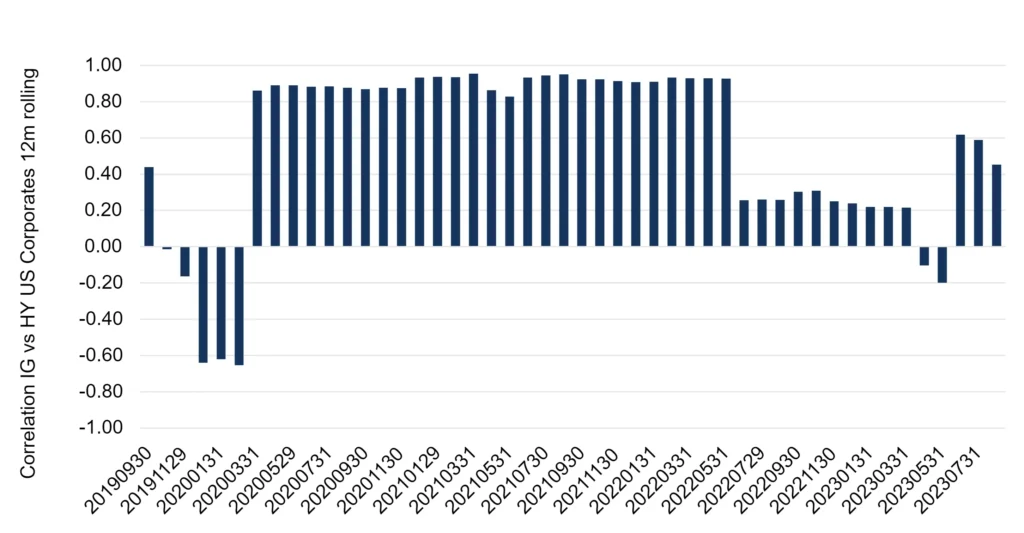
The correlation between default risk changes in Investment Grade (“IG”) and High Yield (“HY”) credit categories is also highly variable and at times may be lower (i.e. more diversifying) than between some sectors. These large shifts will mainly reflect “Risk On / Risk Off” position taking, but the next section shows that recent correlation patterns within and between these groups have become more nuanced.
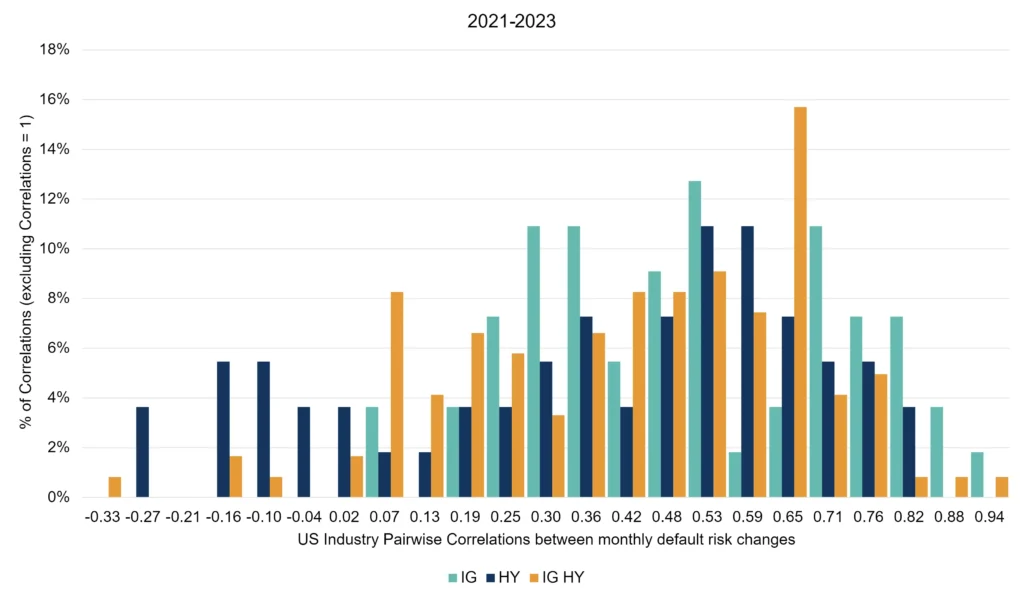
The next two charts show the detailed distribution of pairwise correlations (of default risk monthly changes) between industries in the IG and HY credit groups separately, as well as across the two groups.
In the period 2018-21, the negative pairwise correlations are concentrated in the IG category and IG-HY cross category. The pairwise industry correlations between HY borrowers are mainly high and positive (HY subsets of industry indices mainly moved as one block, with industry effects being second order).
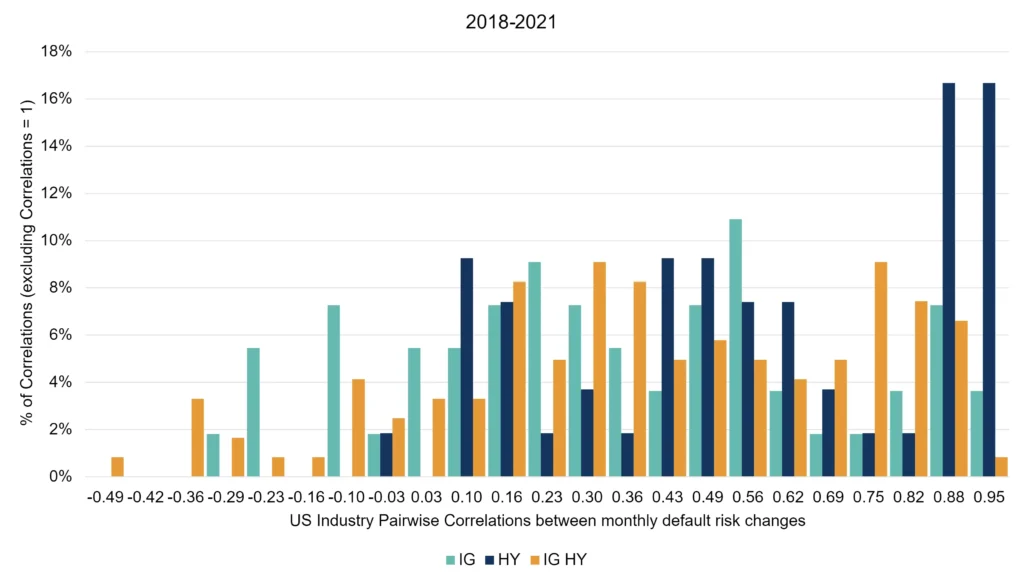
The post-Covid period shows a significant number of negative pairwise correlations between the HY industry subsets. The IG-HY cross-category shows a large number of positive correlations, meaning that default risks for a significant number of IG and HY borrowers have been moving together.
Default risk for IG and HY names often moves independently, but the patterns can shift dramatically, and correlations can quickly move from negative to strongly positive. This can have major impacts on systemic risk.
The volatility of default risk changes is also fluid. The chart below shows the standard deviation of percentage changes in monthly default risk estimates for the IG and HY names in the US Corporate universe.
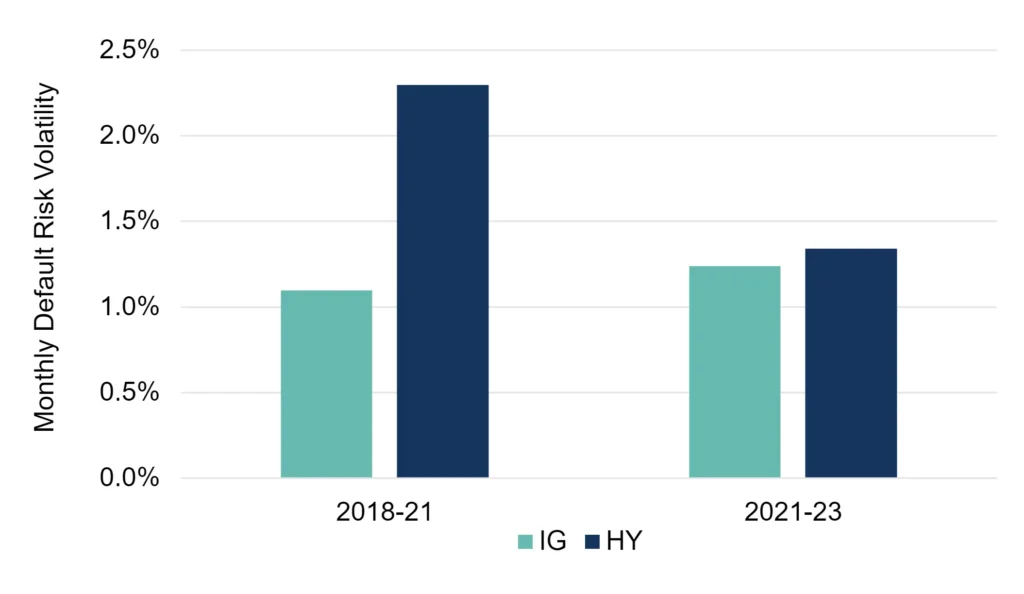
This shows that while IG volatility has increased slightly in the post-Covid period, HY volatility has nearly halved. This may reflect some survivor bias after Covid – either due to many borrowers going bankrupt during Covid or banks becoming more selective in their lending choices.
Volatility of Market-Implied Measures vs. Real World Consensus
US Regulators take the view that market measures of credit risk are more likely to be accurate or at least unbiased compared with bank opinions or model outputs. The chart below shows the recent trend for bank views of High Yield credit risk and the corresponding OAS spread for HY bonds.
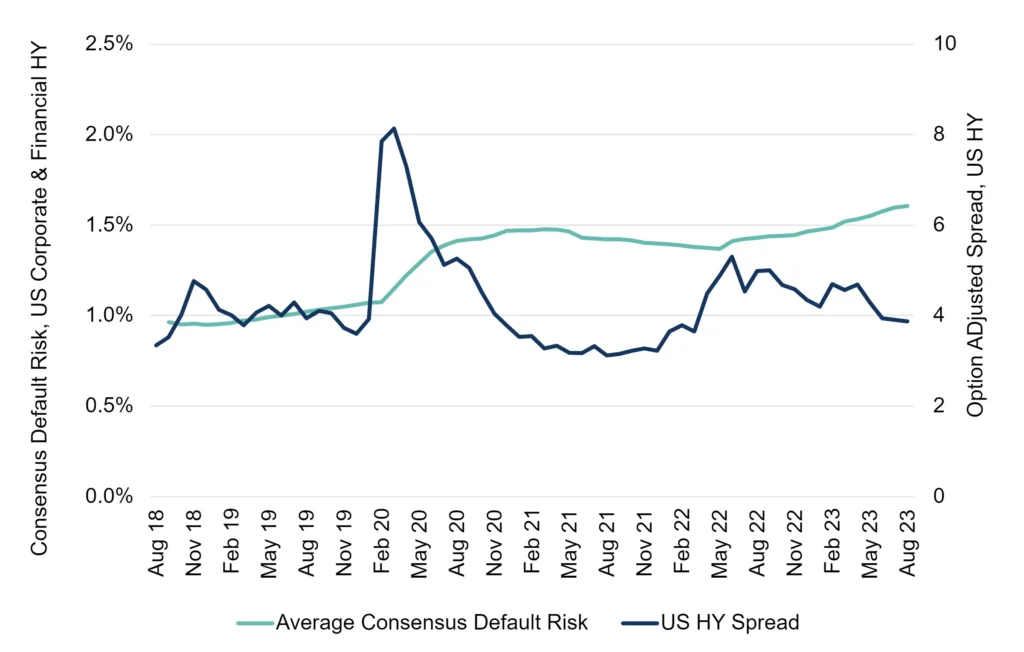
Default Risk consensus estimates show 18% monthly volatility vs. 24% for the OAS, as a % of the average level in each case. Default Risk has been rising steadily but the OAS is at a similar level to 2018, despite higher volatility. NB: Both of these series will have an element of survivor bias; both will drop constituents that either default or upgrade.
This does not imply that the consensus data is “more correct” but it suggests that the two forms of credit risk estimates – real world and market implied – can be combined to give a lower variance and more robust estimate.
Credit Value Adjustments: Real World Estimates Complement Market Measures
Many bank counterparts do not have an agency credit rating or associated CDS and also do not have any bonds or equities in issue.
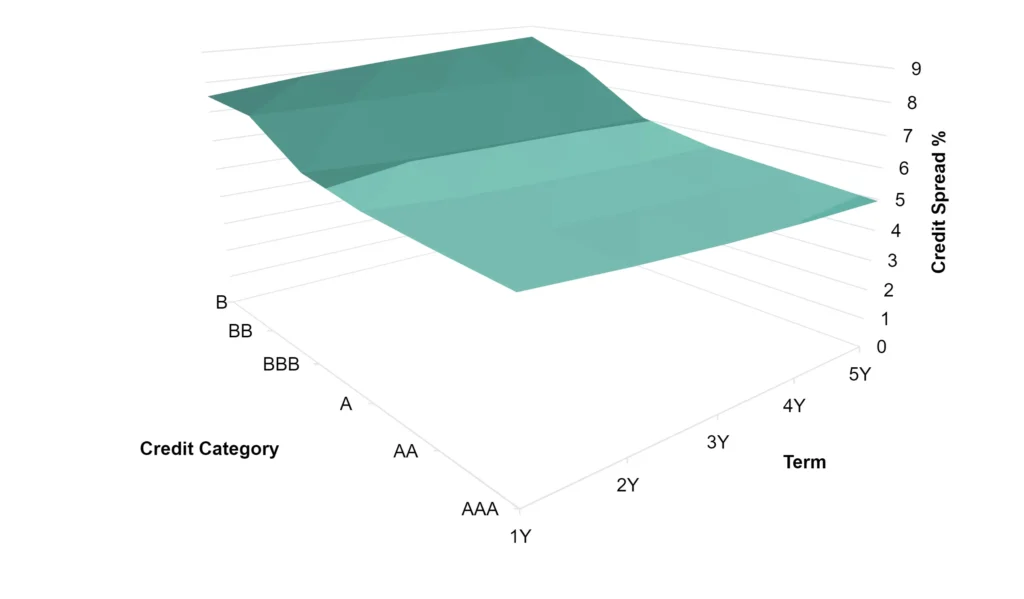
The cumulative default risk surface plotted below is based on corporate credit transition matrices and default risk estimates across the large consensus universe. This provides a robust and almost complete surface with low variance in estimates; this is also a useful foundation for estimating credit risk premia from market data.
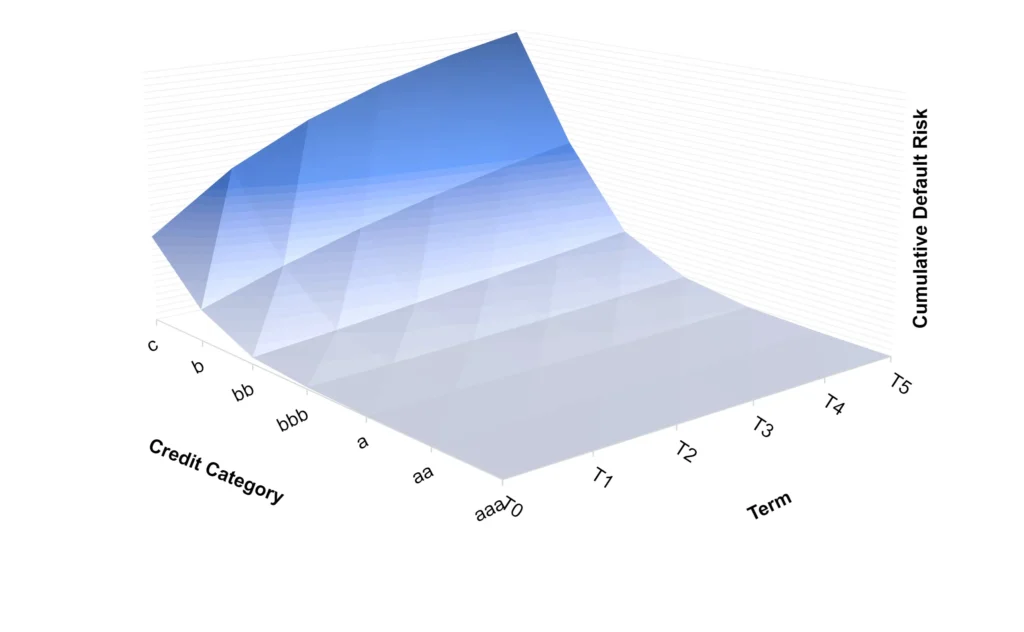
This approach allows banks to use market data for CVA pricing but also allows them to:
- Map single counterparts to specific credit categories (and if necessary to the correct country / industry / sector curve)
- Estimate the real world PD for the chosen term for a specific counterparty, and then adjust this by a more generic market risk premium if the detailed market data for a specific country / industry / sector is not available.
This approach maximises the value of consensus data which extends well beyond the traded universe with the best practice of using market risk estimates for daily CVAs. The chart below shows the market equivalent for early October 2023.
For US Corporates, market data also provides a nearly complete surface (the C-category is too sparse) and this can be extended – with gaps – to much longer maturities. However, for other countries and many domestic sectors the market data can be very patchy but consensus data may support transition matrices for some missing categories.
Mean Reversion
Peer group datasets can display mean reversion – where contributors correct their own outlying default risk estimates to be closer to the group median, so that over time the dispersal in estimates reduces and there is no diversity of opinion. (It could be argued that a standardised approach to default risk estimation forces this outcome.)
Regulators have frequently commented on what they see as the excessive divergences between bank credit estimates, but it could be argued that a healthy credit market needs some degree of divergence to facilitate competition. Credit risk is probabilistic, not deterministic; and many banks consciously adopt an outlying view of credit risk for a particular borrower.
The next chart is based on cross sectional volatility (“dispersion”) i.e., the average range of estimates for single borrowers across the global financial and corporate universe. This shows that the average range size rises and falls over time, but the y-axis shows that the variation in the range is small compared to the actual average range level. This suggests that mean reversion has not, so far, been an issue in the contributed dataset.
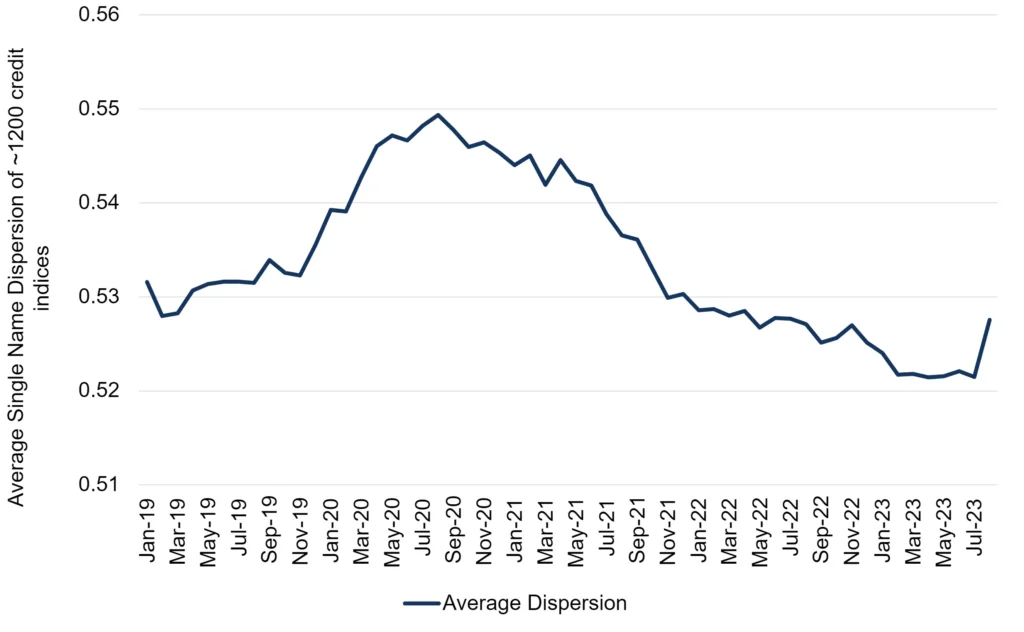
Another view of this metric is that a high value implies widespread uncertainty about individual firm credit ratings, probably around a key turning point; a low value implies a tight consensus and probably indicates that current trends will continue. This suggests that it is important for regulators to look at dispersal in the context of the current phase of the credit cycle.
Conclusion
Consensus default risk estimates, updated twice-monthly, cover 100,000+ borrowers (most of them unrated by agencies) plus 1,200 derived credit-tracking indices. The dataset provides unique insights based on robust, testable views of more than 20,000 analysts from 40+ banks globally, almost half of which are Global Systematically Important Banks (GSIBs). This dataset is increasingly used by banks to manage credit portfolio risk and economic capital.
For regulators, it is a powerful complement4 to a purely rules-based approach to oversight, highlighting clusters of systemic risk as they arise and tracking the shifting scope for credit portfolio diversification.
This paper demonstrates that:
- Public and private US Corporates that borrow from large global banks have near-identical default risk profiles. While there may be an existing selection bias within banks that favours higher quality private borrowers, it suggests that the security listing requirement for IG capital relief may be unnecessary or could provide false comfort.
- S&P default data shows that each credit crisis has a different sector profile.
- Default risk volatilities as well as correlations between industries, sectors, and credit categories change over time.
- Market-based measures of credit risk are likely to be more volatile than bank analyst estimates.
- Borrower default risk estimates from banks cover many private companies that do not have agency ratings – giving a more comprehensive view of default risk term structures and scope to calibrate a robust set of daily credit risk premium surfaces.
- There is no strong evidence of mean reversion in default risk estimates.
Download
Please complete your details to download the full “Basel Endgame”: Fixed Weight Fault Lines? Whitepaper:
- Vaguely defined as being based on bank’s internal analysis, but not (1) their internal risk model or (2) CRA ratings. In practice likely to be a mix of market, fundamental-driven, and agency views. ↩︎
- If the only issued instruments are equities it could lead to some robust debates about the role of equity prices and volatilities in credit modelling. ↩︎
- ↩︎
- ↩︎