
Bank-sourced data provides a broad cross section of forward looking default risk estimates. This dataset now also includes sufficient history to address a key question – how realistic are these estimates? Rating agencies, such as S&P, publish historically observed default rates. The publically available Annual Global Corporate Default Study and Rating Transitions, published by S&P last year, shows observed default rates from 1981 to 2016. Exhibit 1 shows the default rates for the seven main credit categories (AAA, AA, A, BBB, BB, B, C) over this period of time.
Bank-sourced consensus ratings published by Credit Benchmark are derived from ex-ante Probability of Default (“PD”) estimates. These are based on a Through-the-Cycle view, calibrated to the default experience of each contributing bank across their entire loan book. The defaults observed by S&P cover a number of credit cycles and are based on the S&P rated universe over the entire 1981-2016 period.
S&P ratings mainly cover medium and large corporates and financials, whereas the CB dataset includes a large number of SMEs. However, for approximate comparability, the PD ranges for the Credit Benchmark Consensus seven-category scale (“CBC-7”) can be plotted against the average observed S&P default rates across the full reported history.
Exhibit 1 shows the average S&P observed default rates for 1981-2016 as well as the CBC-7 PD ranges; these are plotted on a log scale.
Exhibit 1: Average S&P Default Rates and CBC-7 Scale
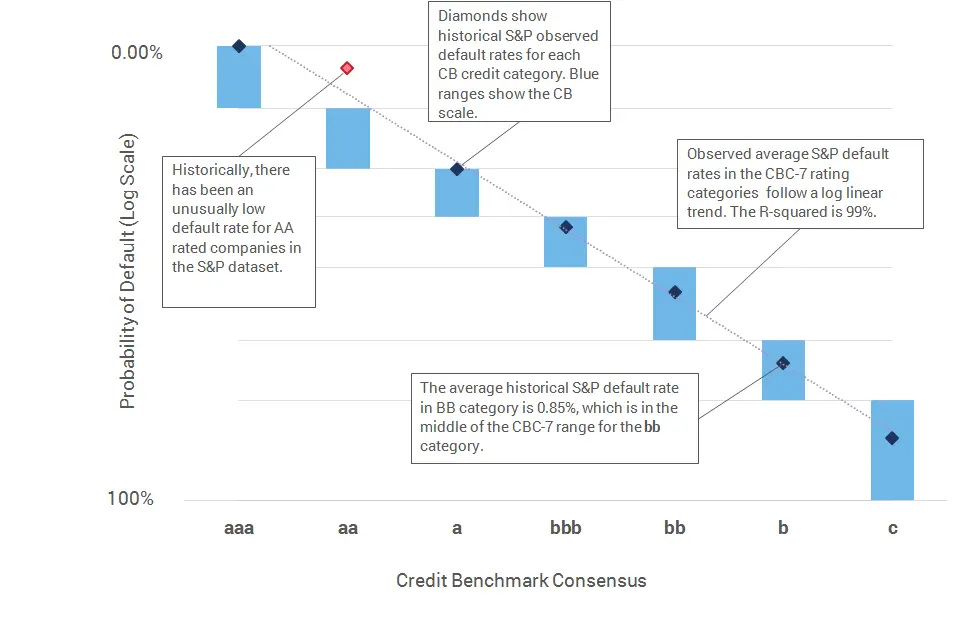
Source: S&P 2016 Annual Global Corporate Default Study and Rating Transitions, Credit Benchmark data
This shows that the average S&P observed default rate is within the CBC-7 range for most of the categories, so the CBC-7 scale is broadly in line with observed default rates. The S&P default rate average is closer to the lower bound, suggesting that the CBC-7 scale is slightly conservative. This is consistent with the company size differences between the S&P and CB data samples.
The chart also shows the log-linear regression fit, which passes through, or very close to, most of the plotted S&P data points. The notable exception is the S&P observed default rate for companies in the aa category, plotted in red; the CBC-7 aa range is much more conservative. Since this is a regression outlier, the observed default data for aa can be viewed as an anomaly, suggesting that some of the companies rated as aa are actually closer to aaa.
In conclusion, analysis of observed S&P defaults and the CBC-7 scale shows that the Credit Benchmark ranges, calibrated to a broad cross section of contributed bank estimates, are aligned with most observed default rates.