With 40+ banks regularly contributing their internal ratings to Credit Benchmark, the Credit Consensus Ratings (CCRs) are dynamic, changing frequently through time as events unfold.
This leads to a diverse range of insights which can be seen from the trends and behaviours of the entities across different industries.
Credit Benchmark’s Credit Risk IQ analytics spotlight a variety of different metrics to analyse trends and patterns.
This type of analysis shows the percentage change in the Probability of Default (PD) over the last 12 months for different credit indices constructed from the underlying entity-level Credit Consensus Ratings. This helps to easily understand and visualize the evolution of credit risk through time and the difference or similarity in behaviour among different sectors.
This type of analysis shows the percentage change in the Probability of Default (PD) over the last 12 months for different credit indices constructed from the underlying entity-level Credit Consensus Ratings. This helps to easily understand and visualize the evolution of credit risk through time and the difference or similarity in behaviour among different sectors.
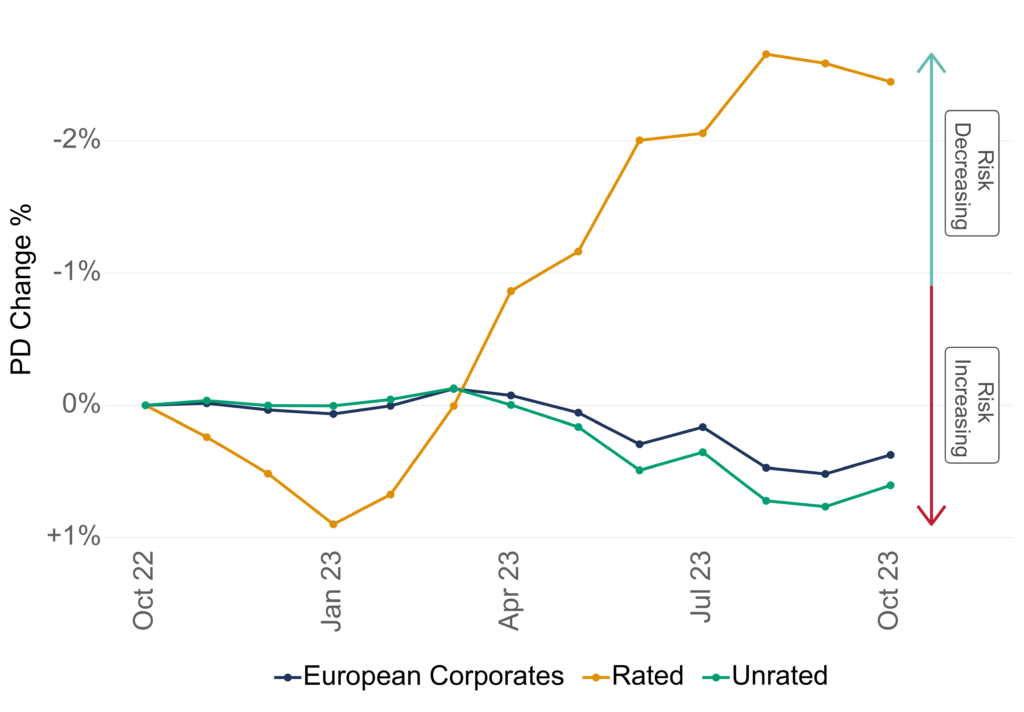
This example plots the change in credit risk as a percentage (starting from a base level in October 2022) for European Corporates, comparing rated and unrated European Corporates.
You can see that rated and unrated European Corporates experienced a divergence in credit risk that started in March 2023. Rated entities overall decreased in credit risk (-2.5% PD change over the last 12 months) while unrated entities slightly increased in credit risk starting in April 2023 (+1% PD change over the last 12 months).
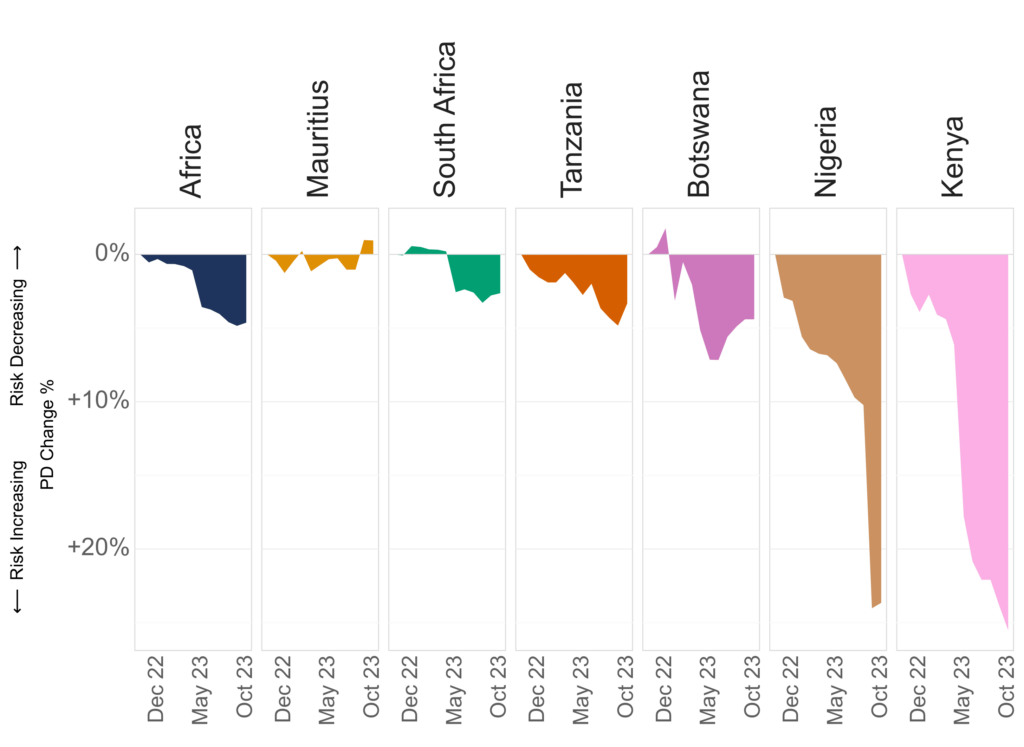
This example shows an alternative visualization of the same type of analysis, only adapting the plot to account for a greater number of segments.
You can see that there is a sharp increase in credit risk in Africa over the last year with Botswana, Nigeria, and Kenya leading the way with a respective +6%, +24%, and +27% PD increase over the last 12 months.
This plot shows the credit distribution of entities within different sectors through time. The analysis highlights the evolution of the credit distribution at 3 points in time: 12 months ago, 6 months ago, and now. This can be useful for example to track the overall rating distribution or more specifically the percentage of Investment-Grade/High-Yield ratings in particular sectors of interest through time.
This plot shows the credit distribution of entities within different sectors through time. The analysis highlights the evolution of the credit distribution at 3 points in time: 12 months ago, 6 months ago, and now. This can be useful for example to track the overall rating distribution or more specifically the percentage of Investment-Grade/High-Yield ratings in particular sectors of interest through time.
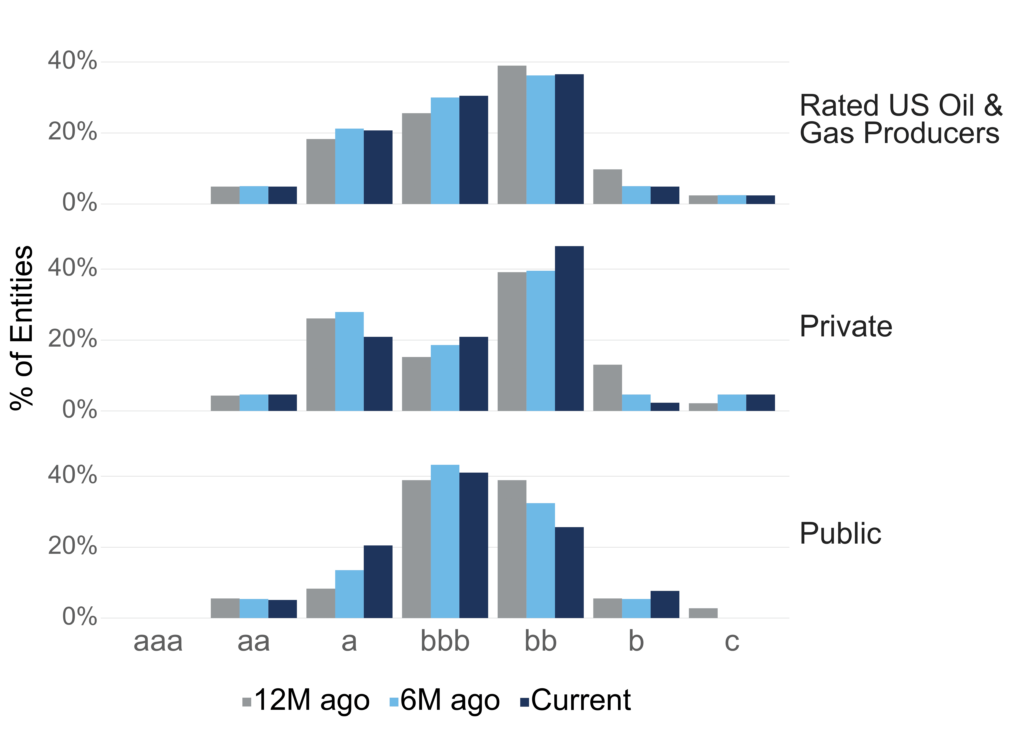
The example shows that a majority of ratings within our rated US Oil & Gas Producers segment lies in the bb category, but this proportion has been decreasing over the last 12 months.
Looking specifically at private entities within that segment, you can see that there is a higher percentage of HY (from bb to c) entities compared to the credit distribution of public entities. This might be worth monitoring as financial information on private entities is often harder to get.
The notch movements analysis illustrates how ratings have shifted over the last 12 months. It provides information on the percentage of entities that have had their ratings upgraded or downgraded by one, two, or more notches. It also offers an overview of the percentage of entities that experienced rating upgrades and downgrades.
The notch movements analysis illustrates how ratings have shifted over the last 12 months. It provides information on the percentage of entities that have had their ratings upgraded or downgraded by one, two, or more notches. It also offers an overview of the percentage of entities that experienced rating upgrades and downgrades.
In the example, Spain experienced a greater number of upgrades than downgrades. The majority of these downgrades and upgrades were by a single notch.
In the example, Spain experienced a greater number of upgrades than downgrades. The majority of these downgrades and upgrades were by a single notch.
The credit rating transition matrix analysis illustrates how entities have shifted from one rating category to another over time. The rows in the transition matrix contain the rating at the start of the period and the columns the rating at the end of the period.
The matrix shows transitions using Credit Benchmark’s four-category rating scale. The four categories are defined as:
| 4-Category Rating | 21-Category Ratings |
|---|---|
| IGa | aaa, aa+, aa, aa-, a+, a, a- |
| IGb | bbb+, bbb, bbb- |
| HYb | bb+, bb, bb-, b+, b, b- |
| HYc | ccc+, ccc, ccc-, cc, c |
For instance, looking at the first row and second column of this example credit rating transition matrix, it reveals that, out of a total of 5,642 entities, 6.6% transitioned from IGa to IGb over the specified time period.
The value in the HYc row and HYb column shows that 26.1% of the 161 HYc entities improved from HYc to HYb.
The correlation matrix analysis illustrates the relationship between month-to-month PD changes across different segments. It offers insight into how these segments relate to one another, with the following interpretations:
This analysis serves as a valuable instrument for risk management, diversification, and investment decision-making. It provides an understanding of the interconnections within credit risk across various segments.
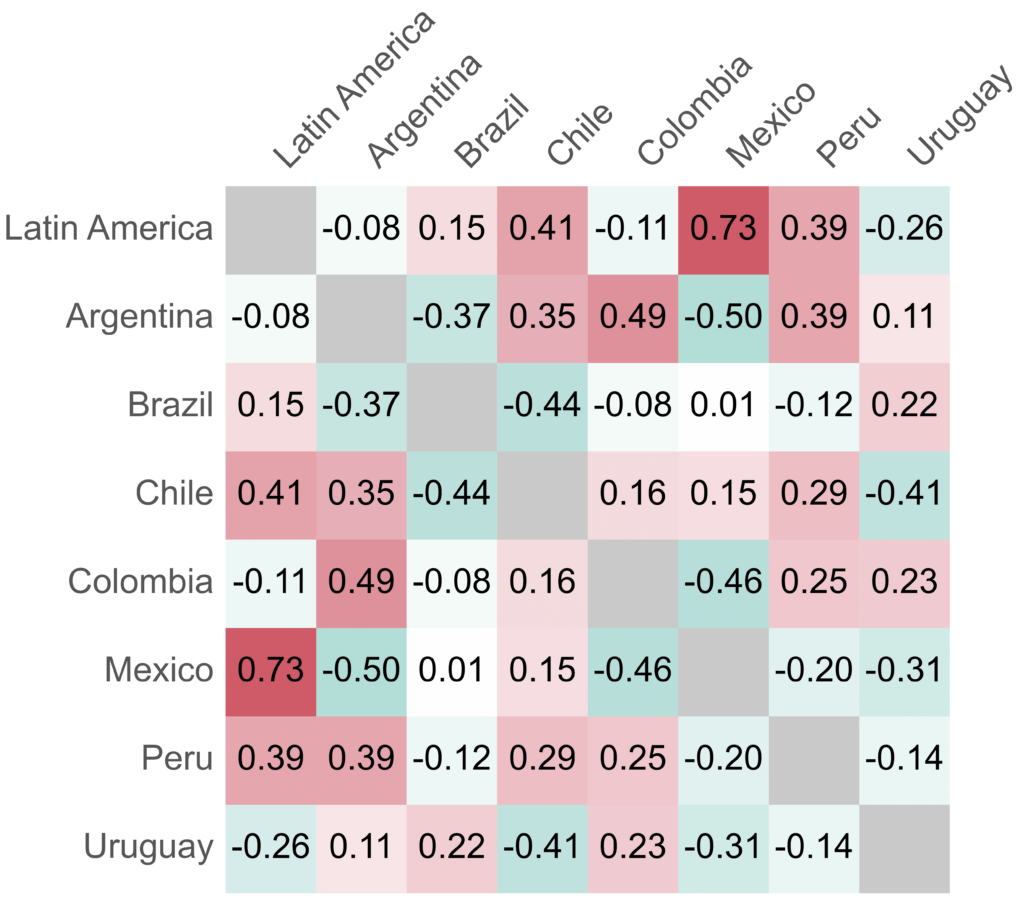
In this instance, Mexico and Argentina demonstrate the lowest correlation, with a value of -0.5. Conversely, the highest degree of correlation is observed between Mexico and the broader Latin American segment, with a value of 0.73.
In this instance, Panama and Argentina demonstrate the lowest correlation, with a value of -0.42. Conversely, the highest degree of correlation is observed between Peru and the broader Latin American segment, with a value of 0.76.
The dynamic nature of Credit Benchmark’s Credit Consensus Ratings mean that changing sentiment in credit risk can be picked up by comparing the number of entities being upgraded or downgraded.
For each sector, the number of upgrades and the number of downgrades is calculated.
The net position expressed as the percentage of upgrades minus downgrades is plotted.
If there are more upgrades in a given month, this is shown as a green bar and if there are more downgrades, this is shown as a red bar.
This type of analysis can help to pick up potential turning points in a sector where the view of credit risk starts to change.
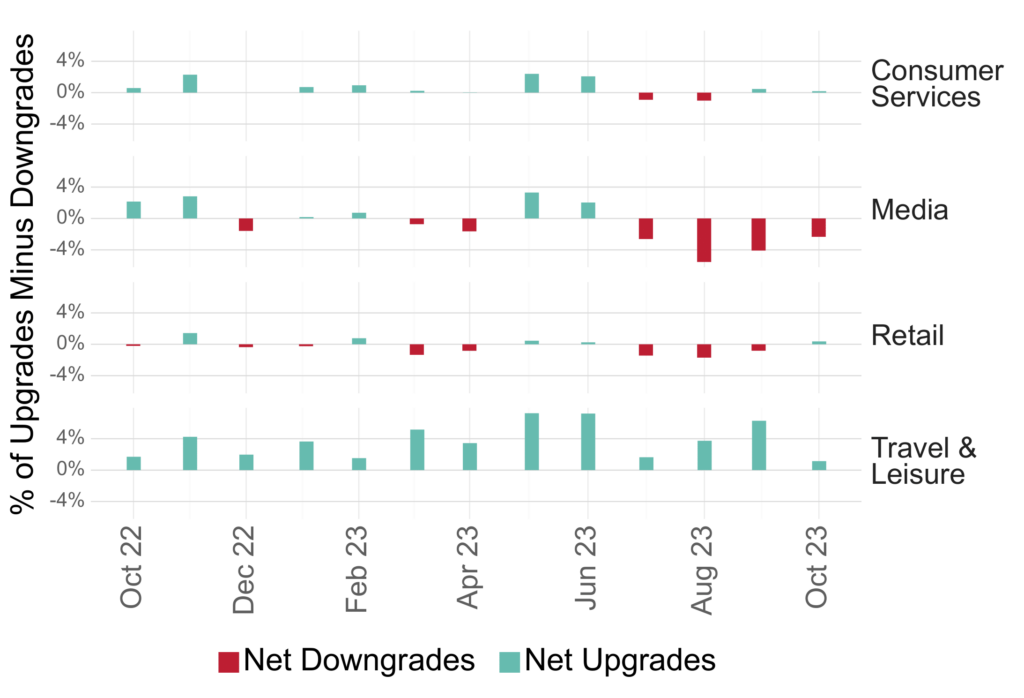
In this example, the Media and Retail industries have experienced runs of more downgrades over the 12 months shown.
In contrast, companies in the Travel & Leisure sector have continued to show more upgrades.
The Industry Reports include a breakdown of the entities making up the report, by various meta data such as: geography, industry, rated/unrated, private/public, and parent/subsidiary.
This helps better understand the type of entities in the industry and in turn, better interpret the different analyses.
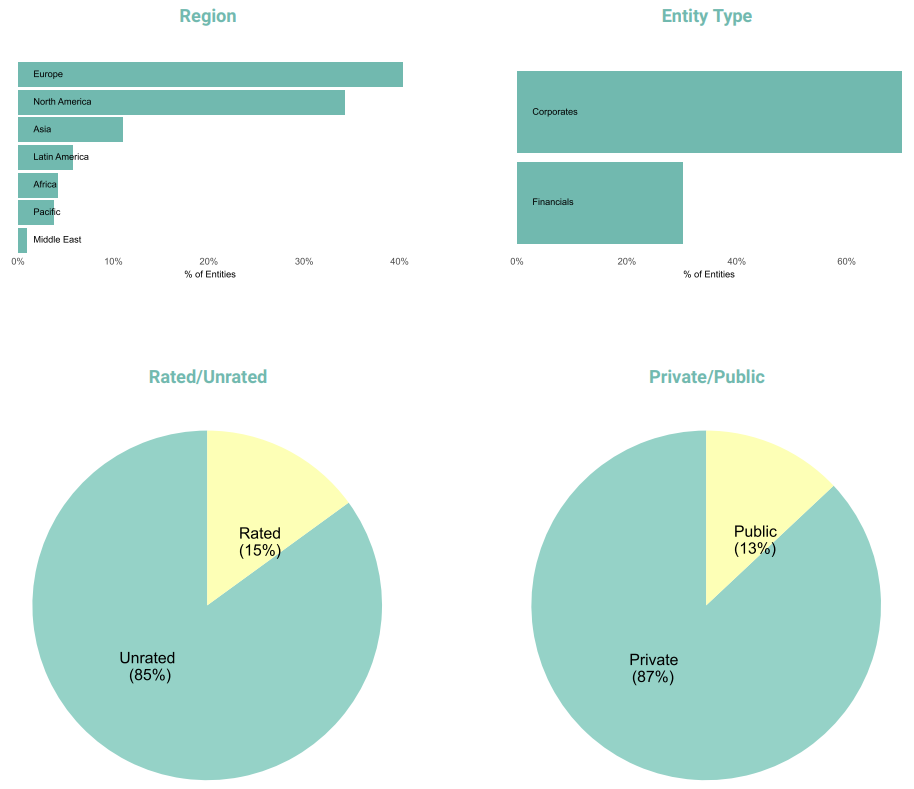
The graphs show an example breakdown of the entities included in the Industry Reports.
The majority of entities are in Europe (~40%), North America (~36%), and Asia (~12%).
About 70% are Corporates and 30% are Financials.
15% are rated by either S&P or Fitch and 85% are unrated.
13% are publicly owned and 87% are private entities.
If you are interested in seeing what Credit Consensus Ratings can offer, sign-up here to access the Industry Reports for free.

