Here are some examples to give you an idea of what the reports look like:
United States Corporates: Industry Analysis
German Financials: Super Sector Analysis
Asian Retail: Ownership Analysis

There are many ways to differentiate risk. The industry reports split the universe of consensus ratings across related segments to allow you to see where credit risk is diverging.
Credit Benchmark allows you to compare risk across a multitude of different countries spanning all regions.
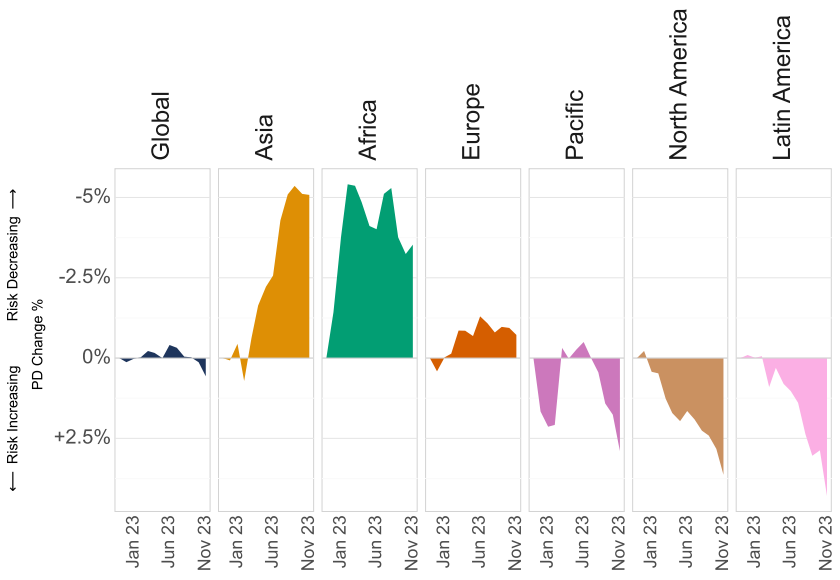
The region analysis reports compare credit risk trends across different regions.
The left graph shows how average credit risk has changed within the Consumer Services industry across Asia, Africa, Europe, Pacific, Latin America and North America throughout 2023.
Asia and Africa saw steady improvements, with risk decreasing.
This compares with North America and Latin America where risk has increased.
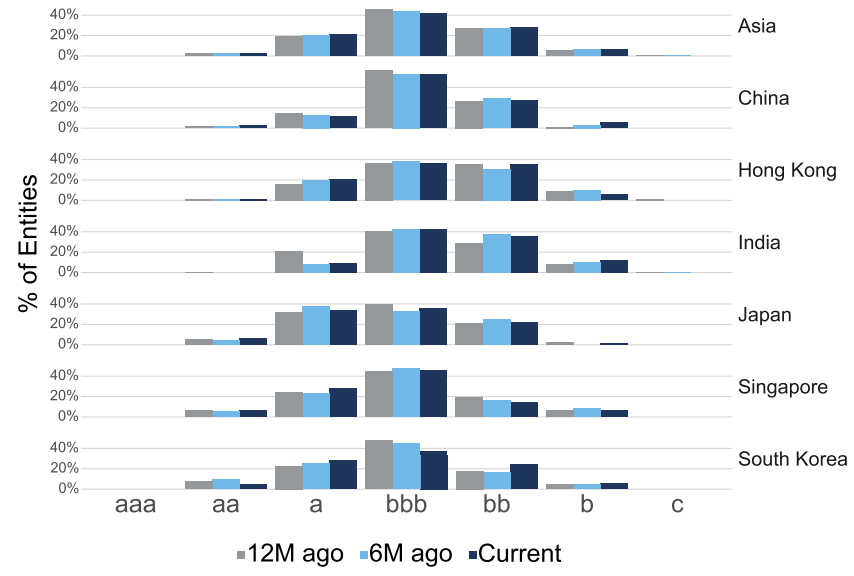
The example here shows the distribution of credit consensus ratings in Singapore, India, South Korea, Hong Kong, China and Japan, for Industrials at the end of 2023.
The Credit Benchmark dataset includes over 900 Industrial entities in Asia.
Credit Benchmark defines a hierarchical industry structure which goes from broad categorisations such as Corporates and Financials, down to more granular ones such as Trucking and Reinsurance.
The Industry Reports include comparisons across related sub-industries.
Sub sector analysis reports compare credit risk across a given sector.
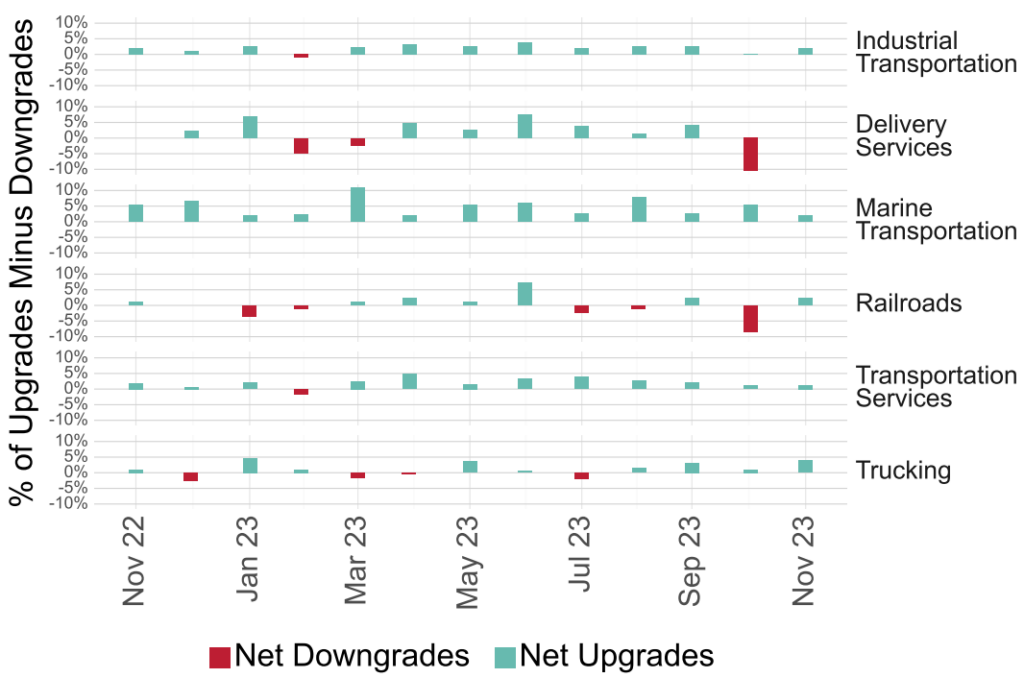
The sub sectors within the Industrial Transportation sector can be seen in the Industry Classification. They are Delivery Services, Marine Transportation, Railroads, Transportation Services and Trucking.
The graph shows whether there have been net upgrades or downgrades each month.
Delivery Services and Railroads experienced significantly more downgrades than upgrades in October 2023.
Ownership analysis reports contrast credit risk for public and private companies.
With their different abilities to raise funding and control the direction of the company private companies’ credit risk can often change differently from public ones.
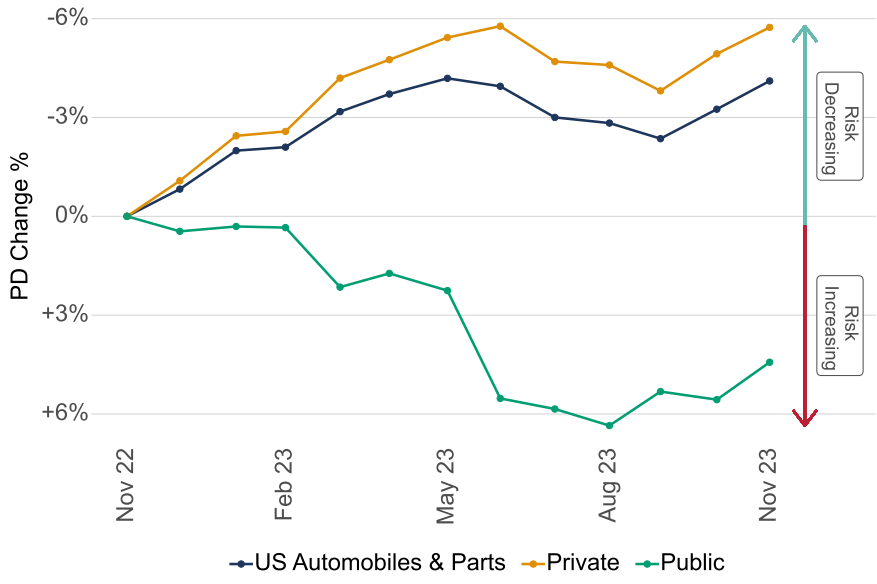
Credit Benchmark publishes a consensus rating for over 200 US Automobiles & Parts companies, of which approximately 80% are private.
Throughout 2023, private US Automobiles & Parts companies saw their credit risk decrease by 6%.
However, for public companies, it increased by 5%.
Rated/unrated analysis reports contrast credit risk for entities rated by traditional credit rating agencies (CRAs) with entities that are unrated.
Being rated by a traditional rating agency might increase the number of investors, for example by giving confidence in the company or allowing investors who may have restrictions on what they can invest in.
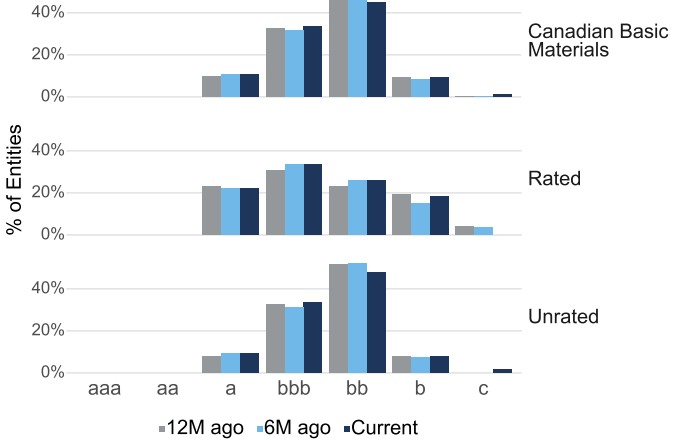
Approximately 88% of the entity-level consensus ratings for Canadian Basic Materials are unrated.
There are clear differences in the credit quality of the unrated entities and those with a rating from a CRA.
The graph shows that the CRA-rated entities are mostly spread across the a, bbb and bb ratings, while consensus ratings for unrated entities are mainly sitting in bb.
The Credit Risk IQ reports provide unique insights into how credit risk is changing across a wide range of different sectors of the economy. The breadth of the Credit Benchmark dataset means that trends and themes can be discovered that are otherwise hard to find elsewhere.
Many industries do not behave uniformly and can diverge in unexpected ways. The forward-looking nature of Credit Consensus Ratings (CCRs) means that our analyses provide an indicator of where credit risk is heading.
As an example, they could be used in the following ways:
1. Benchmark credit risk in your portfolio against Credit Benchmark’s representative credit indices.
2. Report to stakeholders on credit risk trends in relevant sectors.

If you are interested in seeing what Credit Consensus Ratings can offer, sign-up here to access the Industry Reports for free.

