High inflation and rate hikes were expected to hit the annual Black Friday sales, but early reports show mostly good news: online sales hit a record $9 billion, and Adobe Analytics figures show ebbing pandemic health concerns with shoppers returning to in-store purchases.
But the improvement could be short-lived, reflecting relief at a lockdown-free holiday period and the lure of short-term promotions.
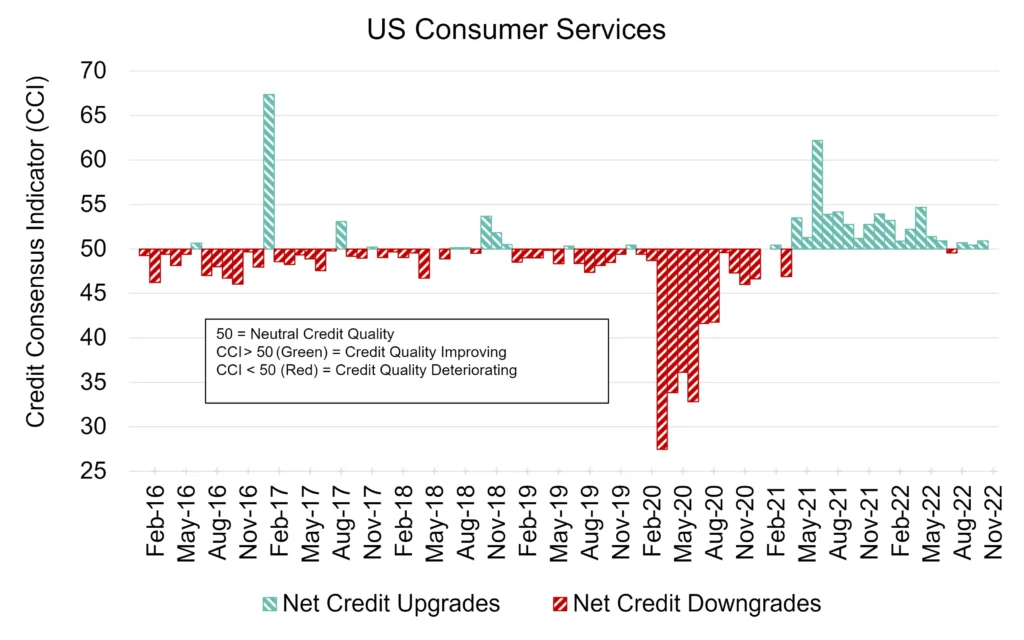
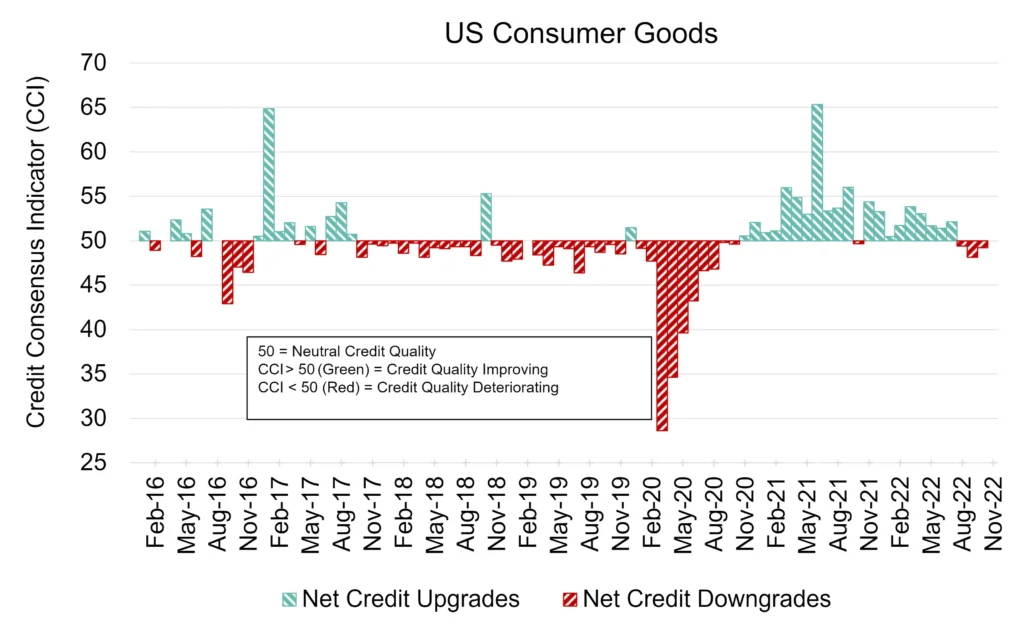
Figure 1 shows the Credit Consensus Indicators1 (CCIs) for US Consumer Services and US Consumer Goods.
Detailed consensus credit data is available on Bloomberg or via the CB Web App, covering many otherwise unrated companies. To arrange a demo of all single name and aggregate data detailed in this report, please request this by sending us an email.
Figure 1: Credit Consensus Indicators (CCIs), US Consumer Services and US Consumer Goods: Jan-16 to Oct-22


More CCI industry graphs can be found within Credit Benchmark’s monthly CCI Monitors.
Both US Consumer Services and Goods are currently hovering around neutral. US Consumer Services remains slightly positive but has not risen above 51 in the past 3 months. US Consumer Goods has been mildly negative for the past 3 months, hovering in the 48-50 range.
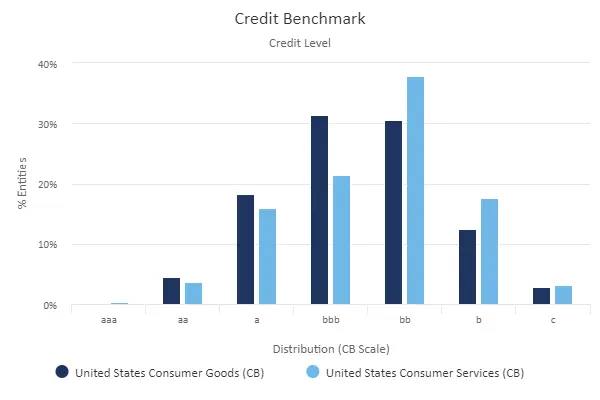
The CCIs show that US Consumer sectors are at a crossroads. Figure 2 shows that a significant proportion are in the distressed categories (b and c) with more than half of US Consumer Services below investment grade.
Figure 2: Credit Distribution, US Consumer Services and US Consumer Goods; Oct-22

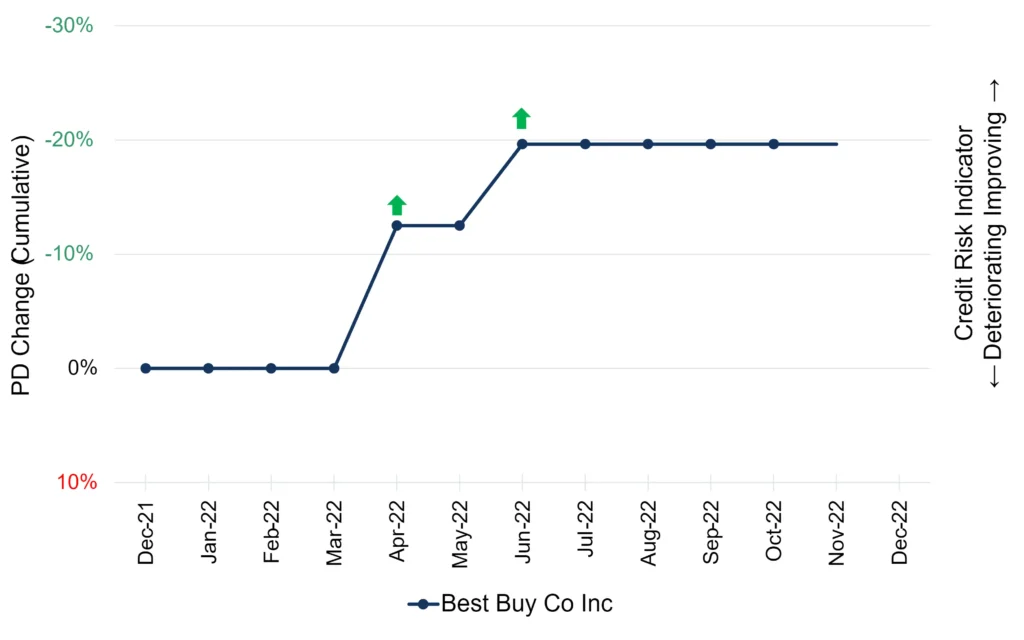
But the Black Friday stats so far suggest a good December, at least for consumer goods; if that momentum can be maintained we could see more positive CCIs across the Consumer sector. A possible bellwether is electronics retail giant Best Buy – its stock price is up 24% in the past month, and its Credit Consensus Rating (CCR) has steadily improved over the past year.
Figure 3 shows the detailed CCR credit trend for Best Buy Co Inc.
Figure 3: Credit Trend – Best Buy Co Inc

[1] The CCI is an index of forward-looking credit opinions based on the consensus views of over 20,000 credit analysts at 40+ of the world’s leading financial institutions.
Drawn from more than 950,000 contributed credit observations, the CCI tracks the total number of upgrades and downgrades made each month by credit analysts to chart the long-term trend in analyst sentiment. A monthly CCI score of 50 indicates neutral credit quality, with an equal number of upgrades and downgrades made over the course of a month. Scores above 50 indicate that credit quality is improving. Scores below 50 indicate that credit quality is deteriorating.
Enjoyed this report? If you’d like to see more consensus-based credit ratings, mid-point probabilities of default and detailed analytics on 60,000+ public and private global entities, please complete your details to start a trial or to request a coverage check:
