
Download the September Industry Monitor infographic below.
Credit Benchmark have released the end-month industry update for end-August, based on the final and complete set of the contributed credit risk estimates from 40+ global financial institutions.
The latest consensus credit data provides a mostly sunny view of corporate credit risk this month.
Overall, corporate credit is positive, with improvements blipping deteriorations by a ratio of 1.1:1. Sectors and Industries leading the pack are Construction & Materials at 1.7:1, Health Care at 1.6:1, Basic Materials at 1.5:1, followed by Technology and Industrials each at 1.3:1.
Oil & Gas remained even-footed with an improving to deteriorating ratio of 1.1:1. At a country-level, Canadian Corporates and Canadian Oil & Gas enjoyed improving fortunes, with ratios of 3.1:1 and 3.4:1 respectively. Ratios for UK and US Corporates are 1.4:1 and 2.3:1, respectively. UK Oil & Gas firms out-performed their Corporate peers with a ratio of 2.1:1, while US Oil & Gas underperformed comparatively – though still ended up positively inclined – with a ratio of 1.5:1.
The worst performing industries this month are Utilities and Telecommunications, which both saw more deterioration than improvement with ratios of 1:3.3 and 1:2, respectively.
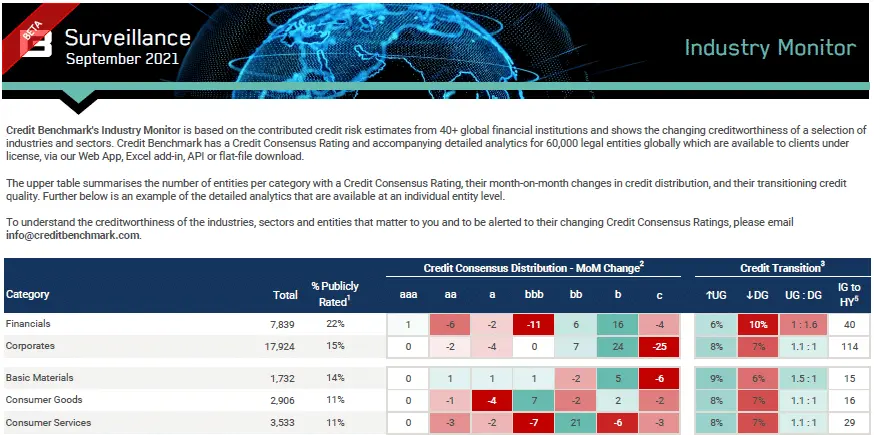
Financials also saw more deterioration than improvement with a ratio of 1:1.6.
According to David Carruthers, Head of Research at Credit Benchmark:
“Deterioration within financial firms is never a positive sign, even if the movements are small, although the financial system overall appears to be in strong shape. On the plus side, overall corporate credit looks healthy. The ongoing effects of the pandemic and interlinked supply chain challenges continue to put strain on the economy, but as we know from recent history, the situation could certainly be worse. With vaccination programs maintaining pace globally and the global economy picking up, expect to see corporate credit continue to improve.”
In the update, you will find:
- Credit Consensus Distribution Changes: The net increase or decrease of entities in the given rating category since the last update.
- Credit Transition: Assesses the month-over-month observation-level net downgrades or upgrades, shown as a percentage of the total number of entities within each category.
- Ratio: Ratio of Improvements and Deteriorations in each category since last update, calculated as Improvements : Deteriorations.
- IG to HY Migration: The number of companies which have migrated from investment-grade to high-yield since the last update (known as Fallen Angels).
Credit Benchmark will continue to provide regular reports on these migration rates. If you have any questions about the contents of this update, please get in touch.
For full details, please download the September Industry Monitor infographic here:
Error: Contact form not found.